The fund seeks long-term capital appreciation.
The tables below illustrate the fees and expenses that you may pay if you buy, hold and sell shares of the fund. You may pay other fees, such as brokerage commissions and other fees to financial intermediaries, which are not reflected in the tables and examples below. You may qualify for sales charge discounts in Class A Shares if you and your family invest, or agree to invest in the future, at least $50,000 in Virtus Funds. More information on these and other discounts is available: (i) from your financial professional or other financial intermediary; (ii) under “Sales Charges” on page 74 of the fund’s prospectus; (iii) with respect to purchase of shares through specific intermediaries, in Appendix A to the fund’s prospectus, entitled “Intermediary Sales Charge Discounts and Waivers;” and (iv) under “Alternative Purchase Arrangements” on page 113 of the fund’s SAI.
Shareholder Fees - Virtus NFJ Global Sustainability Fund |
Class A Shares |
Institutional Class Shares |
Class P Shares |
|---|---|---|---|
| Maximum Sales Charge Imposed on Purchases (as a percentage of Offering Price) | 5.50% | none | none |
| Maximum Deferred Sales Charge (as a percentage of Offering Price) | none | none | none |
Annual Fund Operating Expenses - Virtus NFJ Global Sustainability Fund |
Class A Shares |
Institutional Class Shares |
Class P Shares |
|
|---|---|---|---|---|
| Management Fees | 0.80% | 0.80% | 0.80% | |
| Distribution and Shareholder Servicing (12b-1) Fees | 0.25% | none | none | |
| Other Expenses | 0.37% | 0.26% | 0.33% | |
| Total Annual Fund Operating Expenses | 1.42% | 1.06% | 1.13% | |
| Less: Fee Waiver and/or Expense Reimbursement | [1] | (0.48%) | (0.37%) | (0.34%) |
| Total Annual Fund Operating Expenses After Expense Reimbursement | [1] | 0.94% | 0.69% | 0.79% |
| [1] | The fund’s investment adviser has contractually agreed to limit the fund’s total operating expenses (excluding certain expenses, such as taxes, leverage and borrowing expenses (such as commitment, amendment and renewal expenses on credit or redemption facilities), interest, brokerage commissions, expenses incurred in connection with any merger or reorganization, unusual or infrequently occurring expenses (such as litigation), acquired fund fees and expenses, and dividend expenses, if any) so that such expenses do not exceed 0.94% for Class A Shares, 0.69% for Institutional Class Shares, 0.79% for Class P Shares and through February 1, 2024. Following the contractual period, the adviser may discontinue these expense reimbursement arrangements at any time. Under certain conditions, the adviser may recapture operating expenses reimbursed and/or fees waived under these arrangements for a period of three years following the date such waiver or reimbursement occurred, provided that the recapture does not cause the fund to exceed its expense limit in effect at the time of the waiver or reimbursement, and any in effect at the time of recapture, after repayment is taken into account. |
This example is intended to help you compare the cost of investing in the fund with the cost of investing in other mutual funds. The example assumes that you invest $10,000 in the fund for the time periods indicated and then redeem all of your shares at the end of those periods or continued to hold them. The example also assumes that your investment has a 5% return each year, that the fund’s operating expenses remain the same and that the expense reimbursement agreement remains in place for the contractual period. Although your actual costs may be higher or lower, based on these assumptions your costs would be:
Expense Example - Virtus NFJ Global Sustainability Fund - USD ($) |
Class A Shares |
Institutional Class Shares |
Class P Shares |
|---|---|---|---|
| 1 Year | $ 641 | $ 70 | $ 81 |
| 3 Years | 930 | 300 | 325 |
| 5 Years | 1,240 | 549 | 589 |
| 10 Years | $ 2,119 | $ 1,261 | $ 1,344 |
Expense Example, No Redemption - Virtus NFJ Global Sustainability Fund - USD ($) |
Class A Shares |
Institutional Class Shares |
Class P Shares |
|---|---|---|---|
| 1 Year | $ 641 | $ 70 | $ 81 |
| 3 Years | 930 | 300 | 325 |
| 5 Years | 1,240 | 549 | 589 |
| 10 Years | $ 2,119 | $ 1,261 | $ 1,344 |
The fund pays transaction costs, such as commissions, when it buys and sells securities (or “turns over” its portfolio). A higher portfolio turnover rate may indicate higher transaction costs and may result in higher taxes when fund shares are held in a taxable account. These costs, which are not reflected in annual fund operating expenses or in the example, affect the fund’s performance. During the most recent fiscal year, the fund’s portfolio turnover rate was 70% of the average value of its portfolio.
The fund seeks to achieve its investment objective by creating a portfolio of global equities with a focus on companies that the portfolio managers believe exhibit strong records with respect to environmental, social, and corporate governance (“ESG”) factors. The fund normally invests primarily in equity securities of both U.S. and non-U.S. companies, including emerging market securities. Under normal market conditions, the fund will invest at least 40% of its assets in non-U.S. securities. Notwithstanding the previous sentence, if the weighting of non-U.S. securities in the Dow Jones Sustainability World Index (the “Index”) drops below 45%, the fund may invest a lower amount in non-U.S. securities, which will normally be such that the minimum level for non-U.S. securities will be 5% below the weighting of non-U.S. securities in the Index as of the most
recently published month-end composition. As of June 30, 2022, the capitalization weighting of non-U.S. securities in the Index was approximately 48.5%. The fund is not managed with reference to the Index, and its primary performance benchmark is the MSCI ACWI. The portfolio managers intend to diversify the fund’s investments across geographic regions and economic sectors. The fund intends, but is not required, to hold stocks that are not included in the benchmark index. The fund may invest in issuers of any size market capitalization, including smaller capitalization companies. The fund may achieve its exposure to non-U.S. securities either directly or through depository receipts such as Global Depositary Receipts (GDRs).
The portfolio managers begin with an investment universe comprised of more than 5,000 equity securities and assess individual securities using a disciplined investment process that integrates a focus on the ESG records of the issuers of such securities with proprietary fundamental, company- specific research and quantitative analysis. The portfolio managers utilize a sector analysis to screen out issuers based on revenue from sectors such as tobacco, thermal coal, alcohol, gambling and weapons.
The portfolio managers use a proprietary ESG model scoring to evaluate and rate the securities in the investment universe. Based on this proprietary ESG scoring model, companies’ ESG practices and risk factors are considered as part of the investment process, namely for the purposes of identifying tail risk factors (i.e., low probability factors that could have an outsized negative effect on performance) arising from a company’s ESG practices and understanding how a company’s ESG risk factors might affect the company and its performance. The portfolio managers believe that there are long-term benefits in an investment approach that attaches material weight to certain issues that receive less attention from traditional investment analysis, such as the environment, workplace relations, human rights, community relations, product safety and impact, and corporate governance and business ethics. The portfolio managers also believe that investing in companies with strong records for managing ESG risks can generate long-term competitive financial returns and positive societal impact and that companies that do not exhibit strong records with respect to ESG factors may be at a greater long-term risk of negative economic consequences. With respect to ESG factors, the portfolio managers will aim to invest the majority of the fund’s portfolio in stocks that they rate as best-in-class (i.e., NFJ ESG rated AAA, AA or A) and avoid stocks rated worst-in-class (i.e., NFJ rated B and CCC), although the portfolio managers maintain discretion to invest from time to time in companies with minimum ESG scores and to exclude companies with high ESG scores from the fund’s portfolio.
The portfolio managers then analyze specific companies for possible investment through a disciplined, fundamental, bottom up-research process and quantitative analysis. In identifying potential investments, the portfolio managers ordinarily look for companies that exhibit some or all of the following characteristics: a strong record with respect to ESG factors; a demonstrated record of ESG risk management; long-term competitive advantage; a strong balance sheet; high barriers to entry in the company’s industry or area of business; and a strong record of capital discipline. The portfolio managers then seek to identify attractively-valued quality companies that exhibit growth characteristics. The portfolio managers construct the fund’s portfolio with the expectation that stock-specific risk will drive the fund’s returns over a complete market cycle and may reallocate the portfolio’s holdings in attempting to mitigate other risk factors, such as currency risk, country/regional risk, investment style risk, and sector risk, among others. Under normal circumstances, the portfolio managers typically select approximately 40 to 60 stocks for the fund.
The fund may not achieve its objective(s), and it is not intended to be a complete investment program. The value of the fund’s investments that supports your share value may decrease. If between the time you purchase shares and the time you sell shares the value of the fund’s investments decreases, you will lose money. Investment values can decrease for a number of reasons. Conditions affecting the overall economy, specific industries or companies in which the fund invests can be worse than expected, and investments may fail to perform as the subadviser expects. As a result, the value of your shares may decrease. Purchase and redemption activities by fund shareholders may impact the management of the fund and its ability to achieve its investment objective(s). The principal risks of investing in the fund are identified below (in alphabetical order after the first five risks).
> Market Volatility Risk. The value of the securities in the fund may go up or down in response to the prospects of individual companies and/or general economic conditions. Price changes may be short- or long-term. Local, regional or global events such as war or military conflict (e.g. Russia’s invasion of Ukraine), acts of terrorism, the spread of infectious illness or other public health issue, recessions, or other events could have a significant impact on the fund and its investments, including hampering the ability of the fund’s portfolio manager(s) to invest the fund’s assets as intended.
> Issuer Risk. The fund will be affected by factors specific to the issuers of securities and other instruments in which the fund invests, including actual or perceived changes in the financial condition or business prospects of such issuers.
> Equity Securities Risk. The value of the stocks held by the fund may be negatively affected by the financial market, industries in which the fund invests, or issuer-specific events. Focus on a particular style or in small or medium-sized companies may enhance that risk.
> Foreign Investing Risk. Investing in foreign securities subjects the fund to additional risks such as increased volatility; currency fluctuations; less liquidity; less publicly available information about the foreign investment; and political, regulatory, economic, and market risk.
> Sustainable Investing Risk. Because the fund focuses on investments in companies that the fund’s subadviser believes exhibit strong environmental, social, and corporate governance records, the fund’s universe of investments may be smaller than that of other funds and broad equity benchmark indices.
> Allocation Risk. If the fund’s exposure to equities and fixed income securities, or to other asset classes, deviates from the intended allocation, or if the fund’s allocation is not optimal for market conditions at a given time, the fund’s performance may suffer.
> Counterparty Risk. A counterparty to a derivatives contract, repurchase agreement, a loan of portfolio securities or an unsettled transaction may be unable or unwilling to make timely settlement payments or otherwise honor its obligations to the fund.
> Credit Risk. If the issuer of a debt instrument fails to pay interest or principal in a timely manner, or negative perceptions exist in the market of the issuer’s ability to make such payments, the price of the security may decline.
> Currency Rate Risk. Fluctuations in the exchange rates between the U.S. dollar and foreign currencies may negatively affect the value of the fund’s shares.
> Depositary Receipts Risk. Investments in foreign companies through depositary receipts may expose the fund to the same risks as direct investments in securities of foreign issuers.
> Emerging Markets Risk. Foreign investing risk may be particularly high to the extent that the fund invests in emerging market securities. Emerging markets securities may be more volatile, or more greatly affected by negative conditions, than those of their counterparts in more established foreign markets.
> Focused Investment Risk. To the extent the fund focuses its investments on a limited number of issuers, sectors, industries or geographic regions, it may be subject to increased risk and volatility.
> Liquidity Risk. Certain securities may be substantially less liquid than many other securities, such as U.S. Government securities or common stocks. To the extent the fund invests in less liquid securities or the level of liquidity in a particular market is constrained, the lack of an active market for investments may cause delay in disposition or force a sale below fair value.
> Redemption Risk. One or more large shareholders or groups of shareholders may redeem their holdings in the fund, resulting in an adverse impact on remaining shareholders in the fund by causing the fund to take actions it would not otherwise have taken.
> Small and Medium Market Capitalization Risk. The fund’s investments in small and medium market capitalization companies may increase the volatility and risk of loss to the fund, as compared with investments in larger, more established companies.
Please see “More Information About Risks Related to Principal Investment Strategies” in the fund’s prospectus for a more detailed description of the fund’s risks.
The bar chart and table below provide some indication of the potential risks of investing in the fund. The fund’s past performance, before and after taxes, is not necessarily an indication of how the fund will perform in the future. The current subadviser commenced providing services for the fund in July 2022 and therefore the returns shown in the table for periods prior to that date reflect the performance of other investment professionals.
The bar chart shows changes in the fund’s performance from year to year over the life of the fund. The table shows how the fund’s average annual returns compare to those of two broad-based securities market indexes. Updated performance information is available at virtus.com or by calling 800-243-1574.
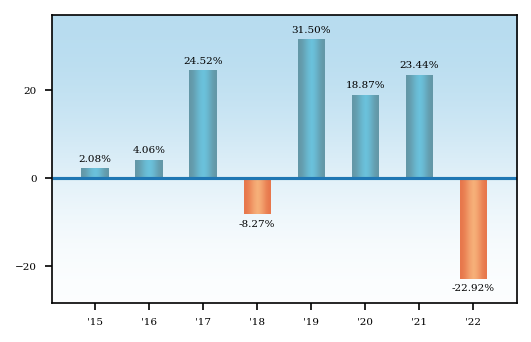
Best Quarter: | 2020, Q2: | 20.34% | Worst Quarter: | 2020, Q1: | -17.56% |
Returns reflect deduction of maximum sales charges and full redemption at end of periods shown.
Average Annual Total Returns - Virtus NFJ Global Sustainability Fund |
Label |
1 Year |
5 Years |
Since Inception |
Inception Date |
|---|---|---|---|---|---|
| Class A Shares | Return Before Taxes | (27.35%) | 4.96% | 6.32% | Dec. 09, 2014 |
| Institutional Class Shares | Return Before Taxes | (22.92%) | 6.41% | 7.32% | Dec. 09, 2014 |
| Institutional Class Shares | After Taxes on Distributions | Return After Taxes on Distributions | (26.86%) | 3.51% | 5.24% | Dec. 09, 2014 |
| Institutional Class Shares | After Taxes on Distributions and Sales | Return After Taxes on Distributions and Sale of Fund Shares | (10.71%) | 4.88% | 5.64% | Dec. 09, 2014 |
| Class P Shares | Return Before Taxes | (23.03%) | 6.30% | 7.22% | Dec. 09, 2014 |
| MSCI All Country World Index (net) | MSCI All Country World Index (net) (reflects no deduction for fees, expenses or taxes) | (18.36%) | 5.23% | 6.59% | Dec. 09, 2014 |
| Dow Jones Sustainability World Index (net) | Dow Jones Sustainability World Index (net) (reflects no deduction for fees, expenses or taxes) | (16.04%) | 6.11% | 7.00% | Dec. 09, 2014 |
The MSCI All Country World Index (net) is a free float-adjusted market capitalization-weighted index that measures equity performance of developed and emerging markets. The Dow Jones Sustainability World Index (net) tracks the performance of the top 10% of the 2,500 largest companies in the S&P Global Broad Market
Index that are the world’s sustainability leaders based on economic, environmental and social criteria. The indexes are calculated on a total return basis. The indexes are unmanaged and not available for direct investment.
After-tax returns are calculated using the historical highest individual federal marginal income tax rates and do not reflect the impact of state and local taxes. After-tax returns are shown only for Institutional Class Shares; after-tax returns for other classes will vary. Actual after-tax returns depend on the investor’s tax situation and may differ from those shown. After-tax returns are not relevant to investors who hold fund shares in tax-deferred accounts or to shares held by non-taxable entities. In certain cases, the Return After Taxes on Distributions and Sale of Fund Shares for a period may be higher than other return figures for the same period. This will occur when a capital loss is realized upon the sale of fund shares and provides an assumed tax benefit that increases the return.