
4th Quarter 2022 Results Investor Presentation Exhibit 99.2
Cautionary Statements This presentation contains forward-looking statements, as defined by federal securities laws, including, among other forward-looking statements, certain plans, expectations and goals. Words such as “may,” “believe,” “expect,” “anticipate,” “intend,” “will,” “should,” “plan,” “estimate,” “predict,” “continue” and “potential” or the negative of these terms or other comparable terminology, as well as similar expressions, are meant to identify forward-looking statements. The forward-looking statements in this presentation are based on current expectations and are provided to assist in the understanding of potential future performance. Such forward-looking statements involve numerous assumptions, risks and uncertainties that may cause actual results to differ materially from those expressed or implied in any such statements, including, without limitation, the following: general competitive, economic, unemployment, political and market conditions and fluctuations, including real estate market conditions, and the effects of such conditions and fluctuations on the creditworthiness of borrowers, collateral values, asset recovery values and the value of investment securities; movements in interest rates and their impacts on net interest margin; expectations on credit quality and performance; legislative and regulatory changes; changes in U.S. government monetary and fiscal policy; competitive pressures on product pricing and services; the cost savings and any revenue synergies expected to result from acquisition transactions, which may not be fully realized within the expected timeframes if at all; the success and timing of other business strategies; our outlook and long-term goals for future growth; and natural disasters, geopolitical events, acts of war or terrorism or other hostilities, public health crises and other catastrophic events beyond our control. For a discussion of some of the other risks and other factors that may cause such forward-looking statements to differ materially from actual results, please refer to the Company’s filings with the Securities and Exchange Commission, including the Company’s Annual Report on Form 10-K for the year ended December 31, 2021 and the Company’s subsequently filed periodic reports and other filings. Forward-looking statements speak only as of the date they are made, and the Company undertakes no obligation to update or revise forward-looking statements.
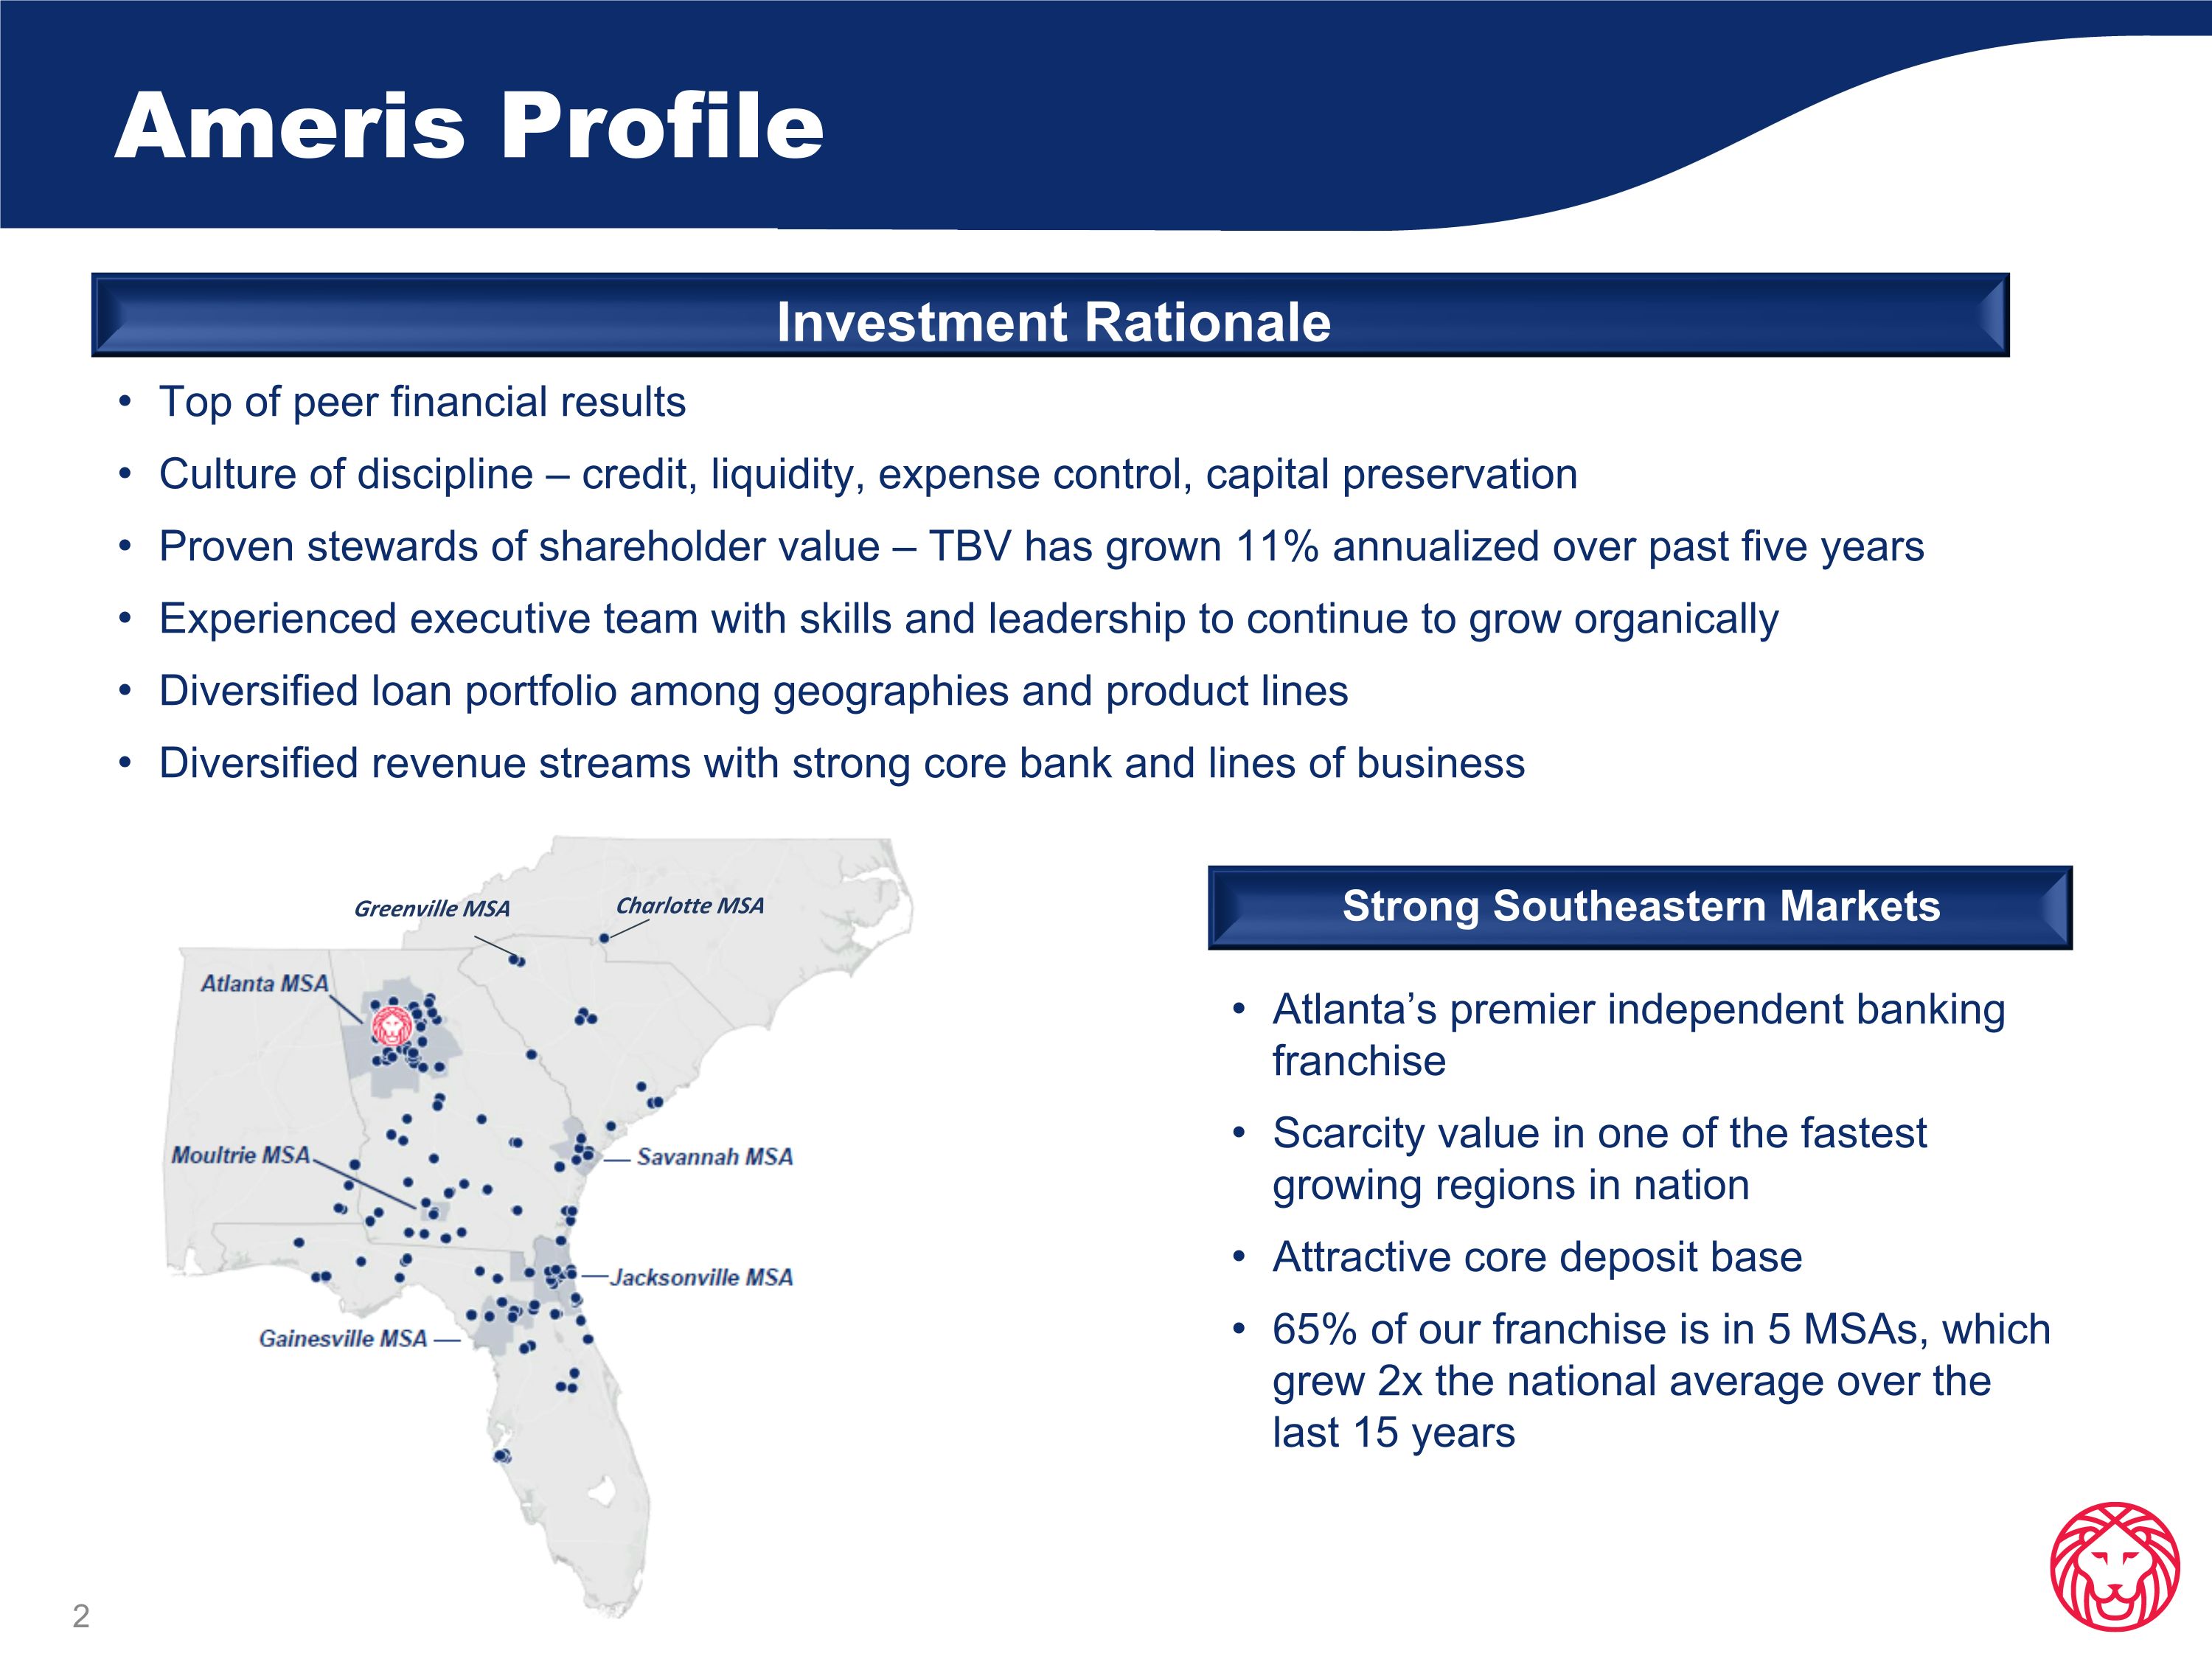
Ameris Profile Investment Rationale Top of peer financial results Culture of discipline – credit, liquidity, expense control, capital preservation Proven stewards of shareholder value – TBV has grown 11% annualized over past five years Experienced executive team with skills and leadership to continue to grow organically Diversified loan portfolio among geographies and product lines Diversified revenue streams with strong core bank and lines of business Strong Southeastern Markets Atlanta’s premier independent banking franchise Scarcity value in one of the fastest growing regions in nation Attractive core deposit base 65% of our franchise is in 5 MSAs, which grew 2x the national average over the last 15 years Greenville MSA Charlotte MSA
4th Quarter 2022 Financial Results
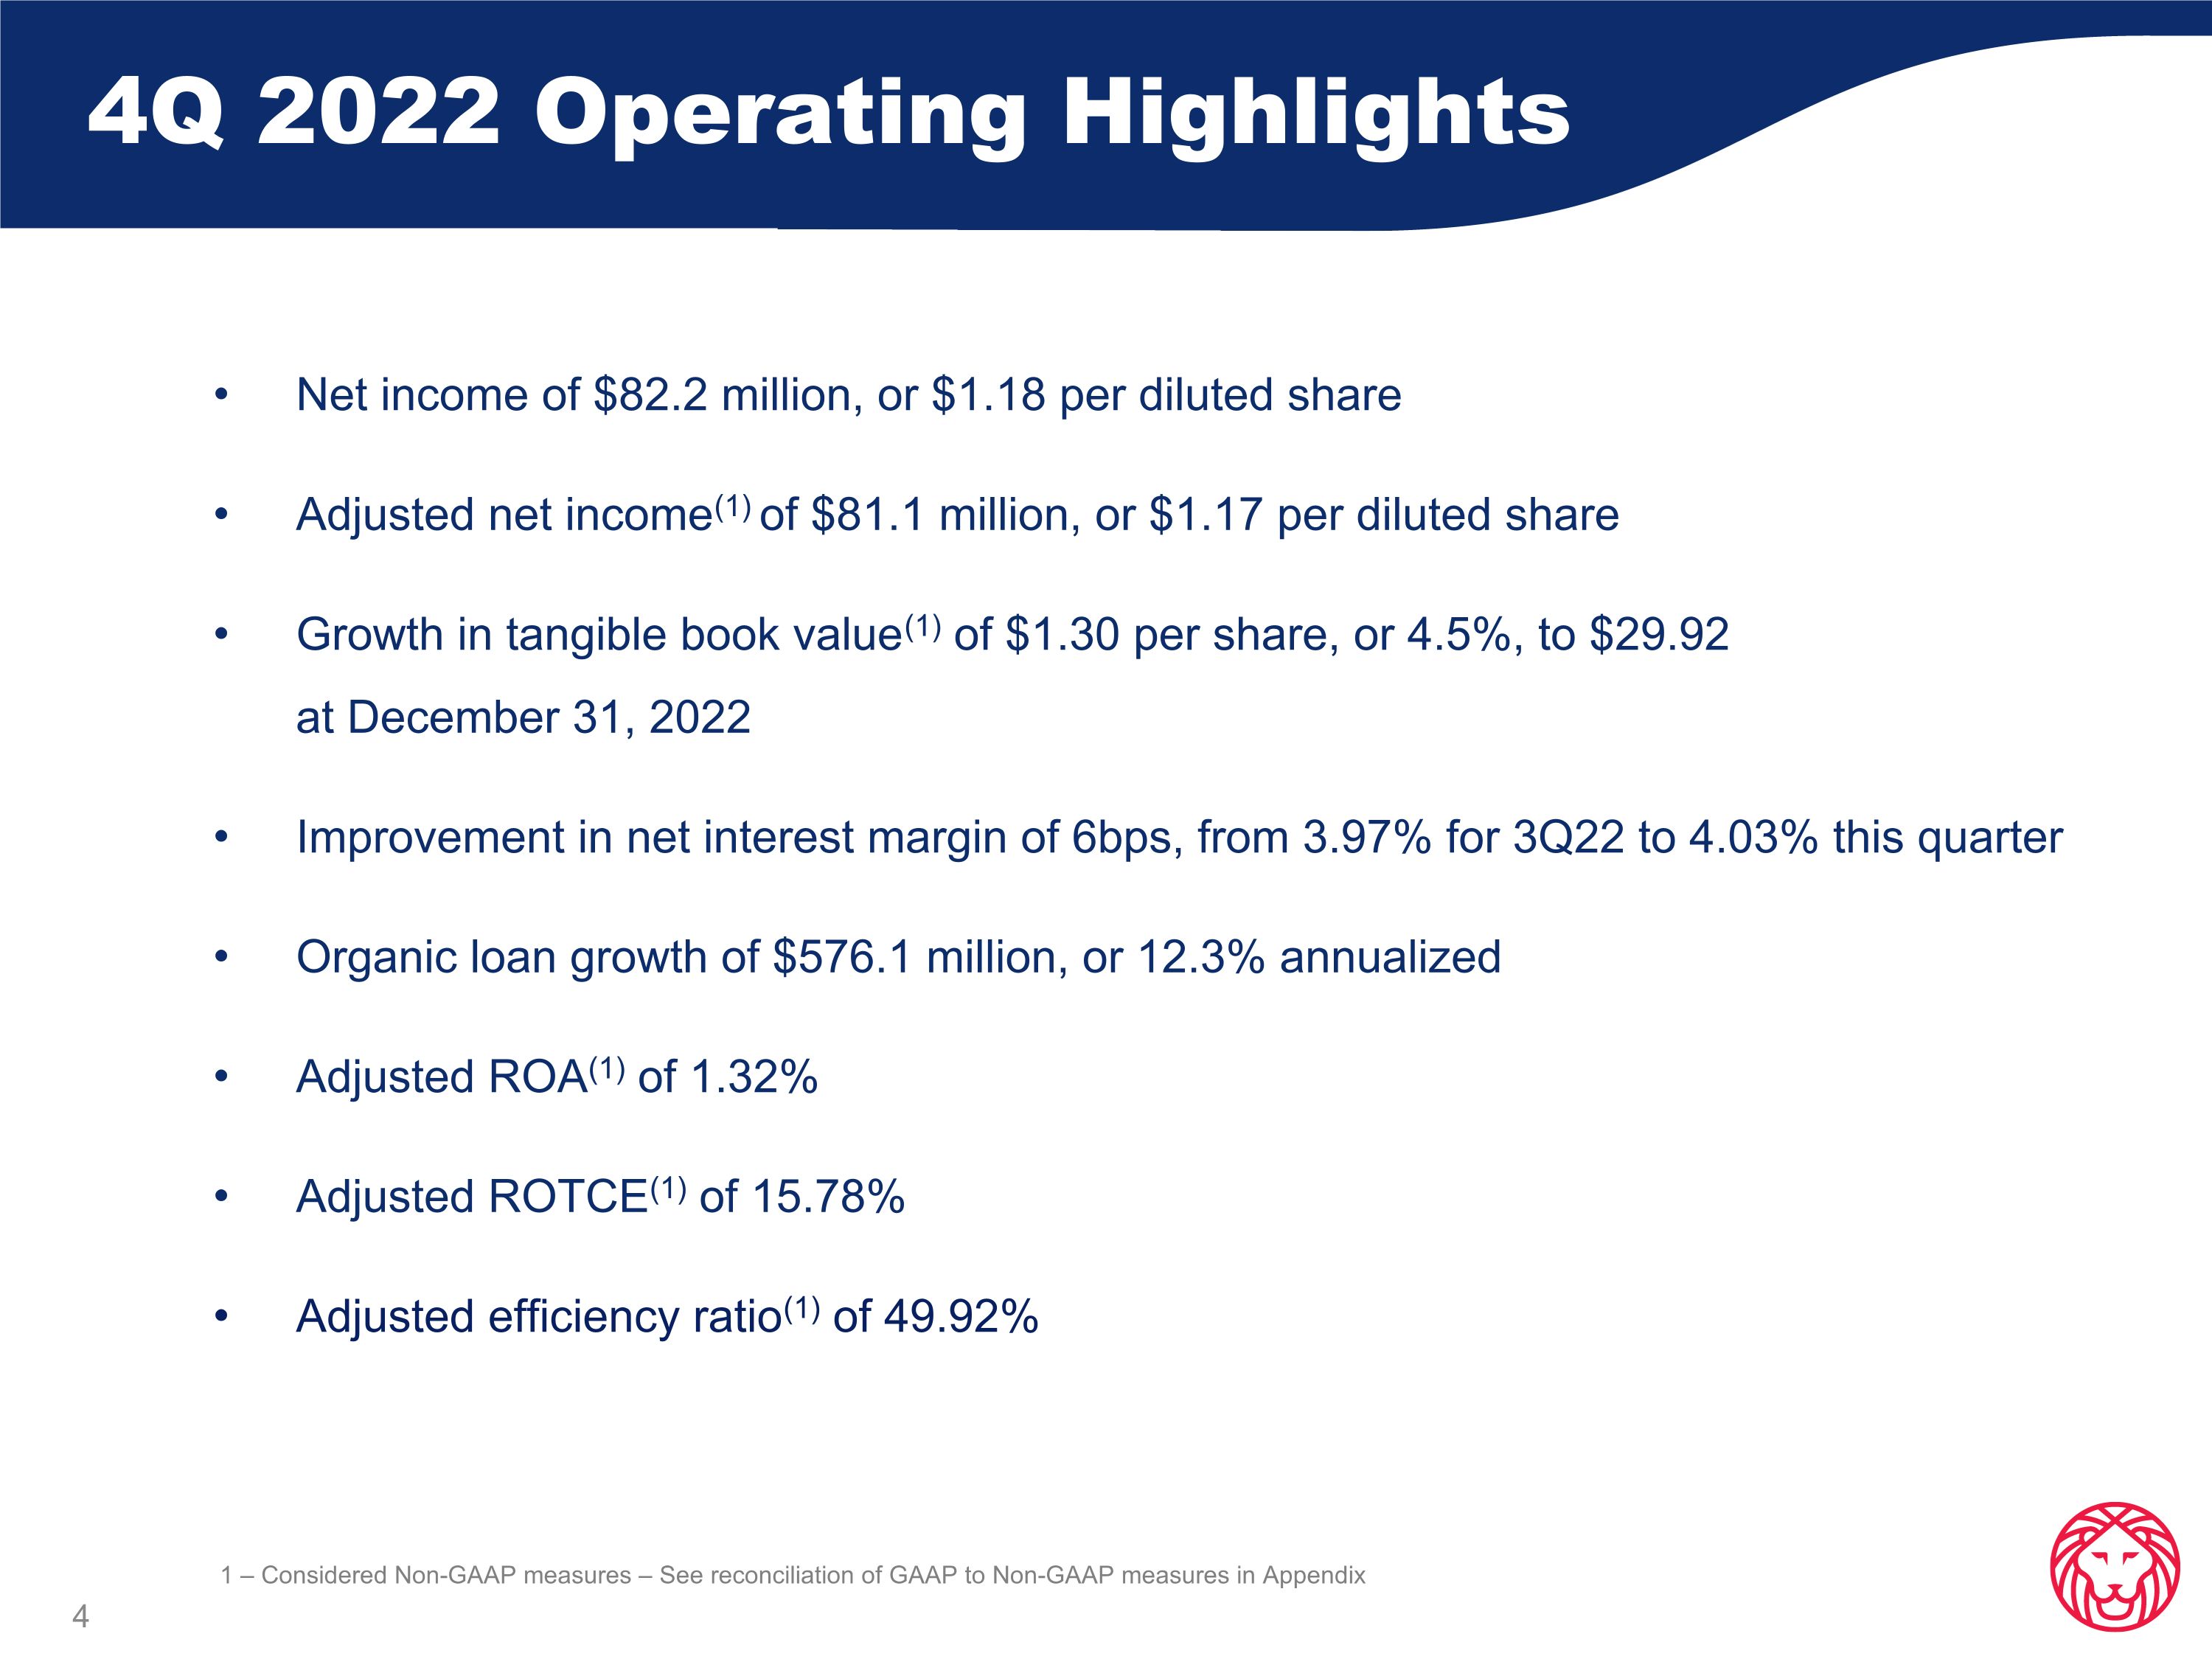
4Q 2022 Operating Highlights Net income of $82.2 million, or $1.18 per diluted share Adjusted net income(1) of $81.1 million, or $1.17 per diluted share Growth in tangible book value(1) of $1.30 per share, or 4.5%, to $29.92 at December 31, 2022 Improvement in net interest margin of 6bps, from 3.97% for 3Q22 to 4.03% this quarter Organic loan growth of $576.1 million, or 12.3% annualized Adjusted ROA(1) of 1.32% Adjusted ROTCE(1) of 15.78% Adjusted efficiency ratio(1) of 49.92% 1 – Considered Non-GAAP measures – See reconciliation of GAAP to Non-GAAP measures in Appendix
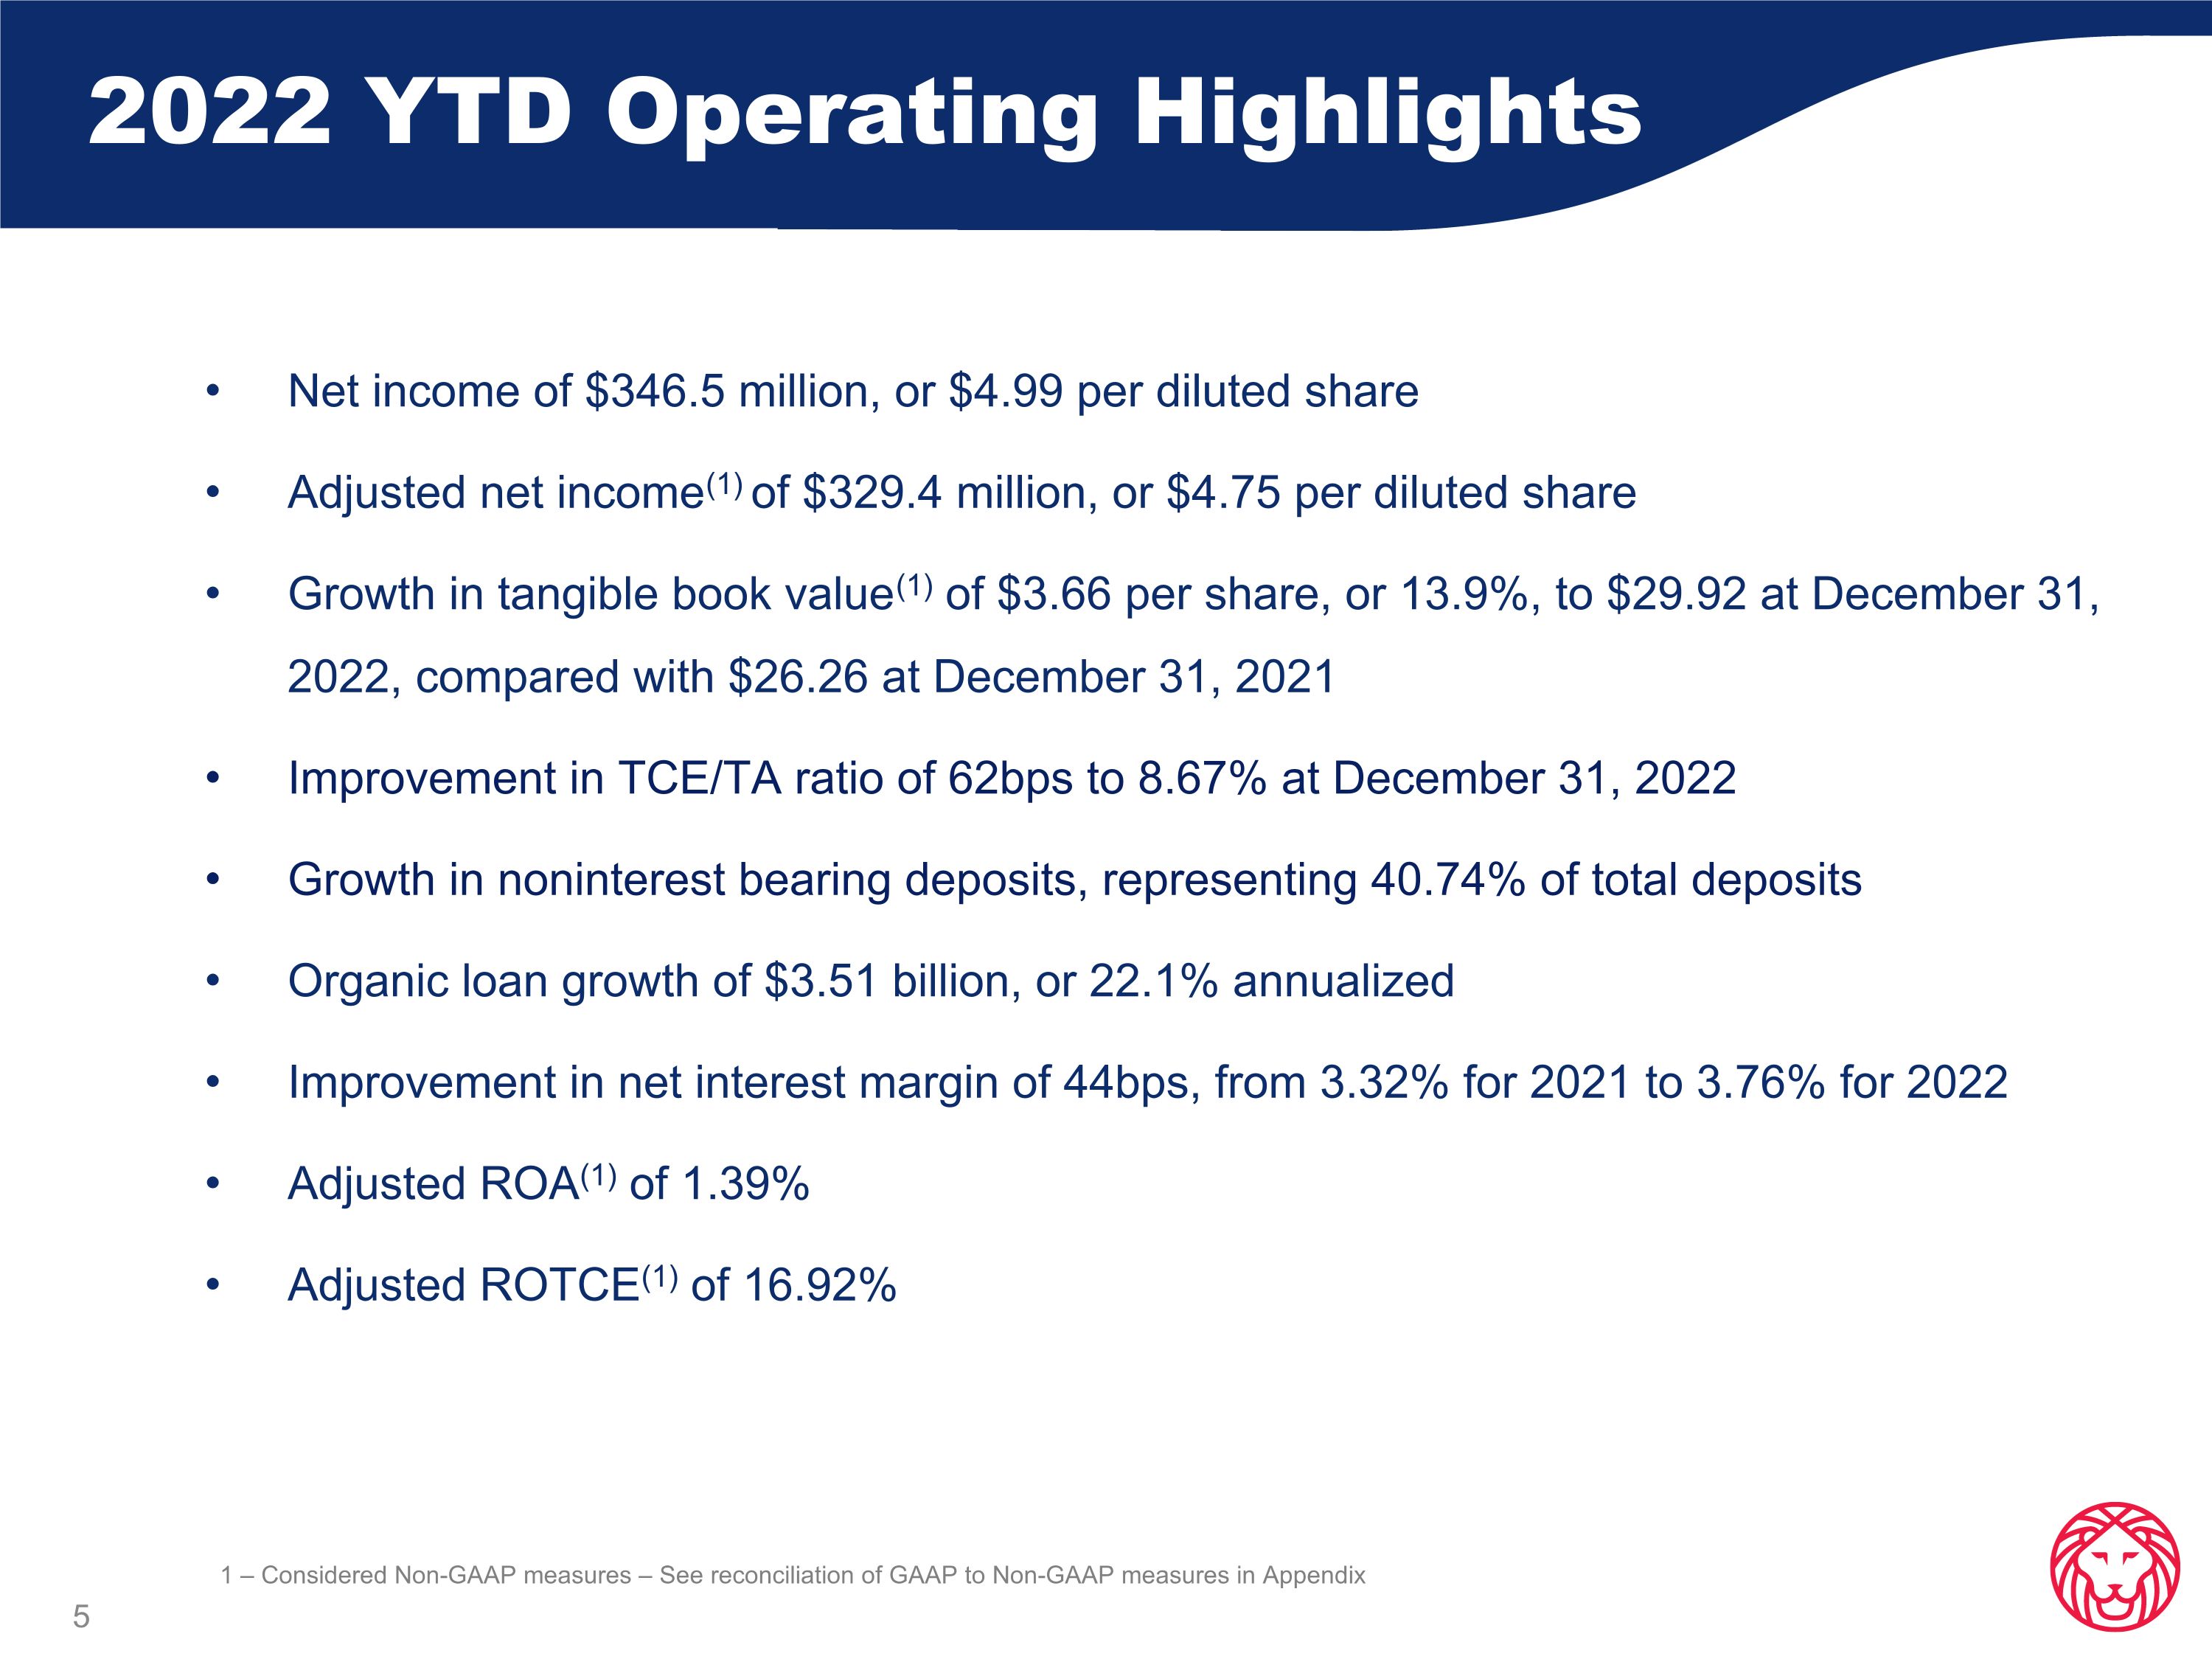
2022 YTD Operating Highlights Net income of $346.5 million, or $4.99 per diluted share Adjusted net income(1) of $329.4 million, or $4.75 per diluted share Growth in tangible book value(1) of $3.66 per share, or 13.9%, to $29.92 at December 31, 2022, compared with $26.26 at December 31, 2021 Improvement in TCE/TA ratio of 62bps to 8.67% at December 31, 2022 Growth in noninterest bearing deposits, representing 40.74% of total deposits Organic loan growth of $3.51 billion, or 22.1% annualized Improvement in net interest margin of 44bps, from 3.32% for 2021 to 3.76% for 2022 Adjusted ROA(1) of 1.39% Adjusted ROTCE(1) of 16.92% 1 – Considered Non-GAAP measures – See reconciliation of GAAP to Non-GAAP measures in Appendix
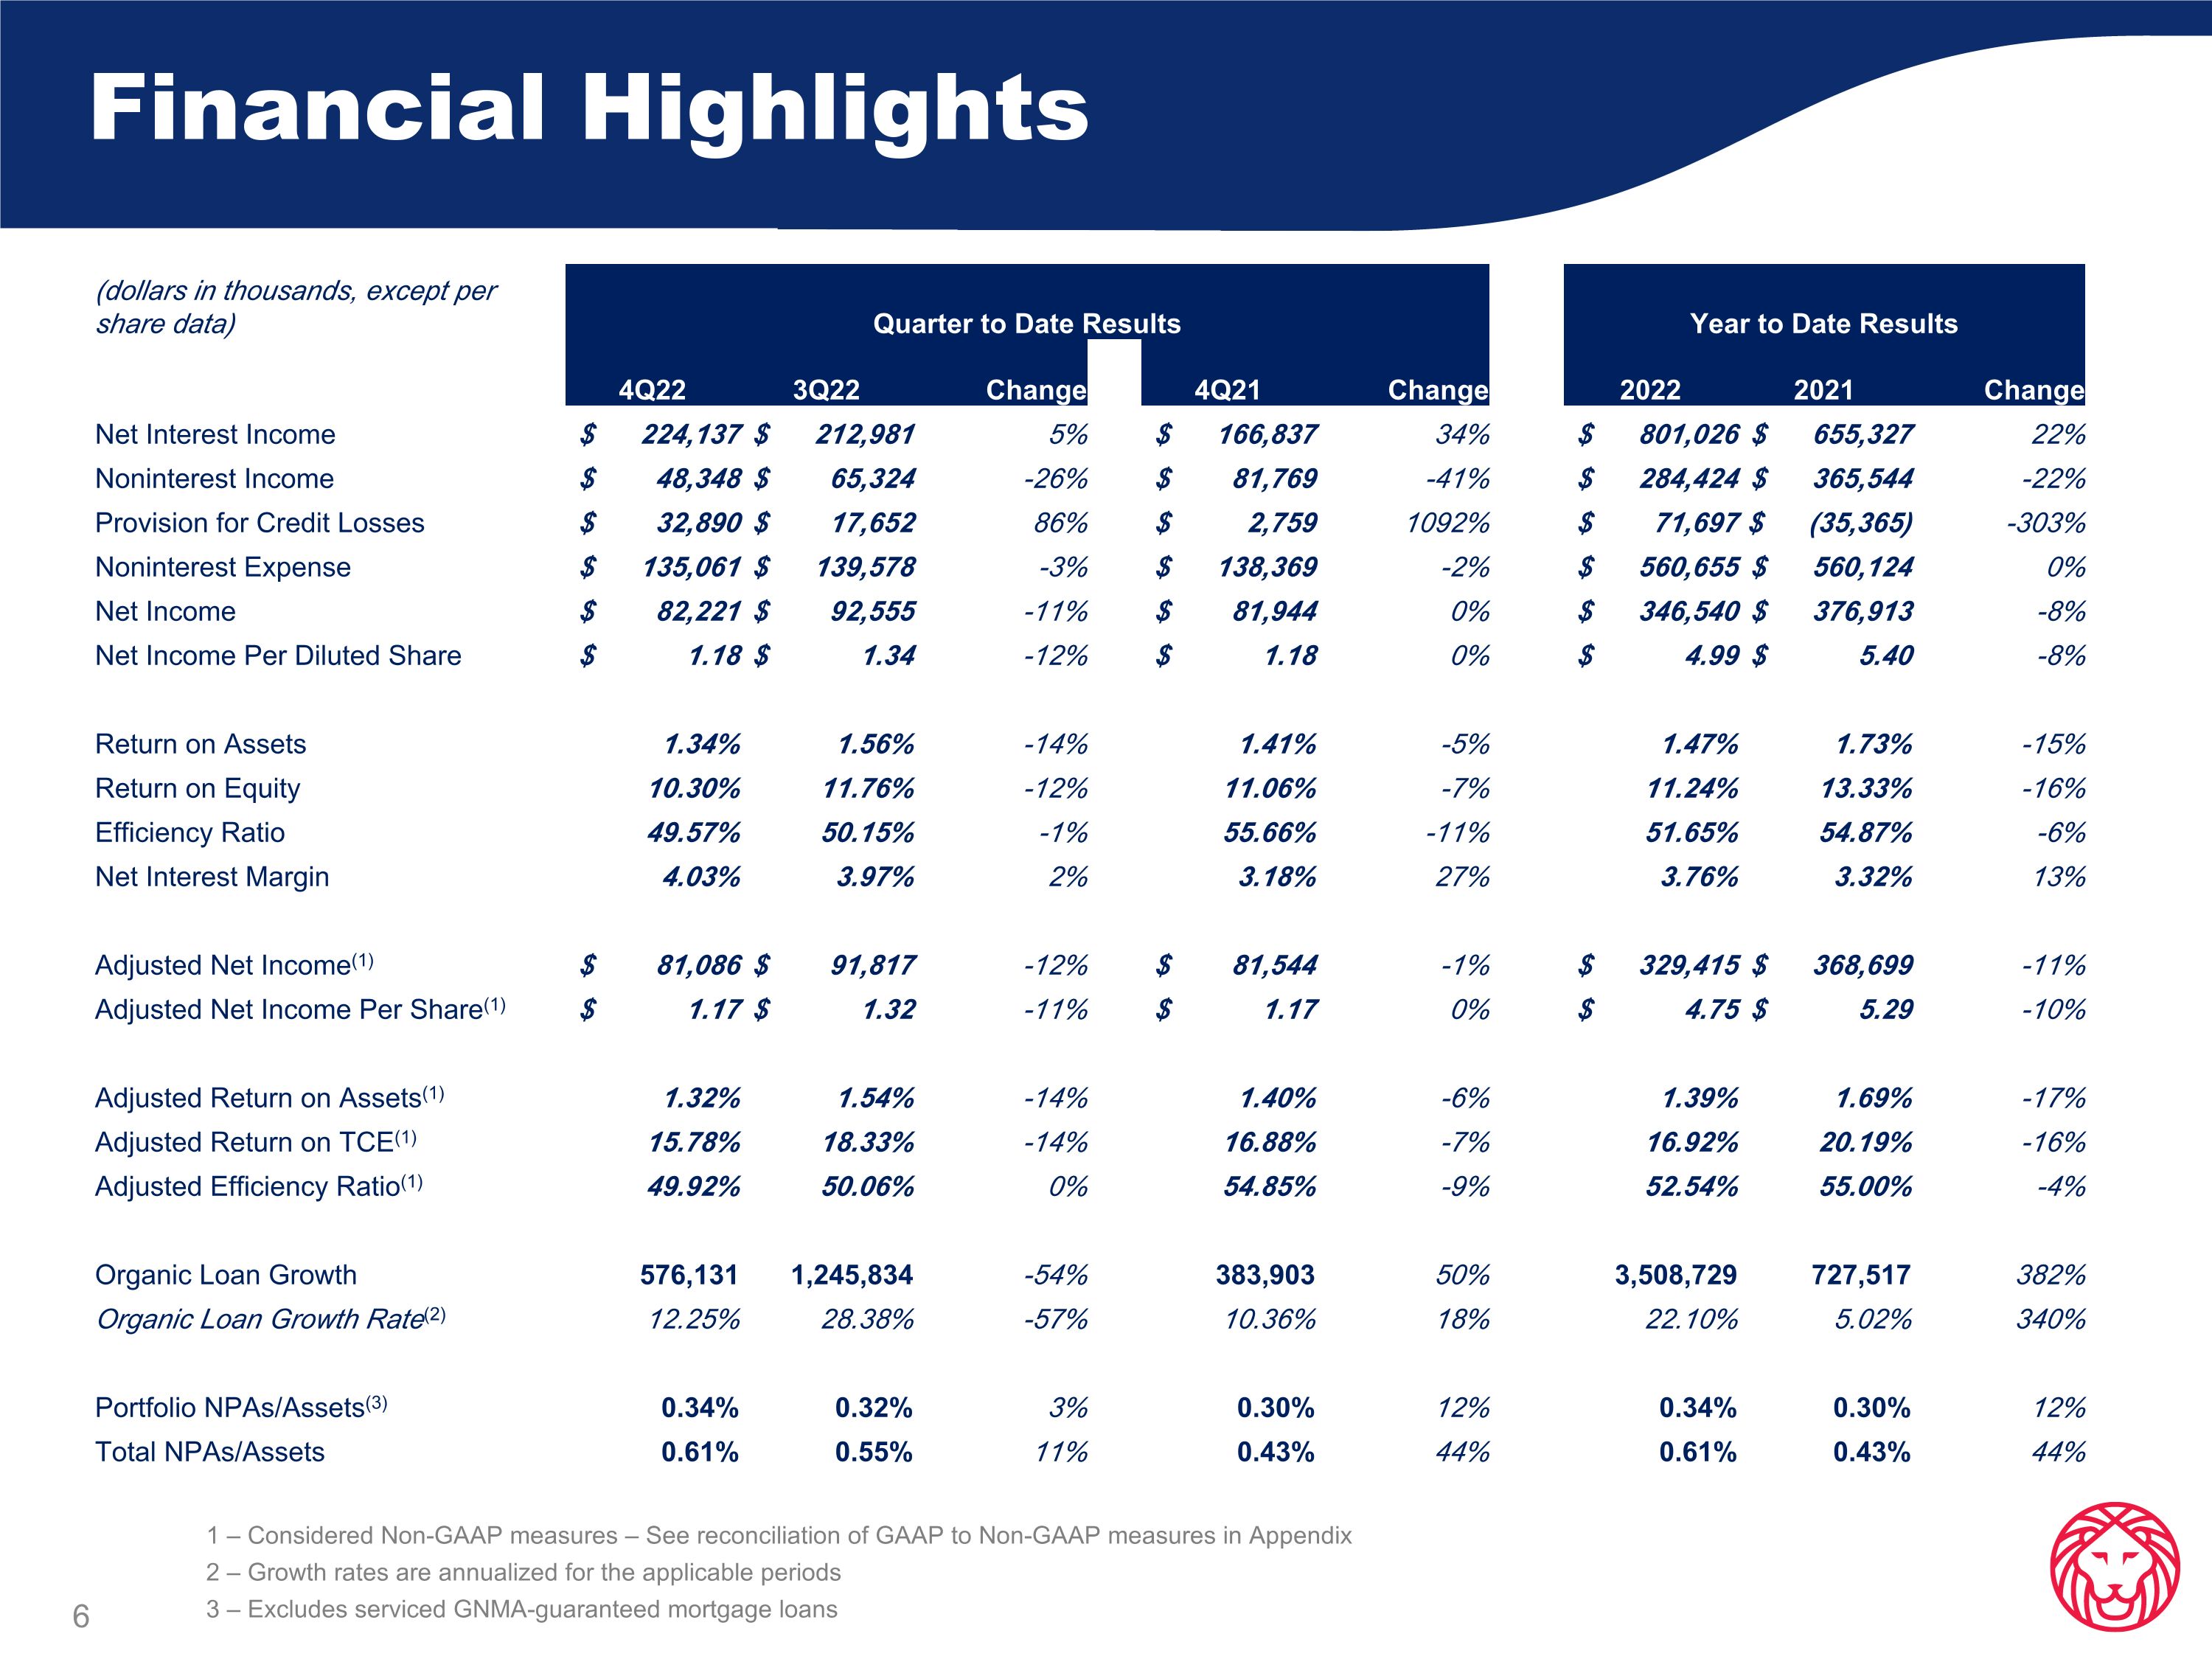
Financial Highlights 1 – Considered Non-GAAP measures – See reconciliation of GAAP to Non-GAAP measures in Appendix 2 – Growth rates are annualized for the applicable periods 3 – Excludes serviced GNMA-guaranteed mortgage loans (dollars in thousands, except per share data) Quarter to Date Results Year to Date Results 4Q22 3Q22 Change 4Q21 Change 2022 2021 Change Net Interest Income $ 224,137 $ 212,981 5% $ 166,837 34% $ 801,026 $ 655,327 22% Noninterest Income $ 48,348 $ 65,324 -26% $ 81,769 -41% $ 284,424 $ 365,544 -22% Provision for Credit Losses $ 32,890 $ 17,652 86% $ 2,759 1092% $ 71,697 $ (35,365) -303% Noninterest Expense $ 135,061 $ 139,578 -3% $ 138,369 -2% $ 560,655 $ 560,124 0% Net Income $ 82,221 $ 92,555 -11% $ 81,944 0% $ 346,540 $ 376,913 -8% Net Income Per Diluted Share $ 1.18 $ 1.34 -12% $ 1.18 0% $ 4.99 $ 5.40 -8% Return on Assets 1.34% 1.56% -14% 1.41% -5% 1.47% 1.73% -15% Return on Equity 10.30% 11.76% -12% 11.06% -7% 11.24% 13.33% -16% Efficiency Ratio 49.57% 50.15% -1% 55.66% -11% 51.65% 54.87% -6% Net Interest Margin 4.03% 3.97% 2% 3.18% 27% 3.76% 3.32% 13% Adjusted Net Income(1) $ 81,086 $ 91,817 -12% $ 81,544 -1% $ 329,415 $ 368,699 -11% Adjusted Net Income Per Share(1) $ 1.17 $ 1.32 -11% $ 1.17 0% $ 4.75 $ 5.29 -10% Adjusted Return on Assets(1) 1.32% 1.54% -14% 1.40% -6% 1.39% 1.69% -17% Adjusted Return on TCE(1) 15.78% 18.33% -14% 16.88% -7% 16.92% 20.19% -16% Adjusted Efficiency Ratio(1) 49.92% 50.06% 0% 54.85% -9% 52.54% 55.00% -4% Organic Loan Growth 576,131 1,245,834 -54% 383,903 50% 3,508,729 727,517 382% Organic Loan Growth Rate(2) 12.25% 28.38% -57% 10.36% 18% 22.10% 5.02% 340% Portfolio NPAs/Assets(3) 0.34% 0.32% 3% 0.30% 12% 0.34% 0.30% 12% Total NPAs/Assets 0.61% 0.55% 11% 0.43% 44% 0.61% 0.43% 44%
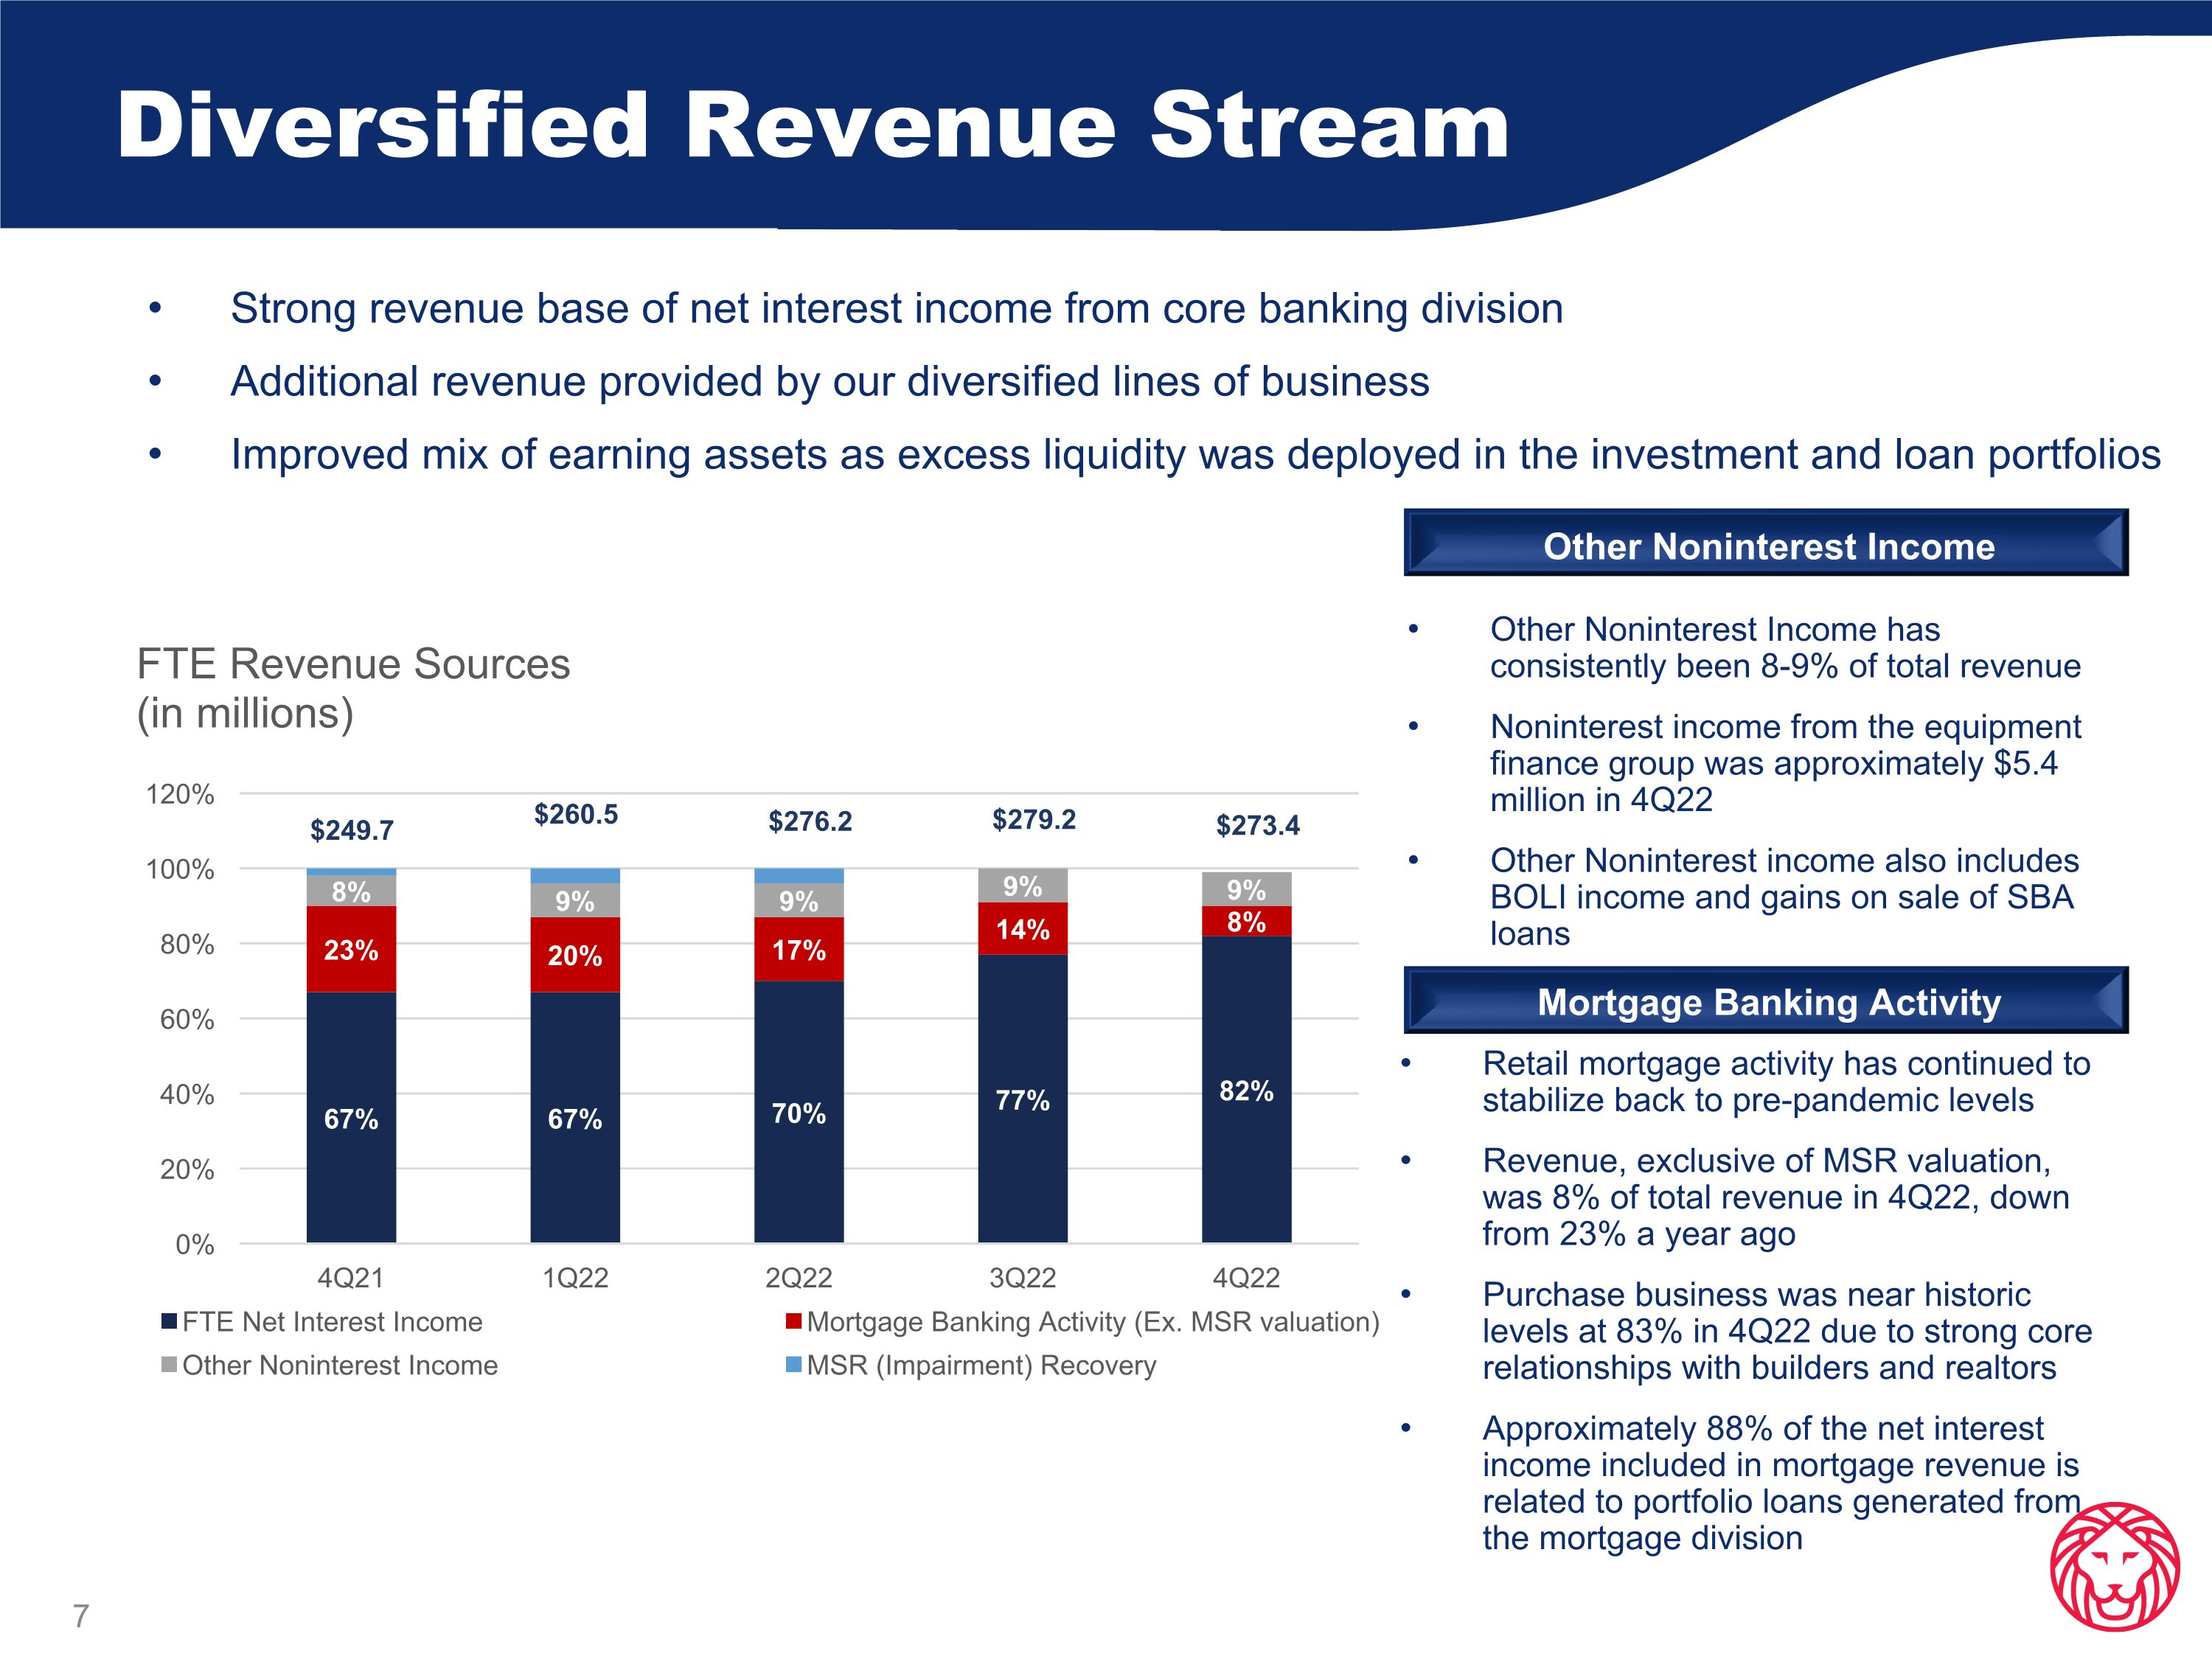
Diversified Revenue Stream Strong revenue base of net interest income from core banking division Additional revenue provided by our diversified lines of business Improved mix of earning assets as excess liquidity was deployed in the investment and loan portfolios Mortgage Banking Activity Retail mortgage activity has continued to stabilize back to pre-pandemic levels Revenue, exclusive of MSR valuation, was 8% of total revenue in 4Q22, down from 23% a year ago Purchase business was near historic levels at 83% in 4Q22 due to strong core relationships with builders and realtors Approximately 88% of the net interest income included in mortgage revenue is related to portfolio loans generated from the mortgage division Other Noninterest Income Other Noninterest Income has consistently been 8-9% of total revenue Noninterest income from the equipment finance group was approximately $5.4 million in 4Q22 Other Noninterest income also includes BOLI income and gains on sale of SBA loans
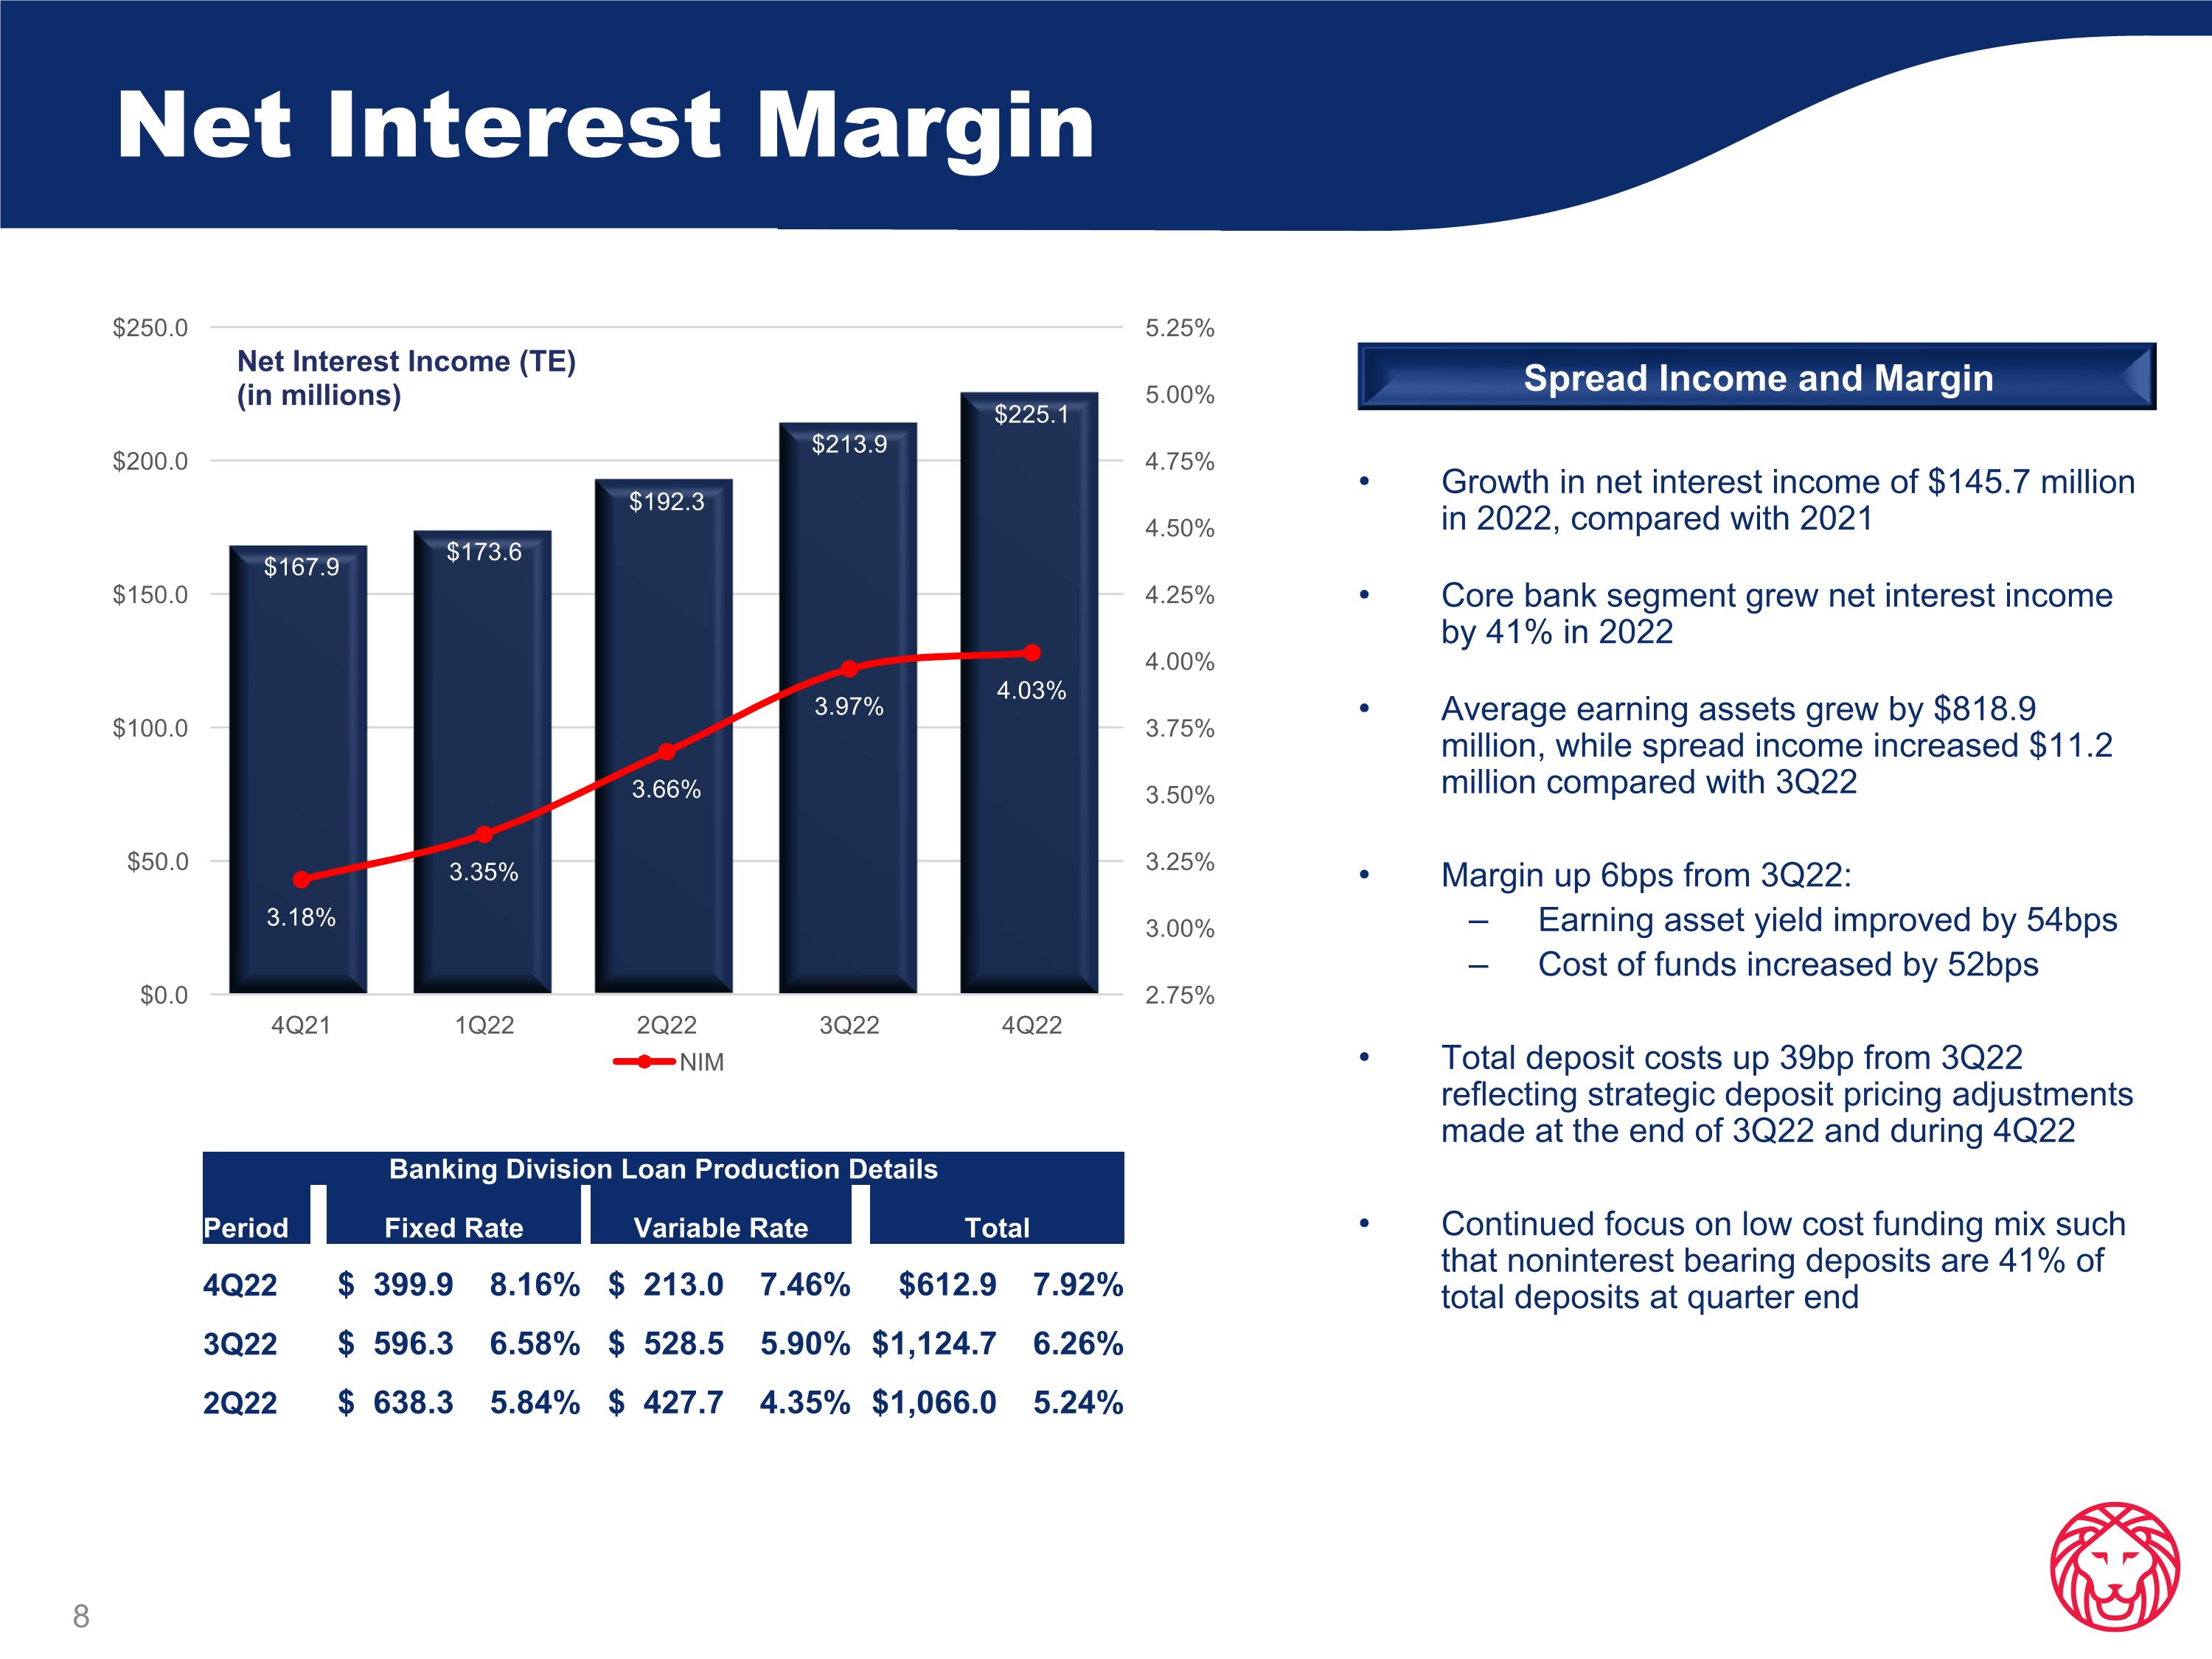
Net Interest Margin Banking Division Loan Production Details Period Fixed Rate Variable Rate Total 4Q22 $ 399.9 8.16% $ 213.0 7.46% $612.9 7.92% 3Q22 $ 596.3 6.58% $ 528.5 5.90% $1,124.7 6.26% 2Q22 $ 638.3 5.84% $ 427.7 4.35% $1,066.0 5.24% Growth in net interest income of $145.7 million in 2022, compared with 2021 Core bank segment grew net interest income by 41% in 2022 Average earning assets grew by $818.9 million, while spread income increased $11.2 million compared with 3Q22 Margin up 6bps from 3Q22: Earning asset yield improved by 54bps Cost of funds increased by 52bps Total deposit costs up 39bp from 3Q22 reflecting strategic deposit pricing adjustments made at the end of 3Q22 and during 4Q22 Continued focus on low cost funding mix such that noninterest bearing deposits are 41% of total deposits at quarter end Spread Income and Margin
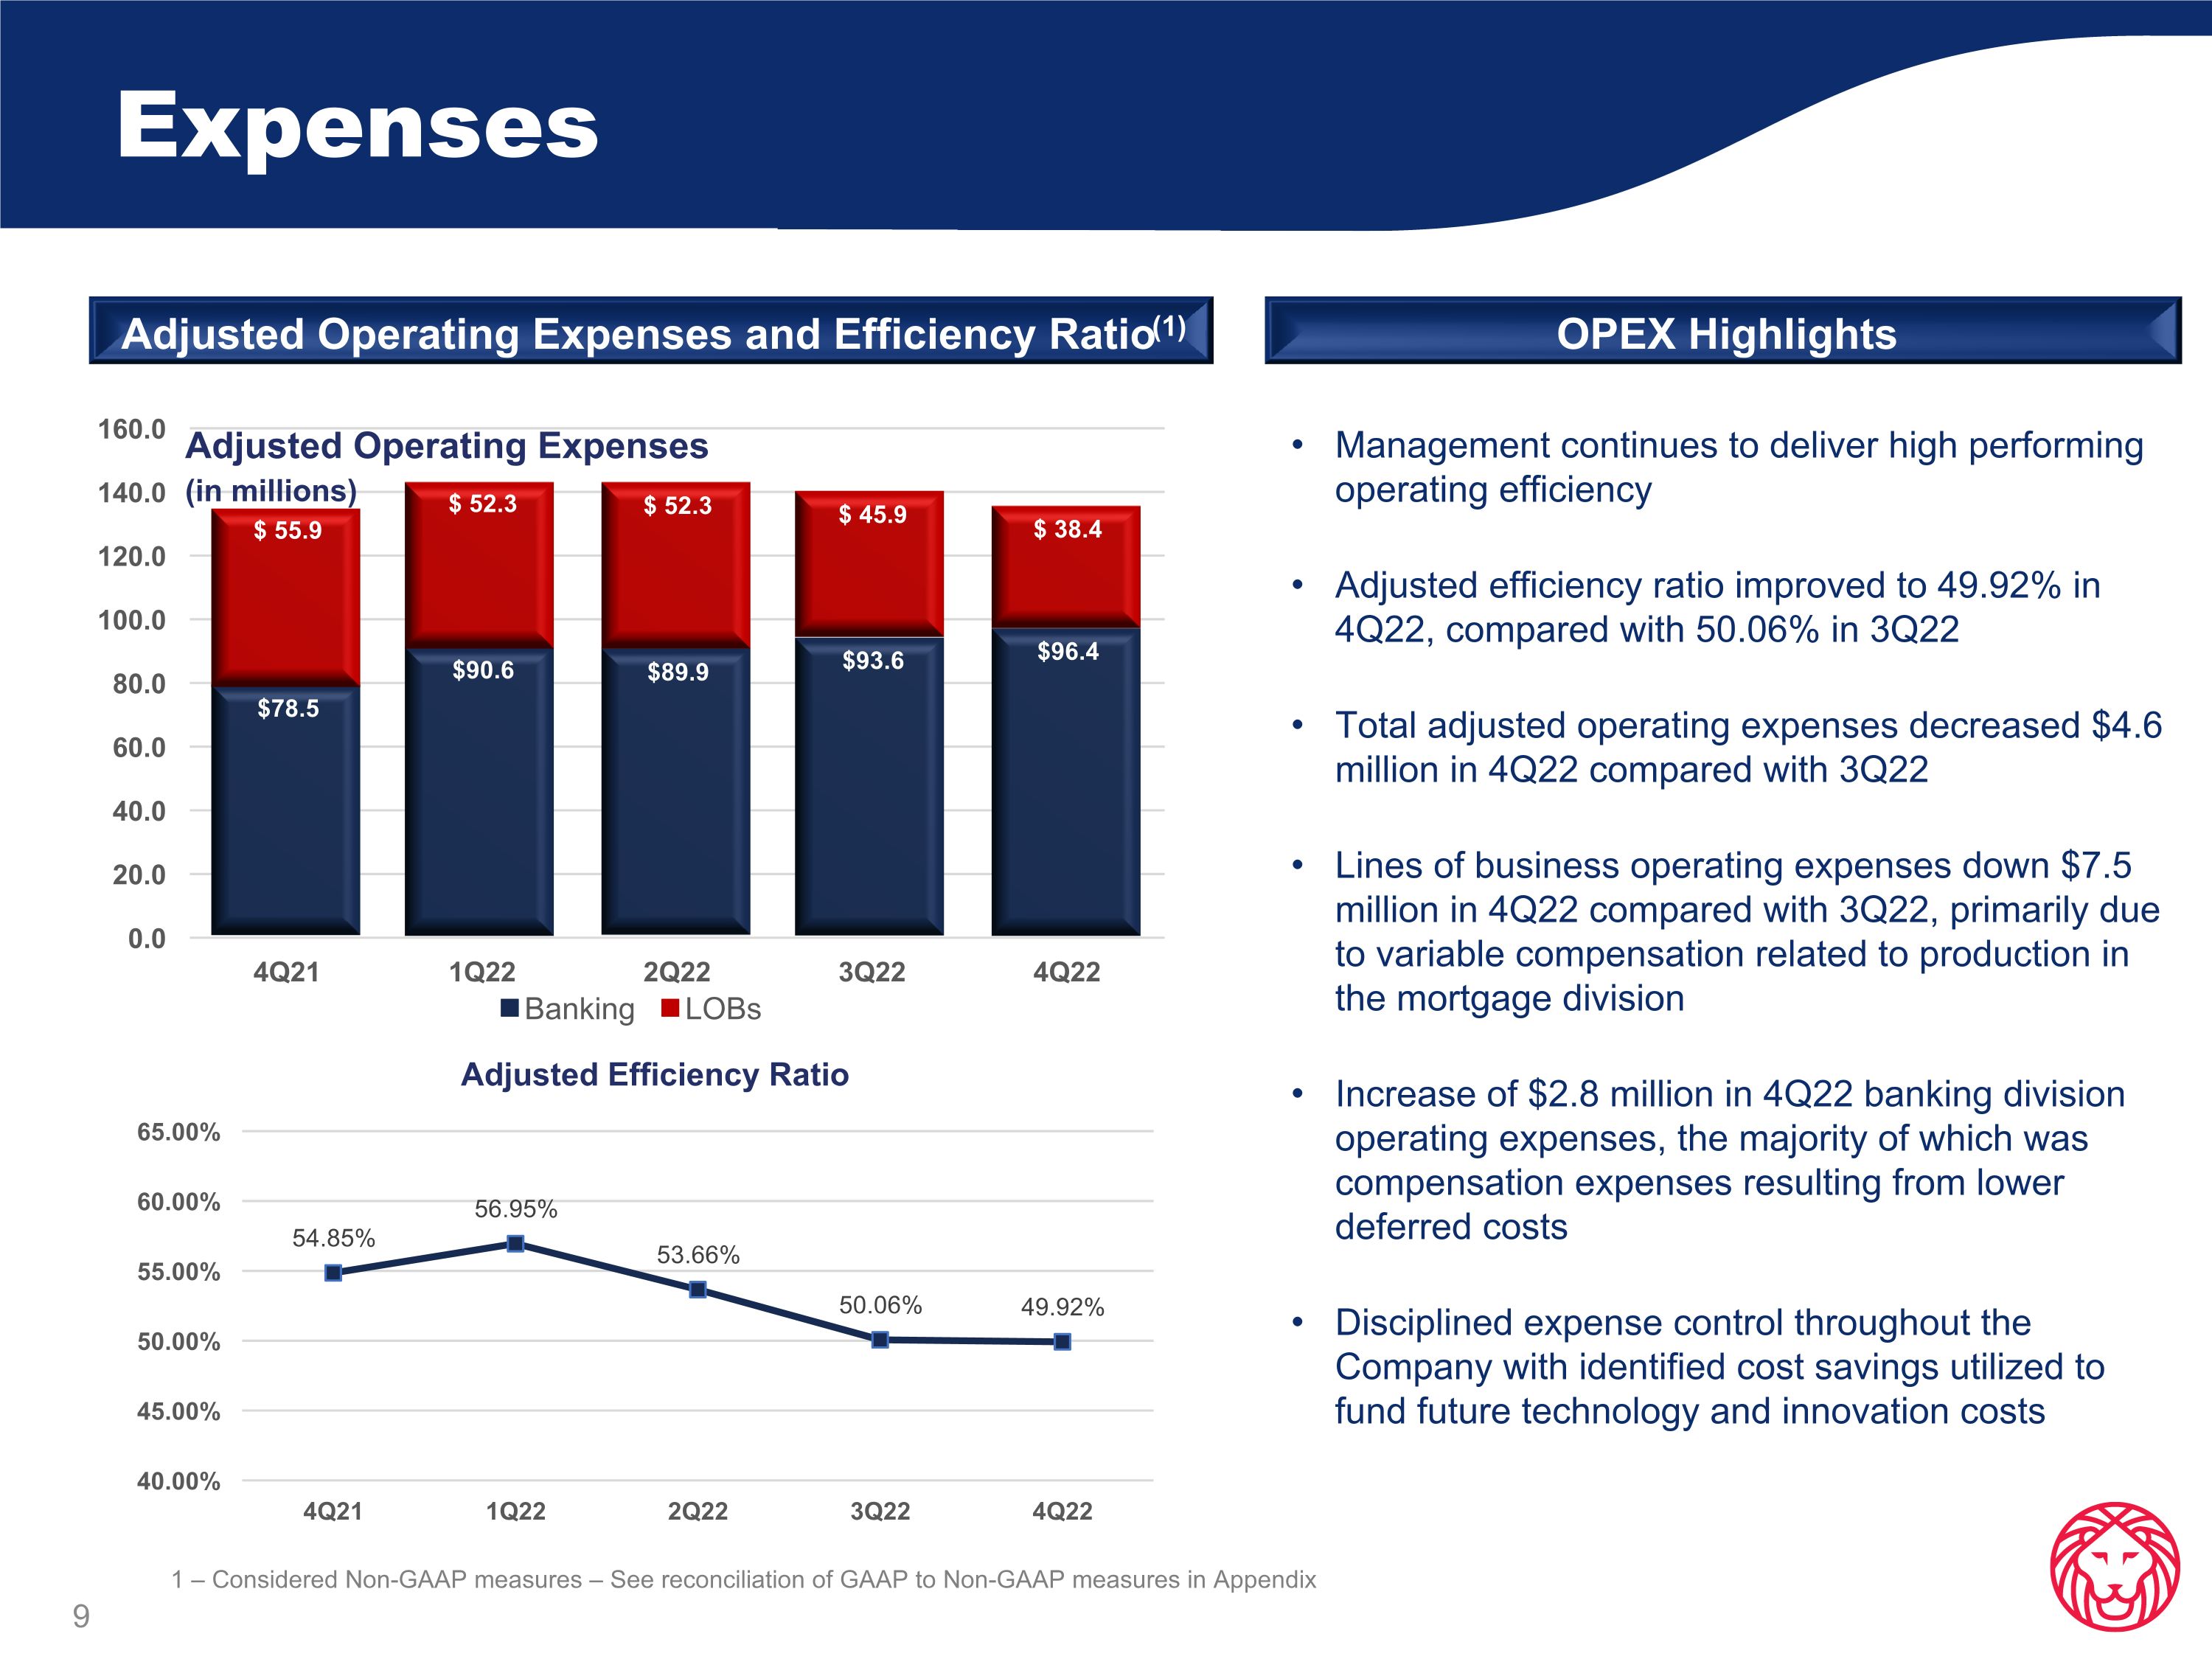
Expenses Adjusted Operating Expenses and Efficiency Ratio(1) OPEX Highlights Management continues to deliver high performing operating efficiency Adjusted efficiency ratio improved to 49.92% in 4Q22, compared with 50.06% in 3Q22 Total adjusted operating expenses decreased $4.6 million in 4Q22 compared with 3Q22 Lines of business operating expenses down $7.5 million in 4Q22 compared with 3Q22, primarily due to variable compensation related to production in the mortgage division Increase of $2.8 million in 4Q22 banking division operating expenses, the majority of which was compensation expenses resulting from lower deferred costs Disciplined expense control throughout the Company with identified cost savings utilized to fund future technology and innovation costs 1 – Considered Non-GAAP measures – See reconciliation of GAAP to Non-GAAP measures in Appendix
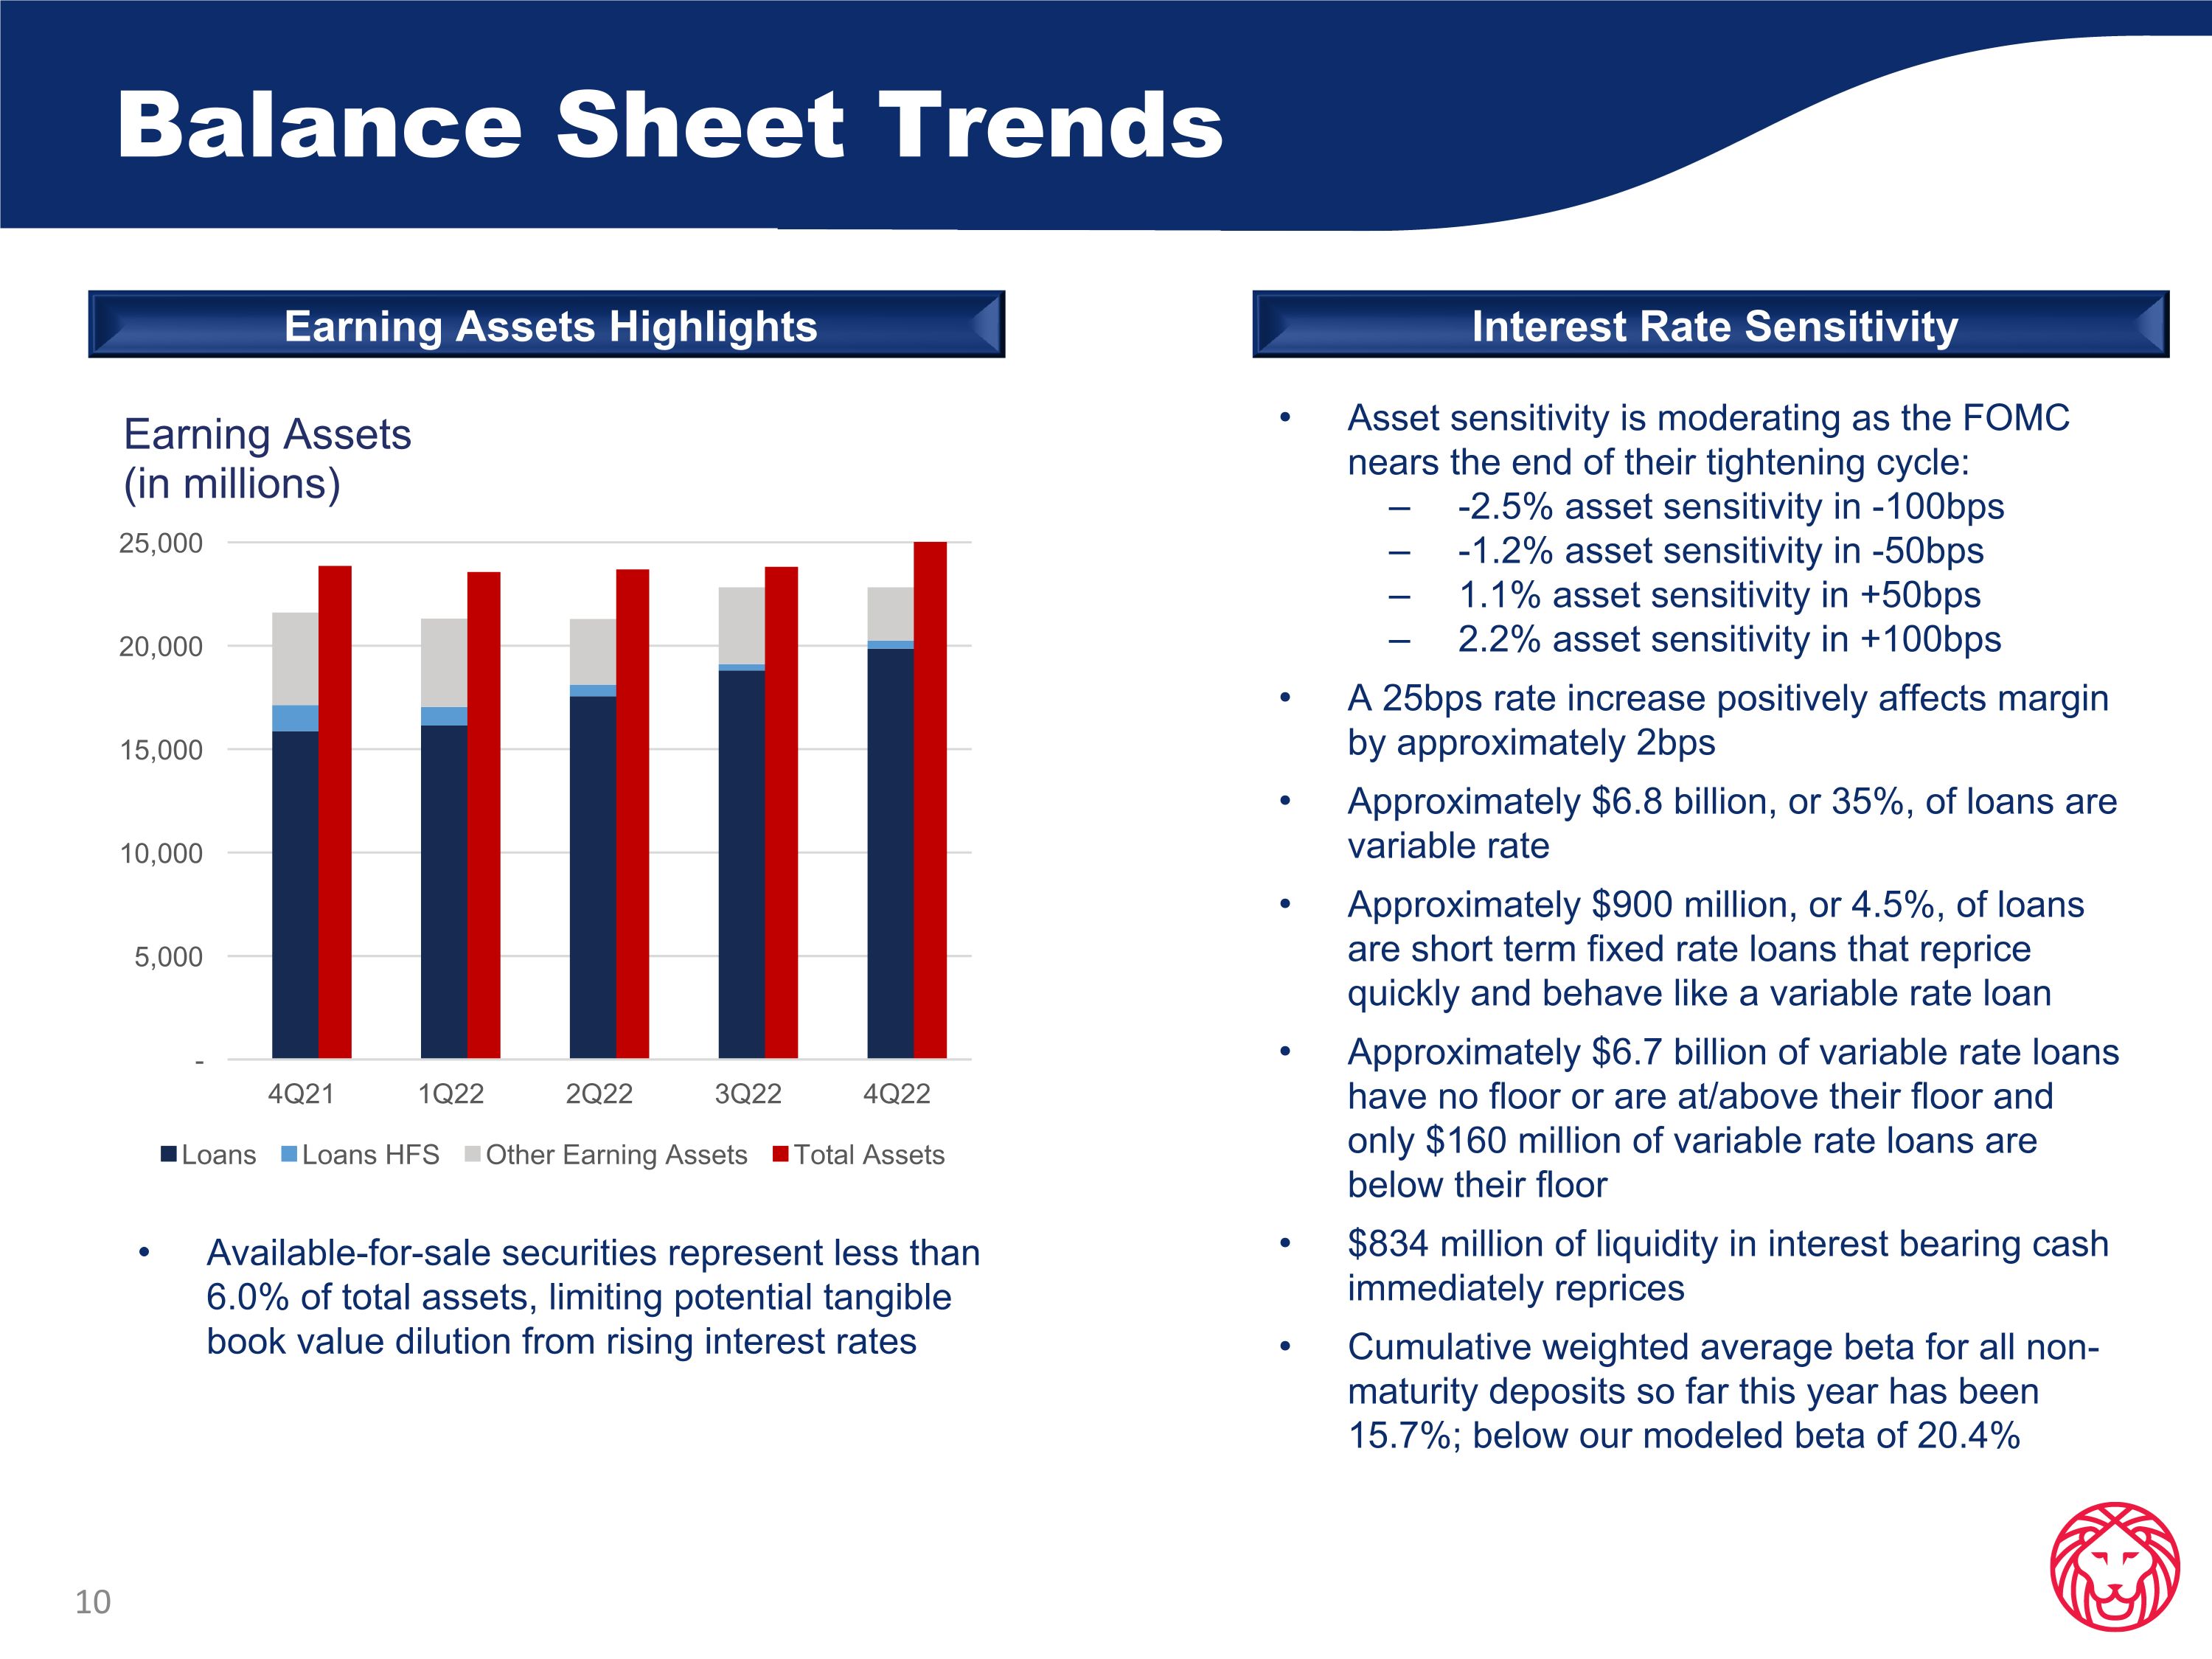
Balance Sheet Trends Asset sensitivity is moderating as the FOMC nears the end of their tightening cycle: -2.5% asset sensitivity in -100bps -1.2% asset sensitivity in -50bps 1.1% asset sensitivity in +50bps 2.2% asset sensitivity in +100bps A 25bps rate increase positively affects margin by approximately 2bps Approximately $6.8 billion, or 35%, of loans are variable rate Approximately $900 million, or 4.5%, of loans are short term fixed rate loans that reprice quickly and behave like a variable rate loan Approximately $6.7 billion of variable rate loans have no floor or are at/above their floor and only $160 million of variable rate loans are below their floor $834 million of liquidity in interest bearing cash immediately reprices Cumulative weighted average beta for all non-maturity deposits so far this year has been 15.7%; below our modeled beta of 20.4% Interest Rate Sensitivity Earning Assets Highlights Available-for-sale securities represent less than 6.0% of total assets, limiting potential tangible book value dilution from rising interest rates
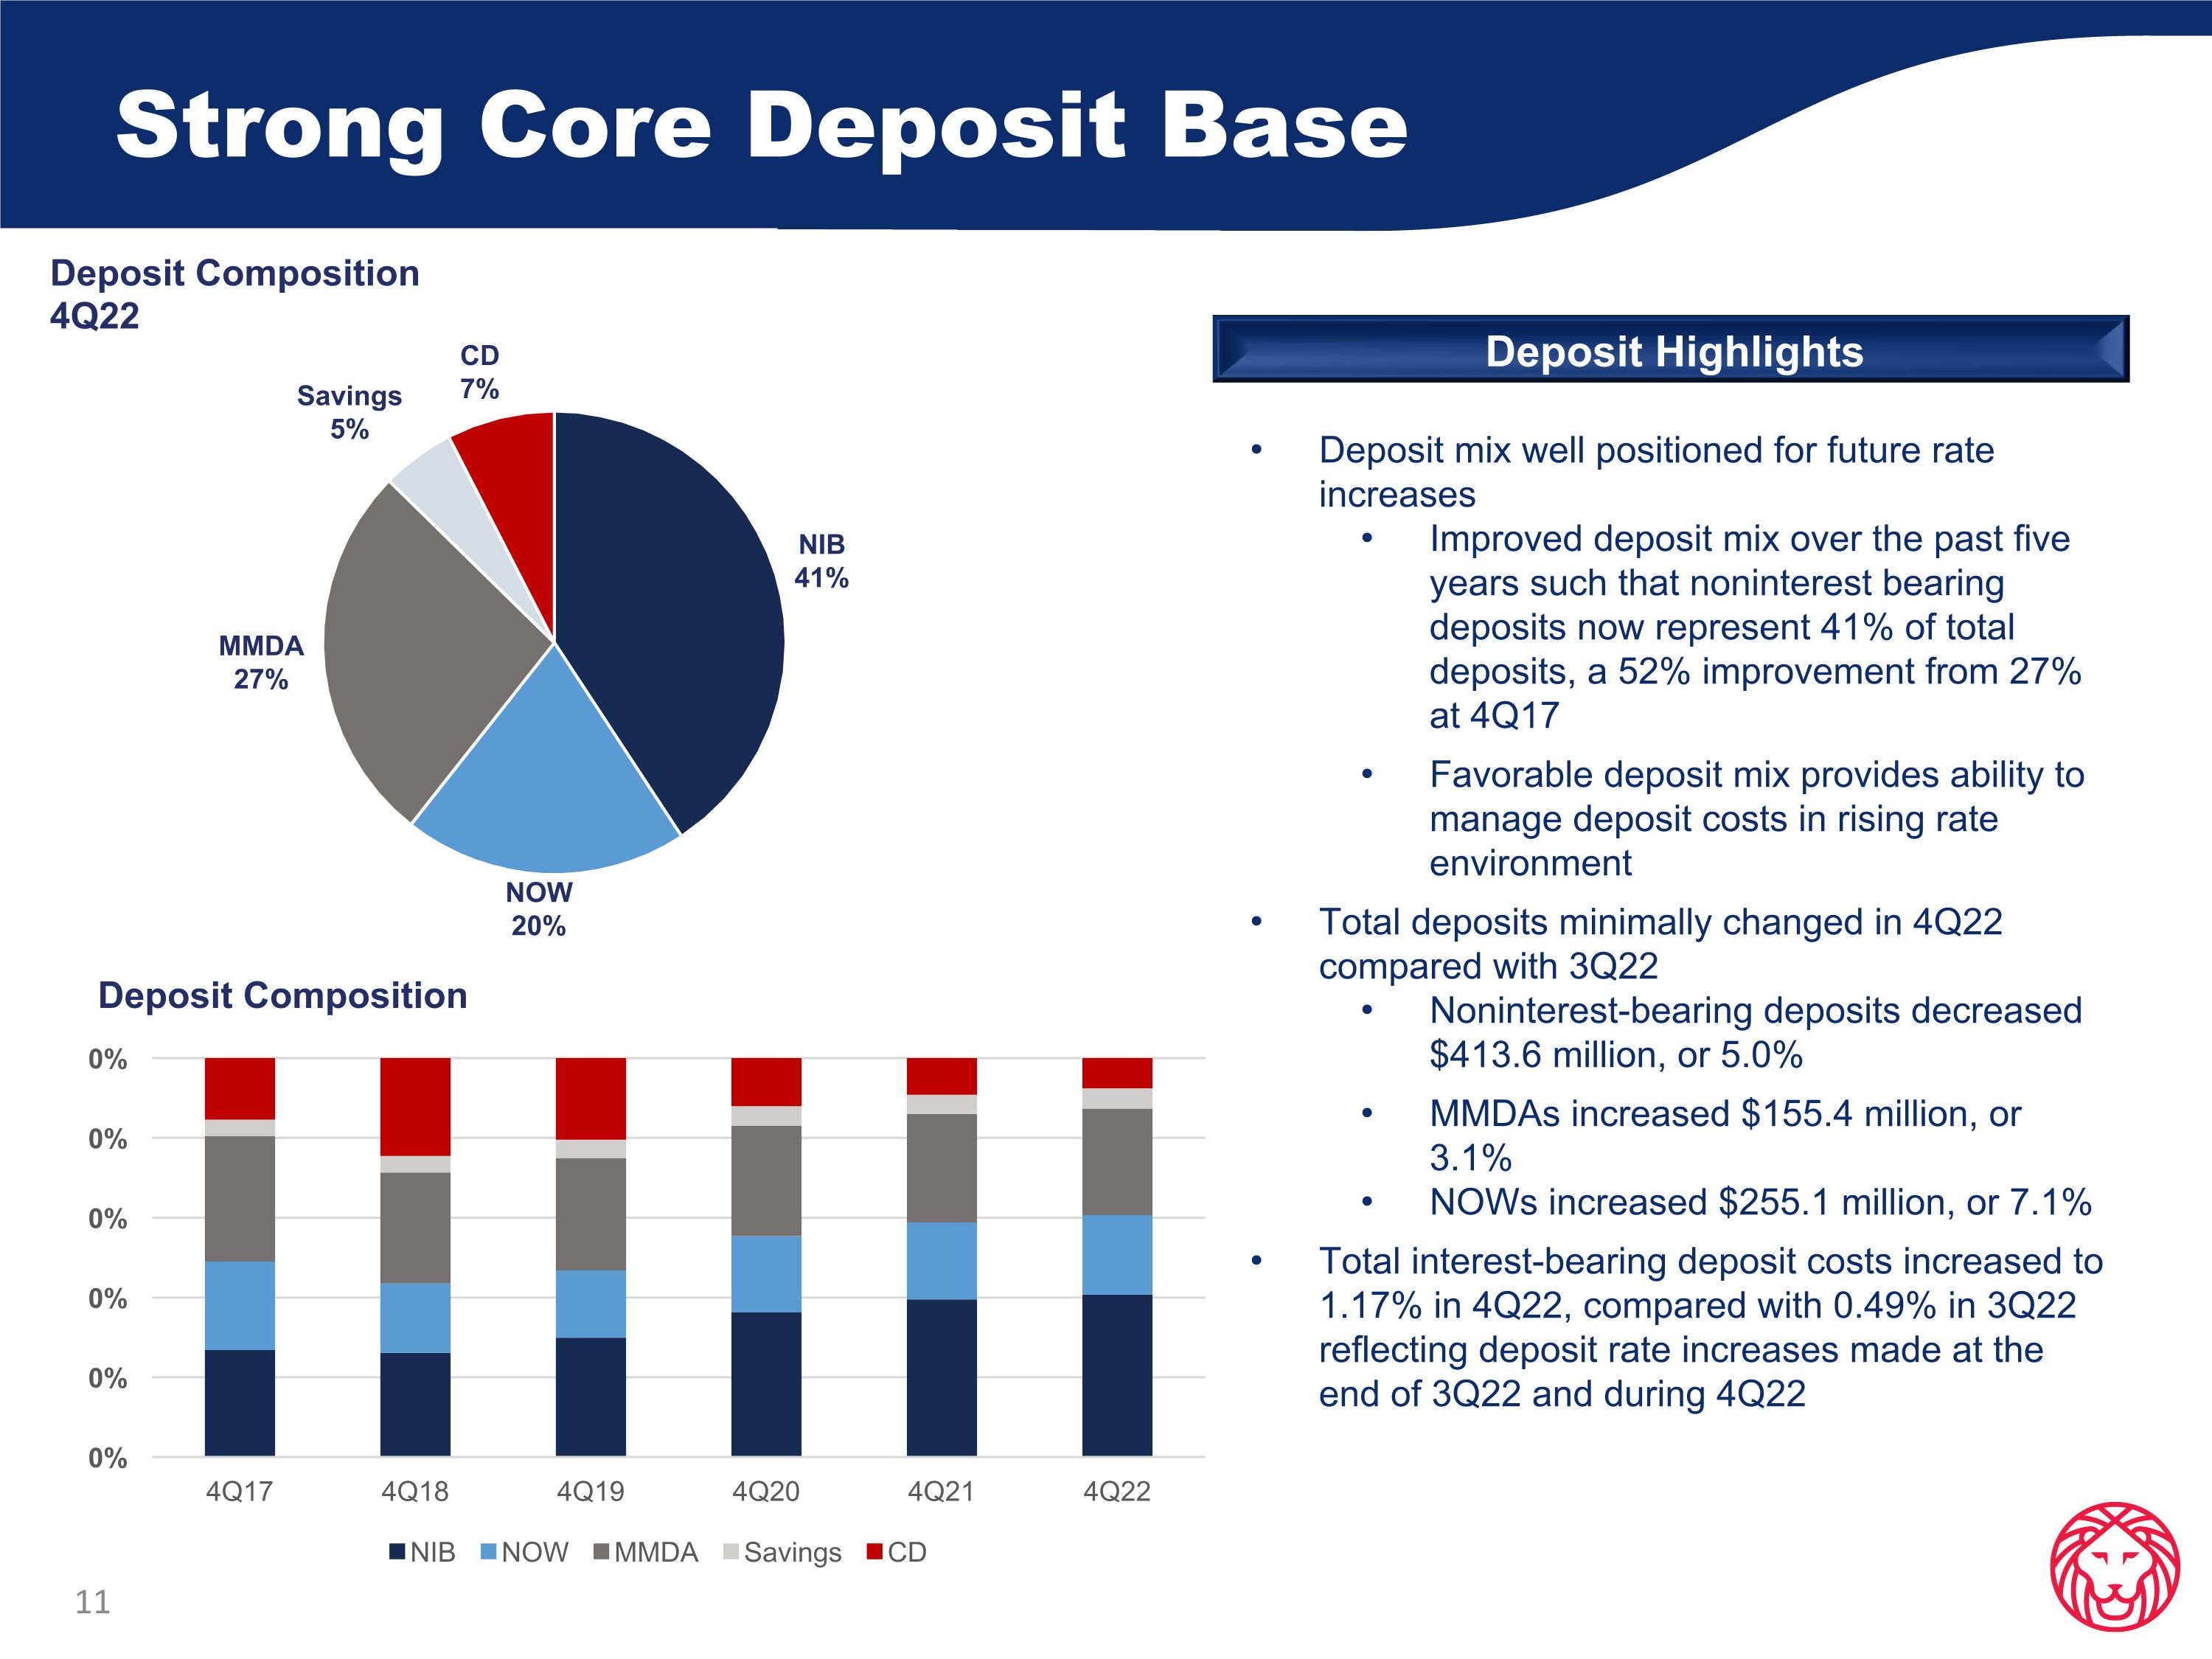
Strong Core Deposit Base Deposit Highlights Deposit mix well positioned for future rate increases Improved deposit mix over the past five years such that noninterest bearing deposits now represent 41% of total deposits, a 52% improvement from 27% at 4Q17 Favorable deposit mix provides ability to manage deposit costs in rising rate environment Total deposits minimally changed in 4Q22 compared with 3Q22 Noninterest-bearing deposits decreased $413.6 million, or 5.0% MMDAs increased $155.4 million, or 3.1% NOWs increased $255.1 million, or 7.1% Total interest-bearing deposit costs increased to 1.17% in 4Q22, compared with 0.49% in 3Q22 reflecting deposit rate increases made at the end of 3Q22 and during 4Q22
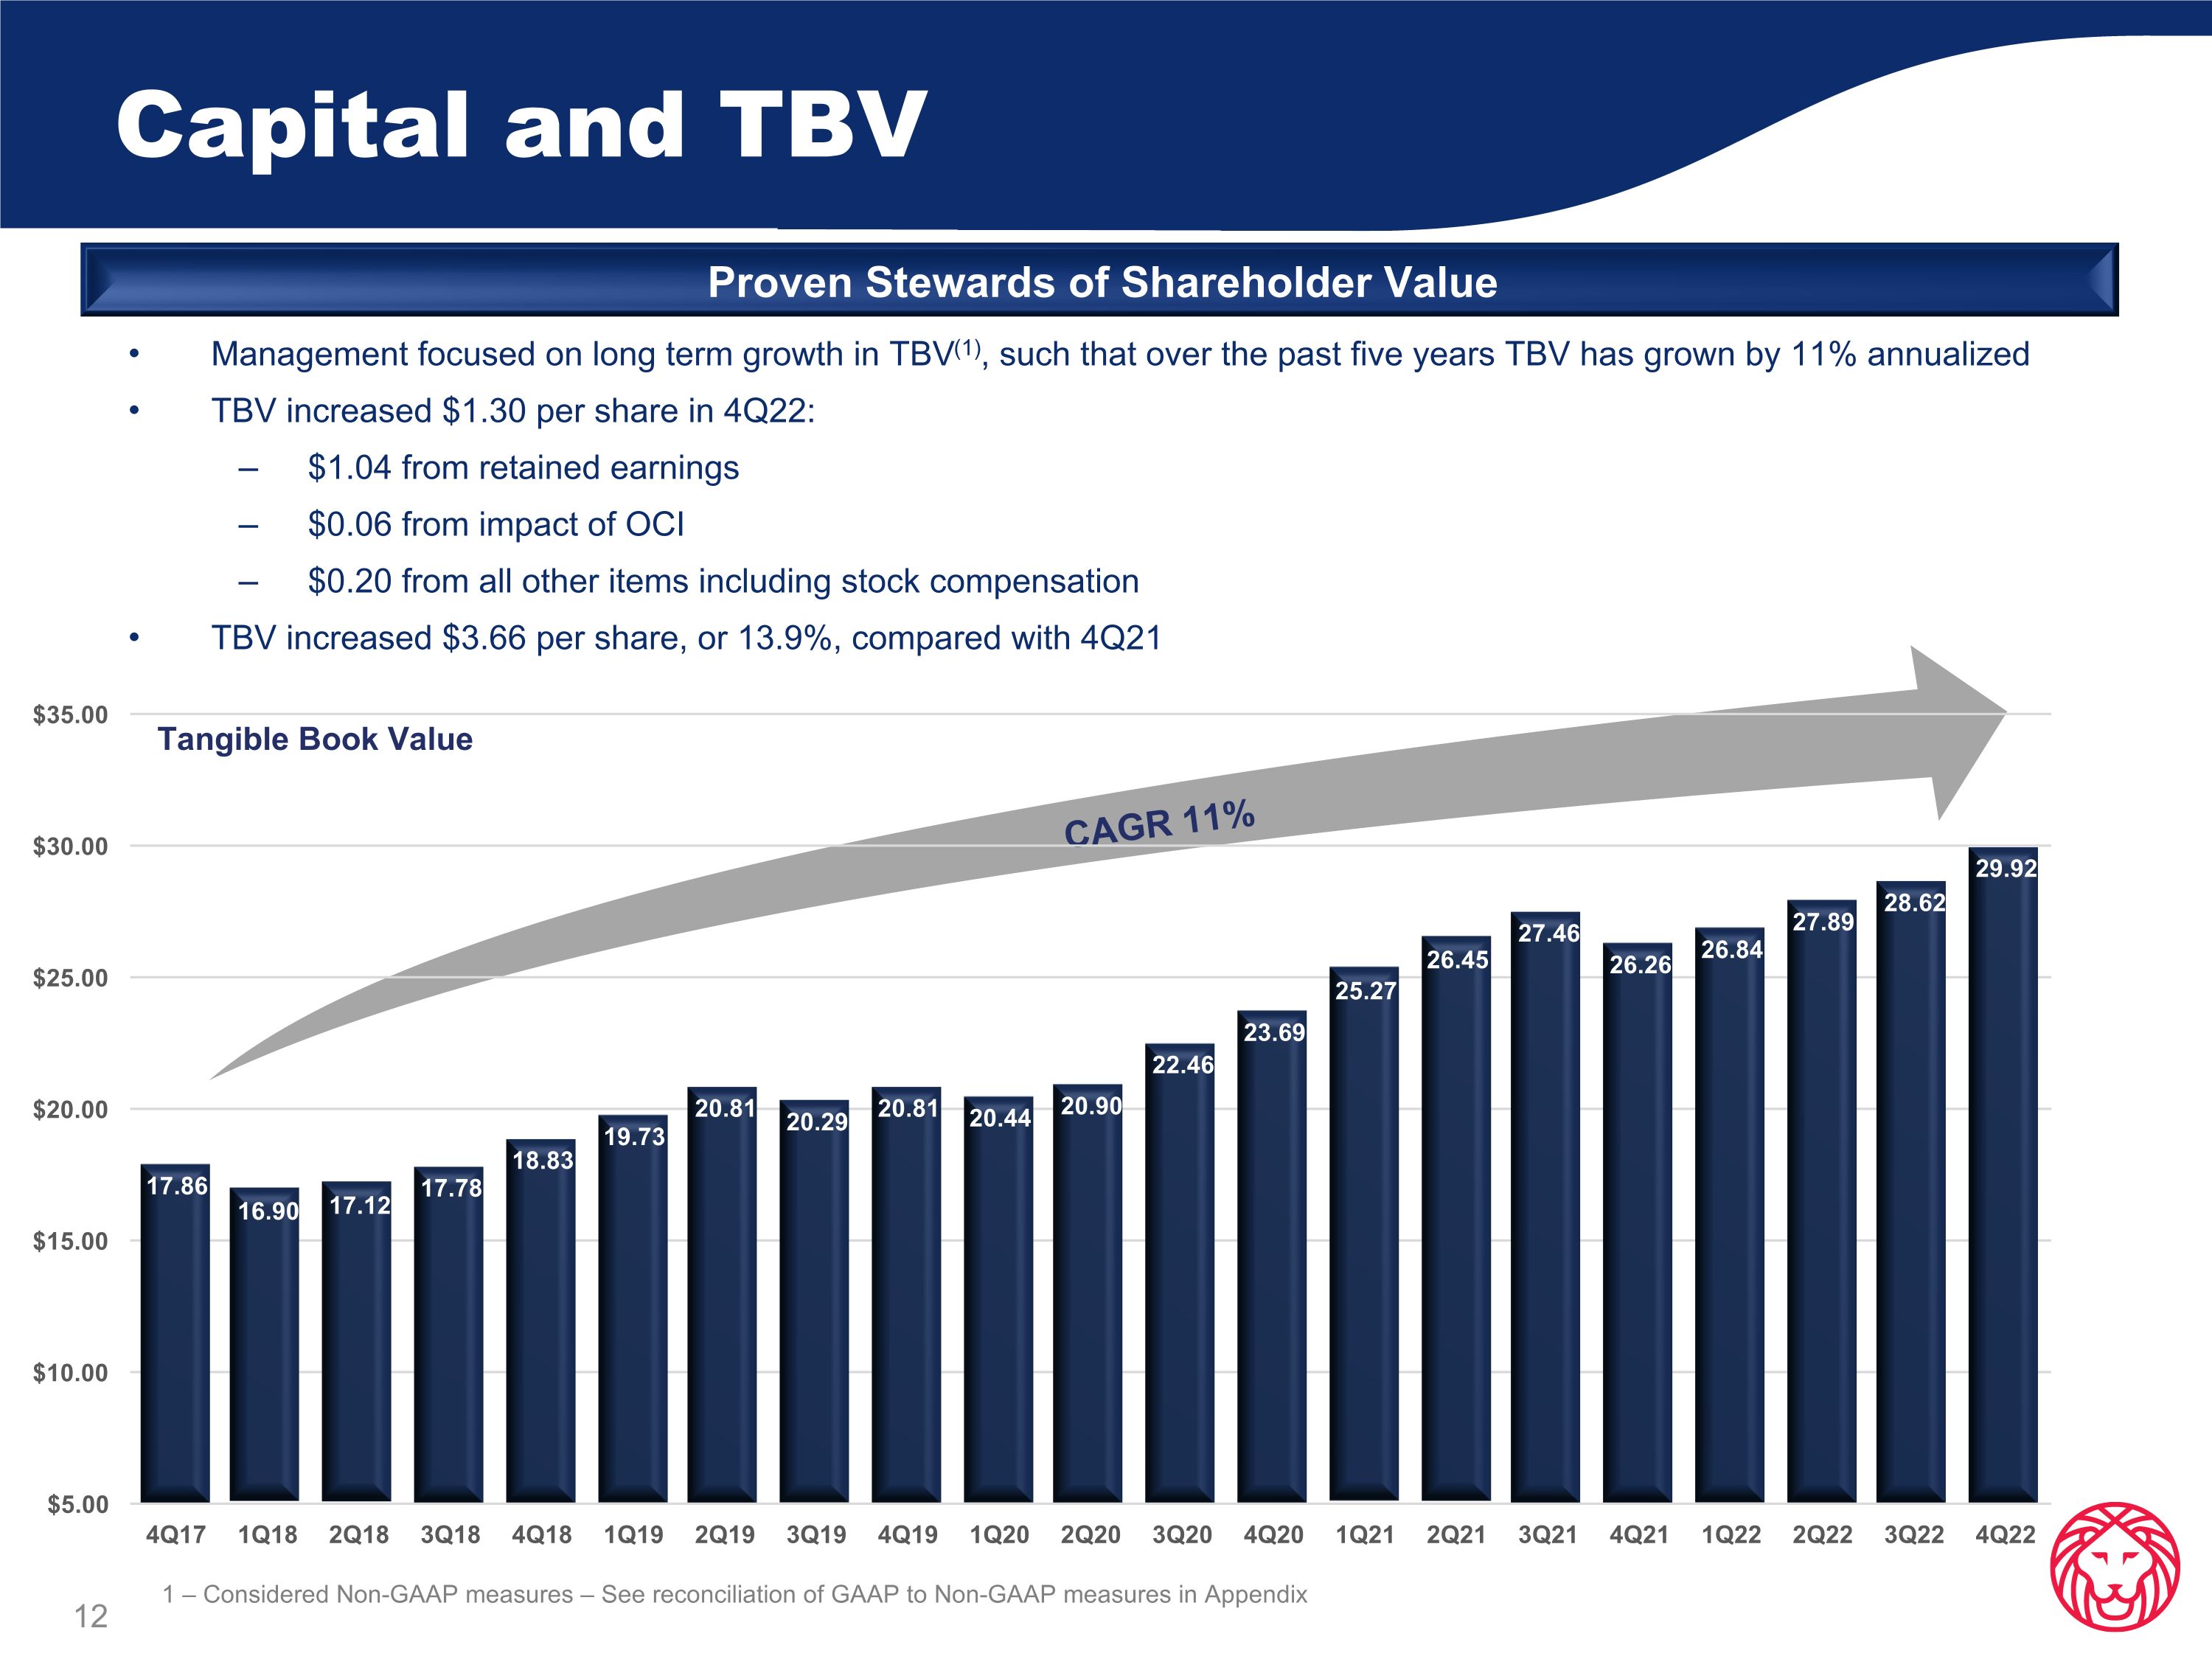
Capital and TBV Proven Stewards of Shareholder Value Management focused on long term growth in TBV(1), such that over the past five years TBV has grown by 11% annualized TBV increased $1.30 per share in 4Q22: $1.04 from retained earnings $0.06 from impact of OCI $0.20 from all other items including stock compensation TBV increased $3.66 per share, or 13.9%, compared with 4Q21 1 – Considered Non-GAAP measures – See reconciliation of GAAP to Non-GAAP measures in Appendix CAGR 11%
Loan Diversification and Credit Quality
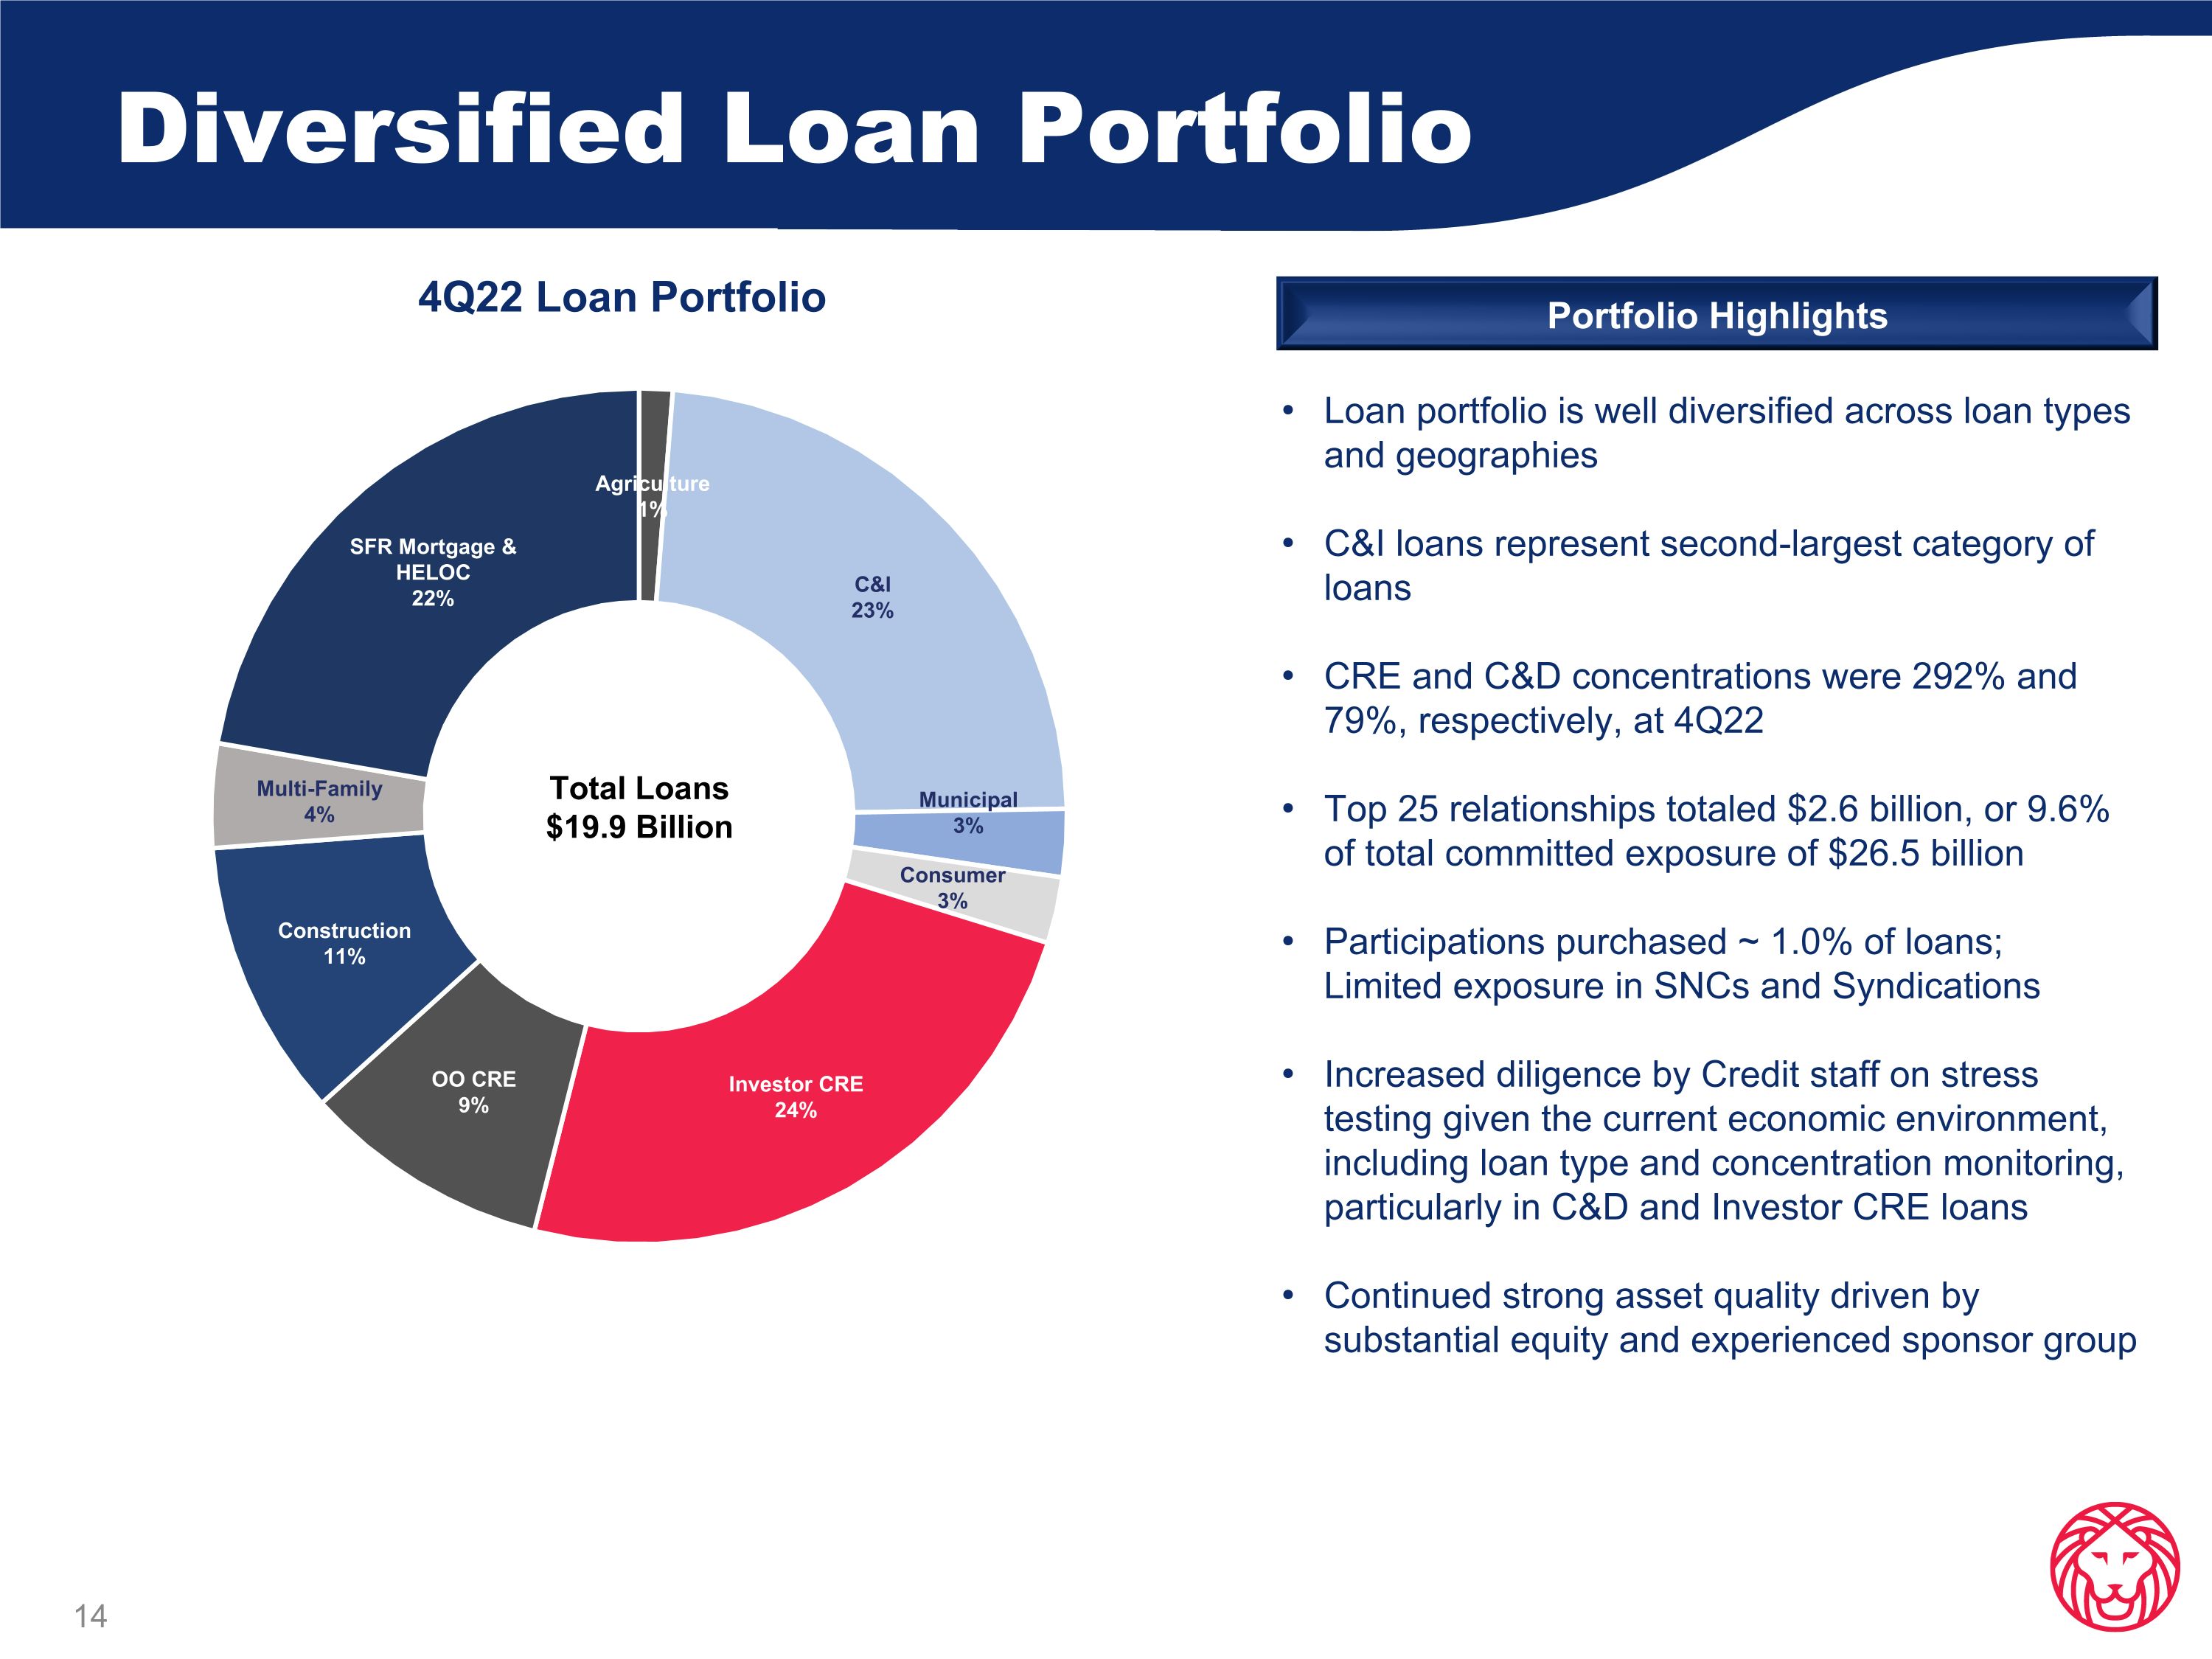
Diversified Loan Portfolio 4Q22 Loan Portfolio Loan portfolio is well diversified across loan types and geographies C&I loans represent second-largest category of loans CRE and C&D concentrations were 292% and 79%, respectively, at 4Q22 Top 25 relationships totaled $2.6 billion, or 9.6% of total committed exposure of $26.5 billion Participations purchased ~ 1.0% of loans; Limited exposure in SNCs and Syndications Increased diligence by Credit staff on stress testing given the current economic environment, including loan type and concentration monitoring, particularly in C&D and Investor CRE loans Continued strong asset quality driven by substantial equity and experienced sponsor group Portfolio Highlights Total Loans $19.9 Billion
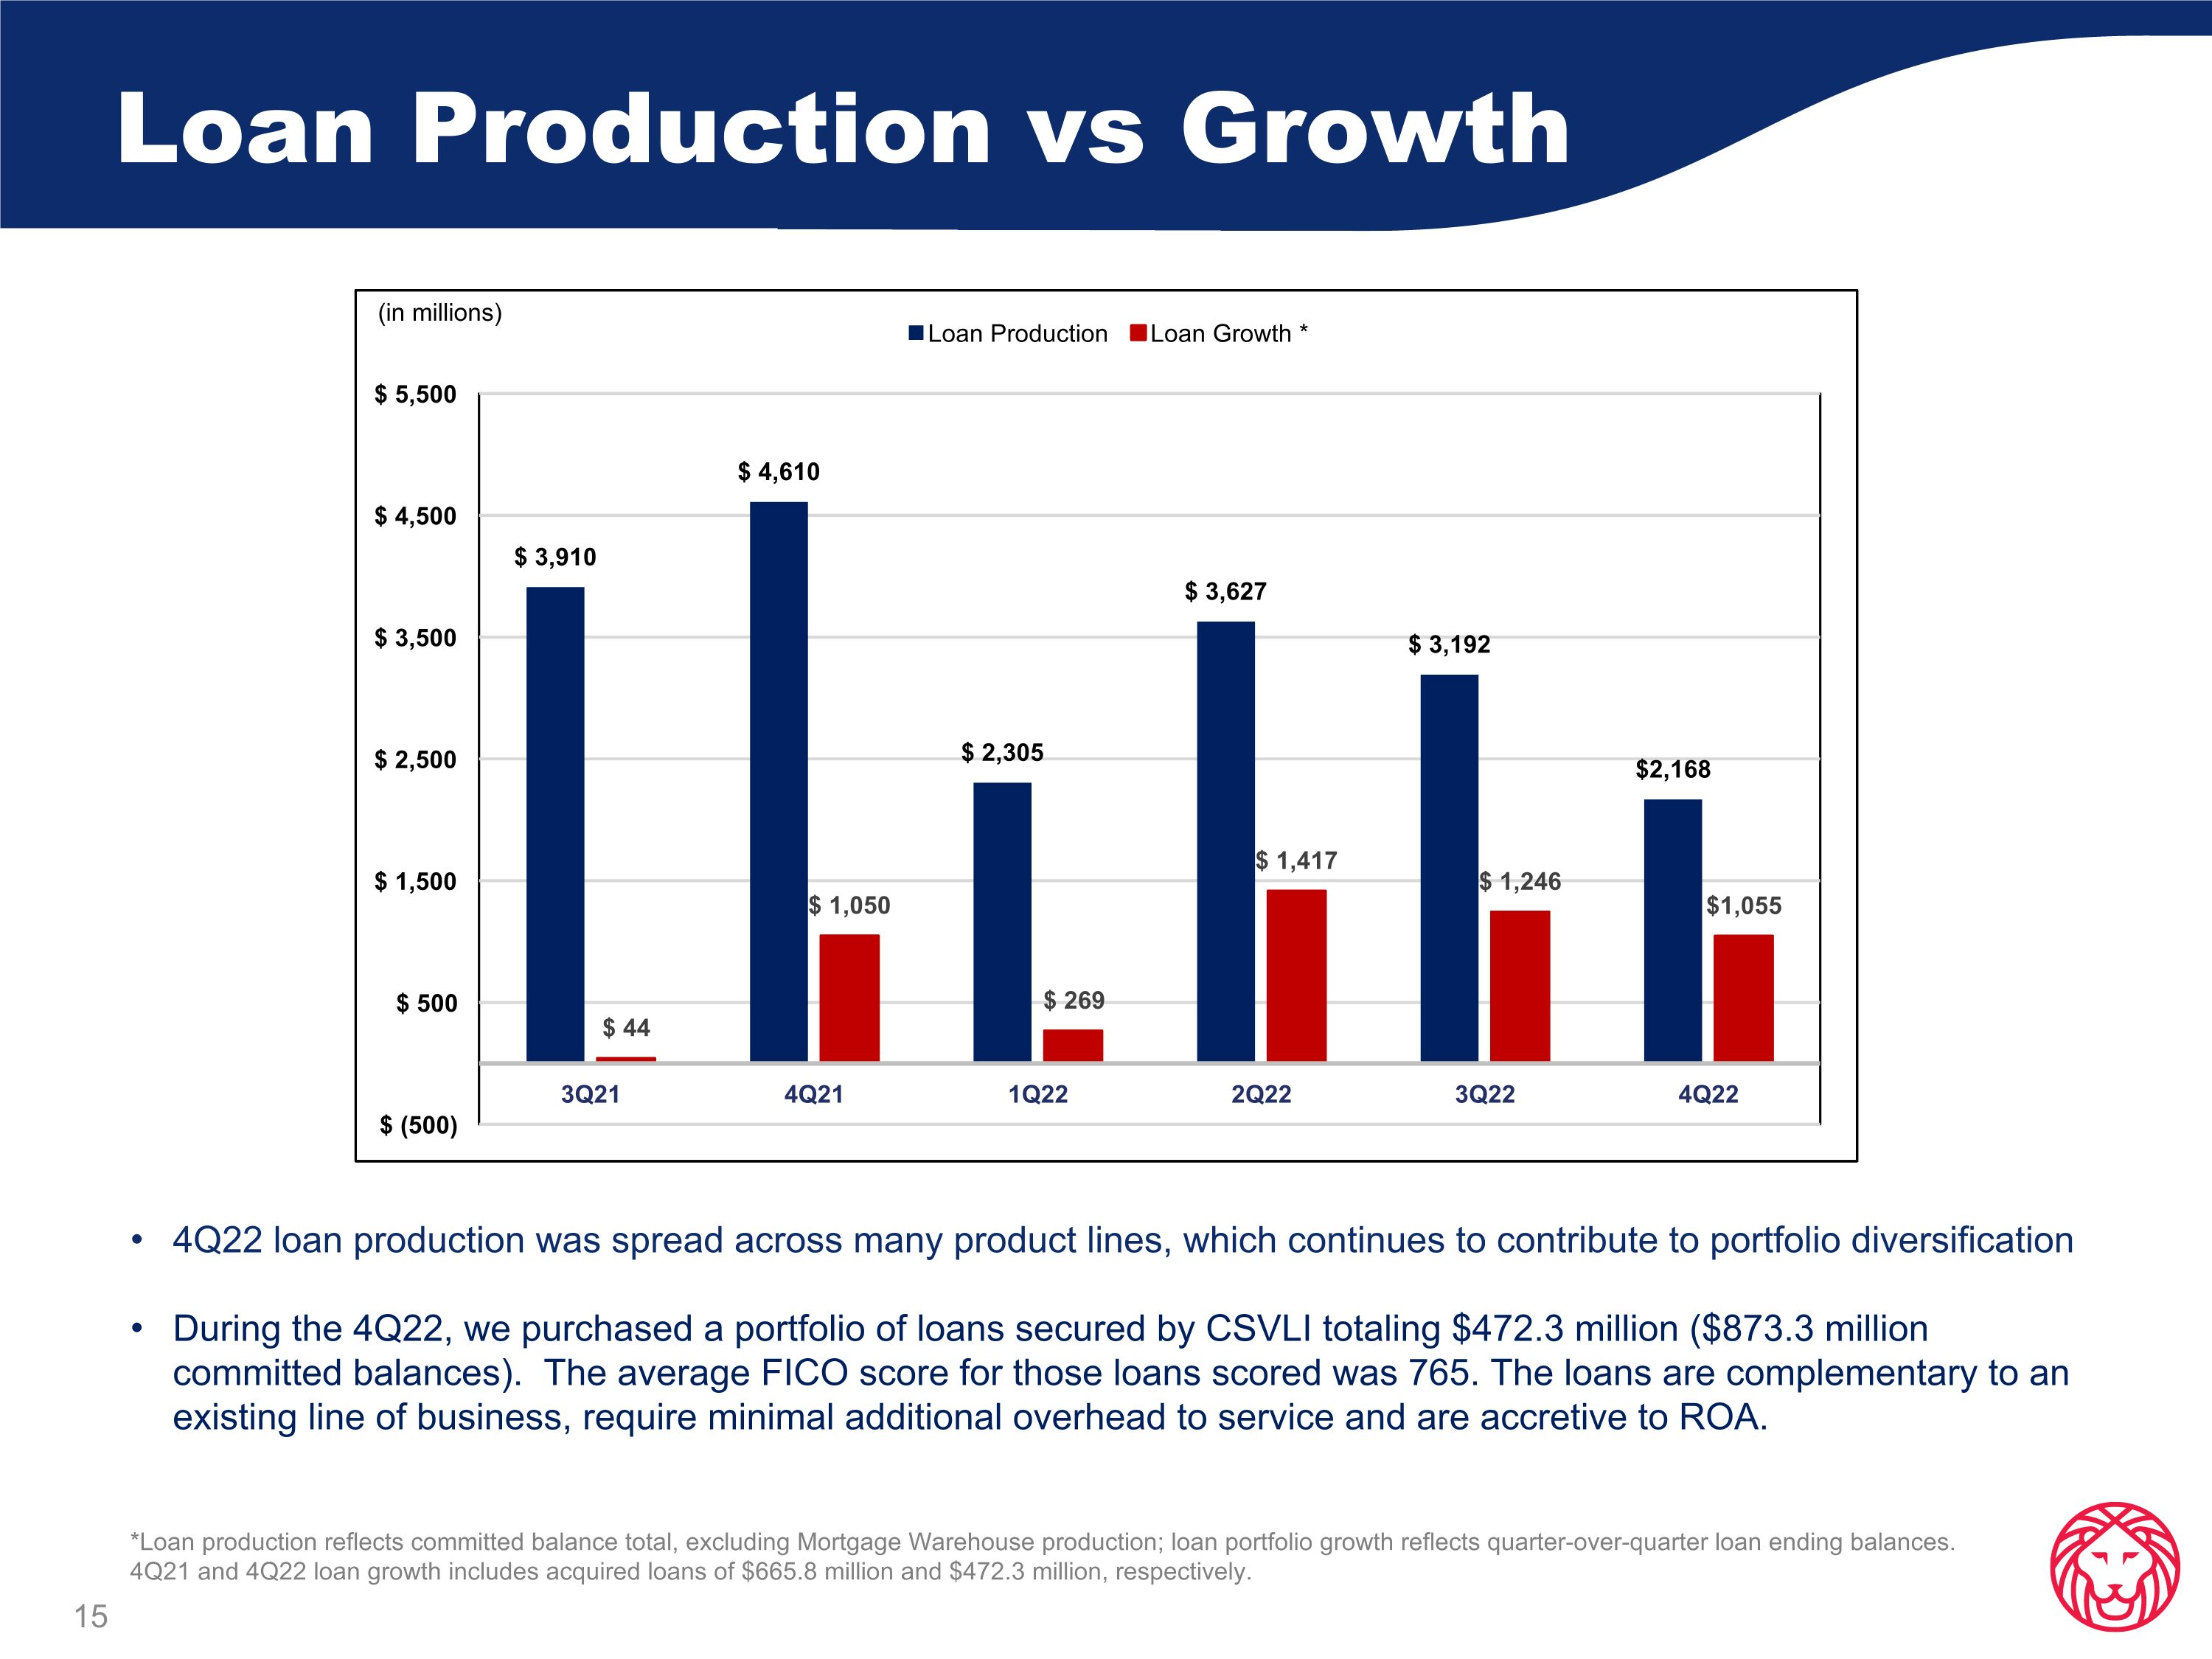
Loan Production vs Growth 4Q22 loan production was spread across many product lines, which continues to contribute to portfolio diversification During the 4Q22, we purchased a portfolio of loans secured by CSVLI totaling $472.3 million ($873.3 million committed balances). The average FICO score for those loans scored was 765. The loans are complementary to an existing line of business, require minimal additional overhead to service and are accretive to ROA. *Loan production reflects committed balance total, excluding Mortgage Warehouse production; loan portfolio growth reflects quarter-over-quarter loan ending balances. 4Q21 and 4Q22 loan growth includes acquired loans of $665.8 million and $472.3 million, respectively. (in millions)
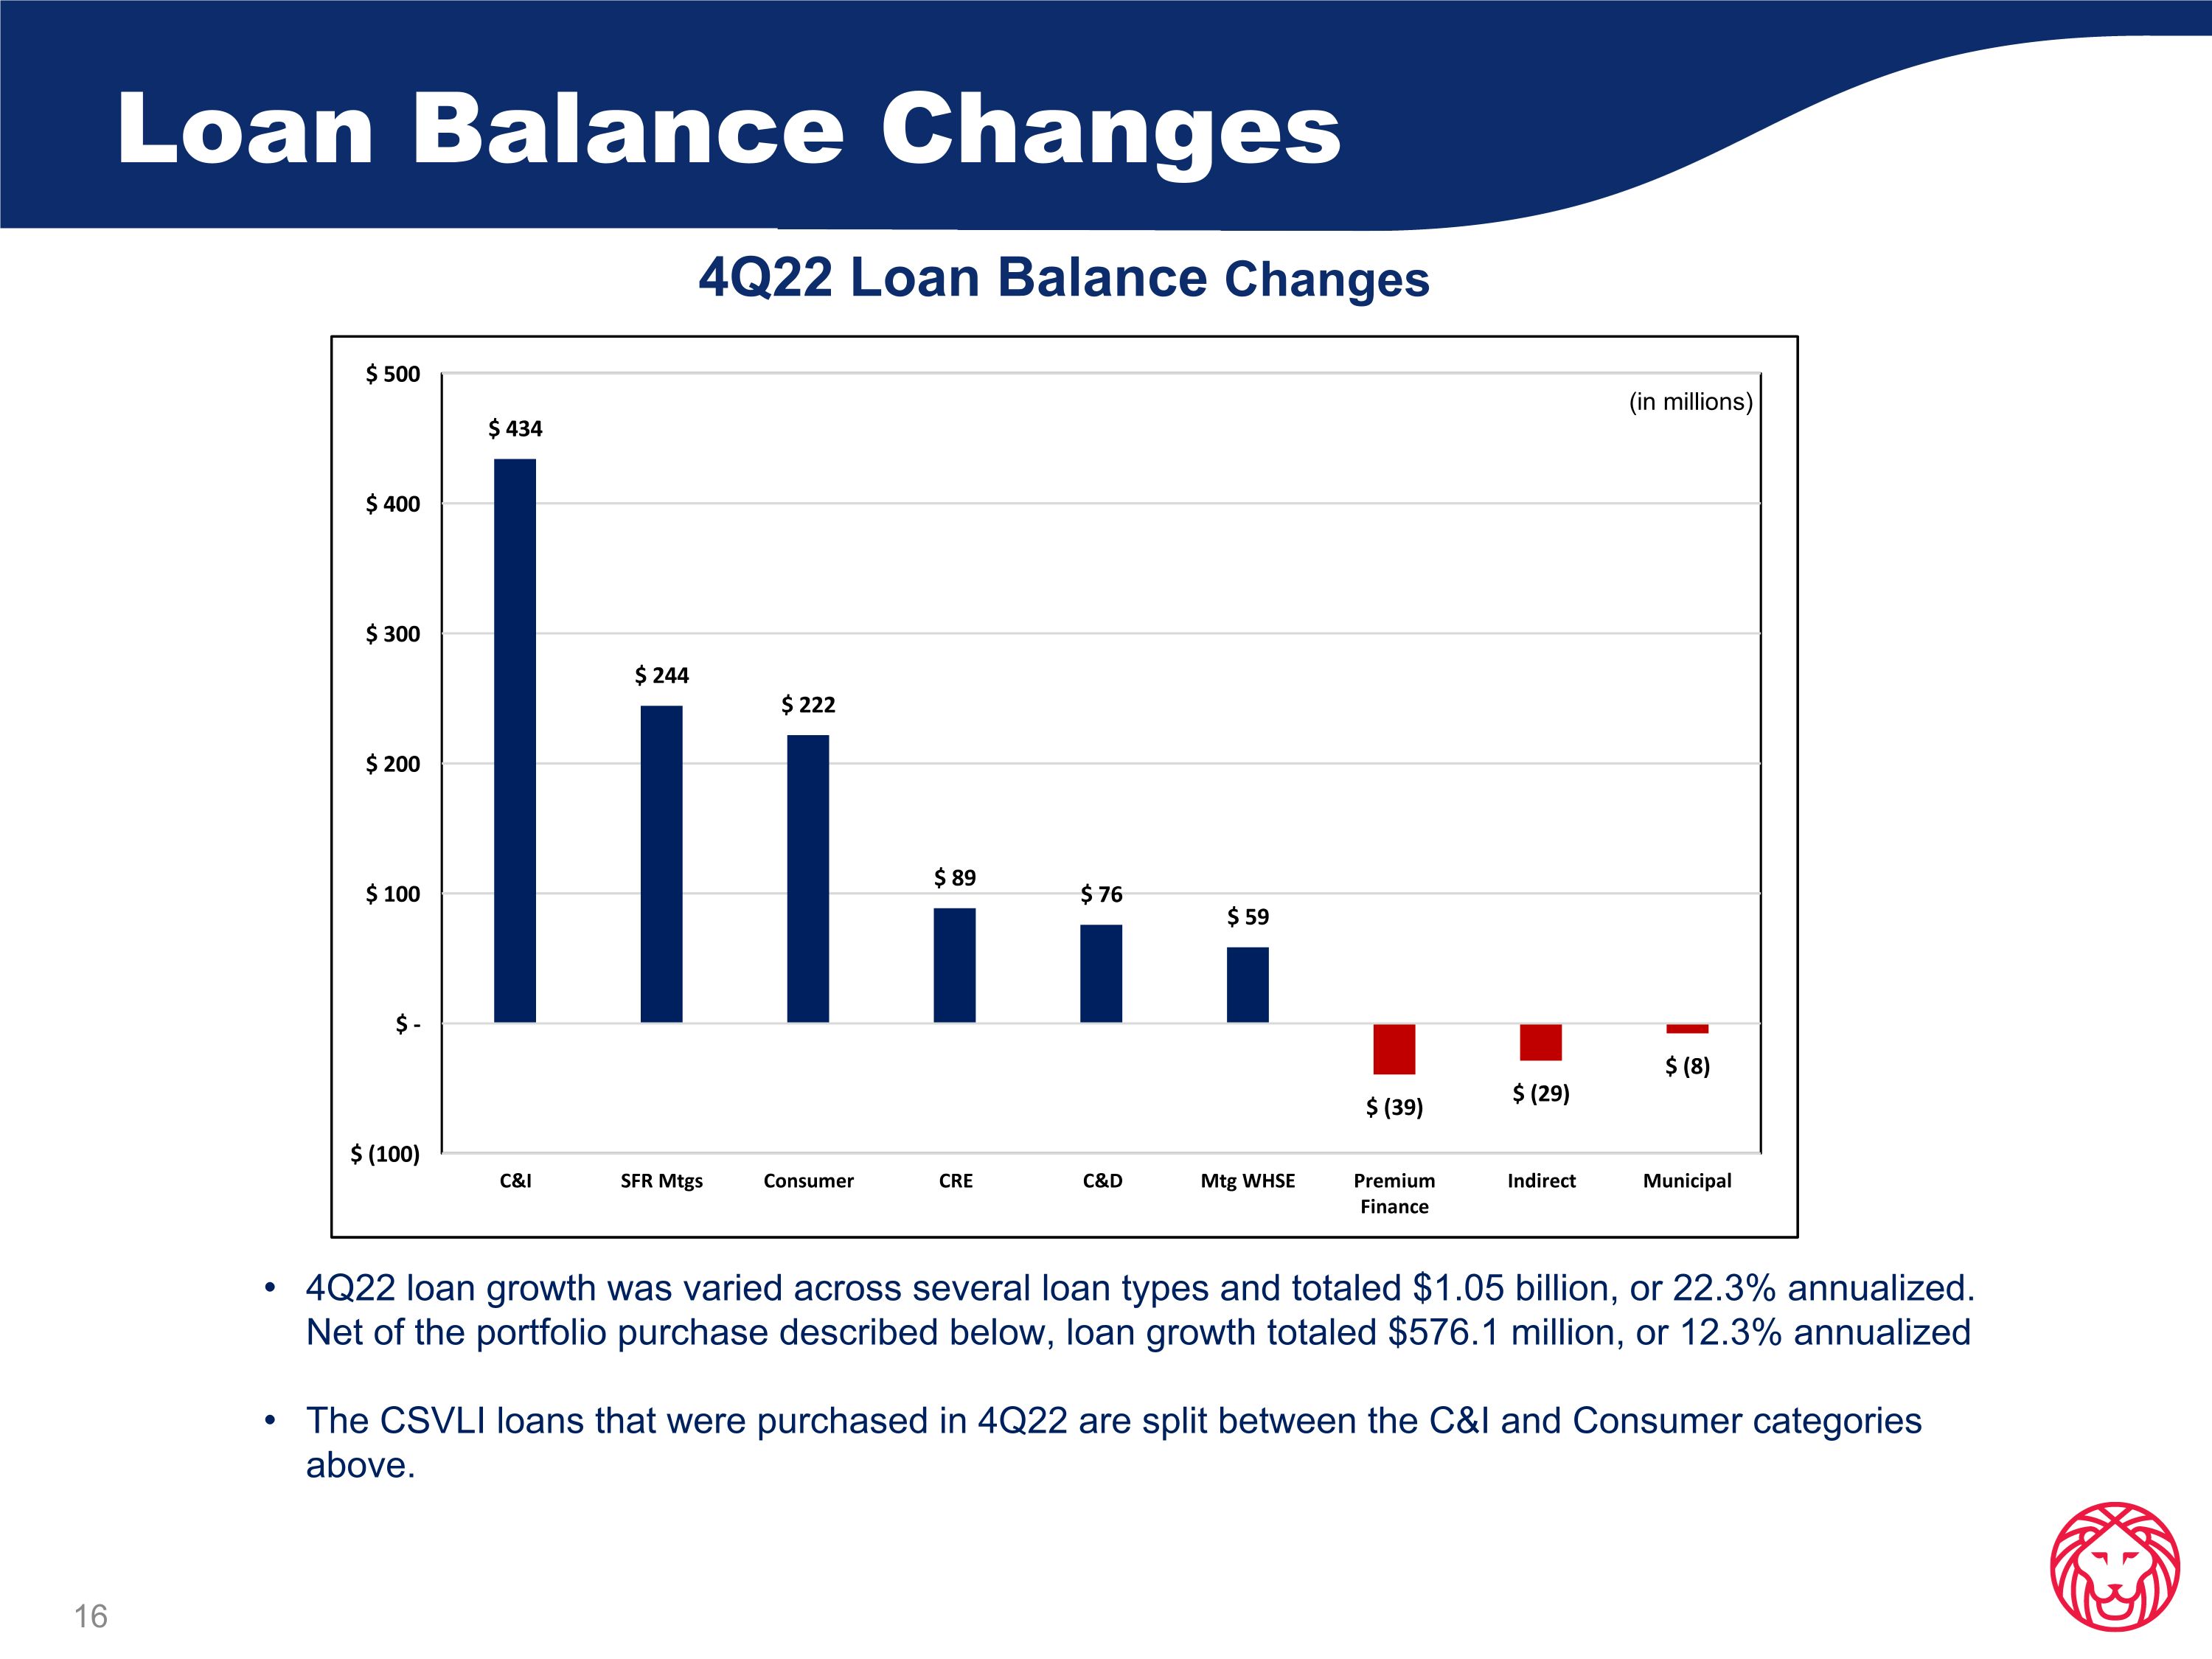
Loan Balance Changes 4Q22 Loan Balance Changes 4Q22 loan growth was varied across several loan types and totaled $1.05 billion, or 22.3% annualized. Net of the portfolio purchase described below, loan growth totaled $576.1 million, or 12.3% annualized The CSVLI loans that were purchased in 4Q22 are split between the C&I and Consumer categories above. (in millions)
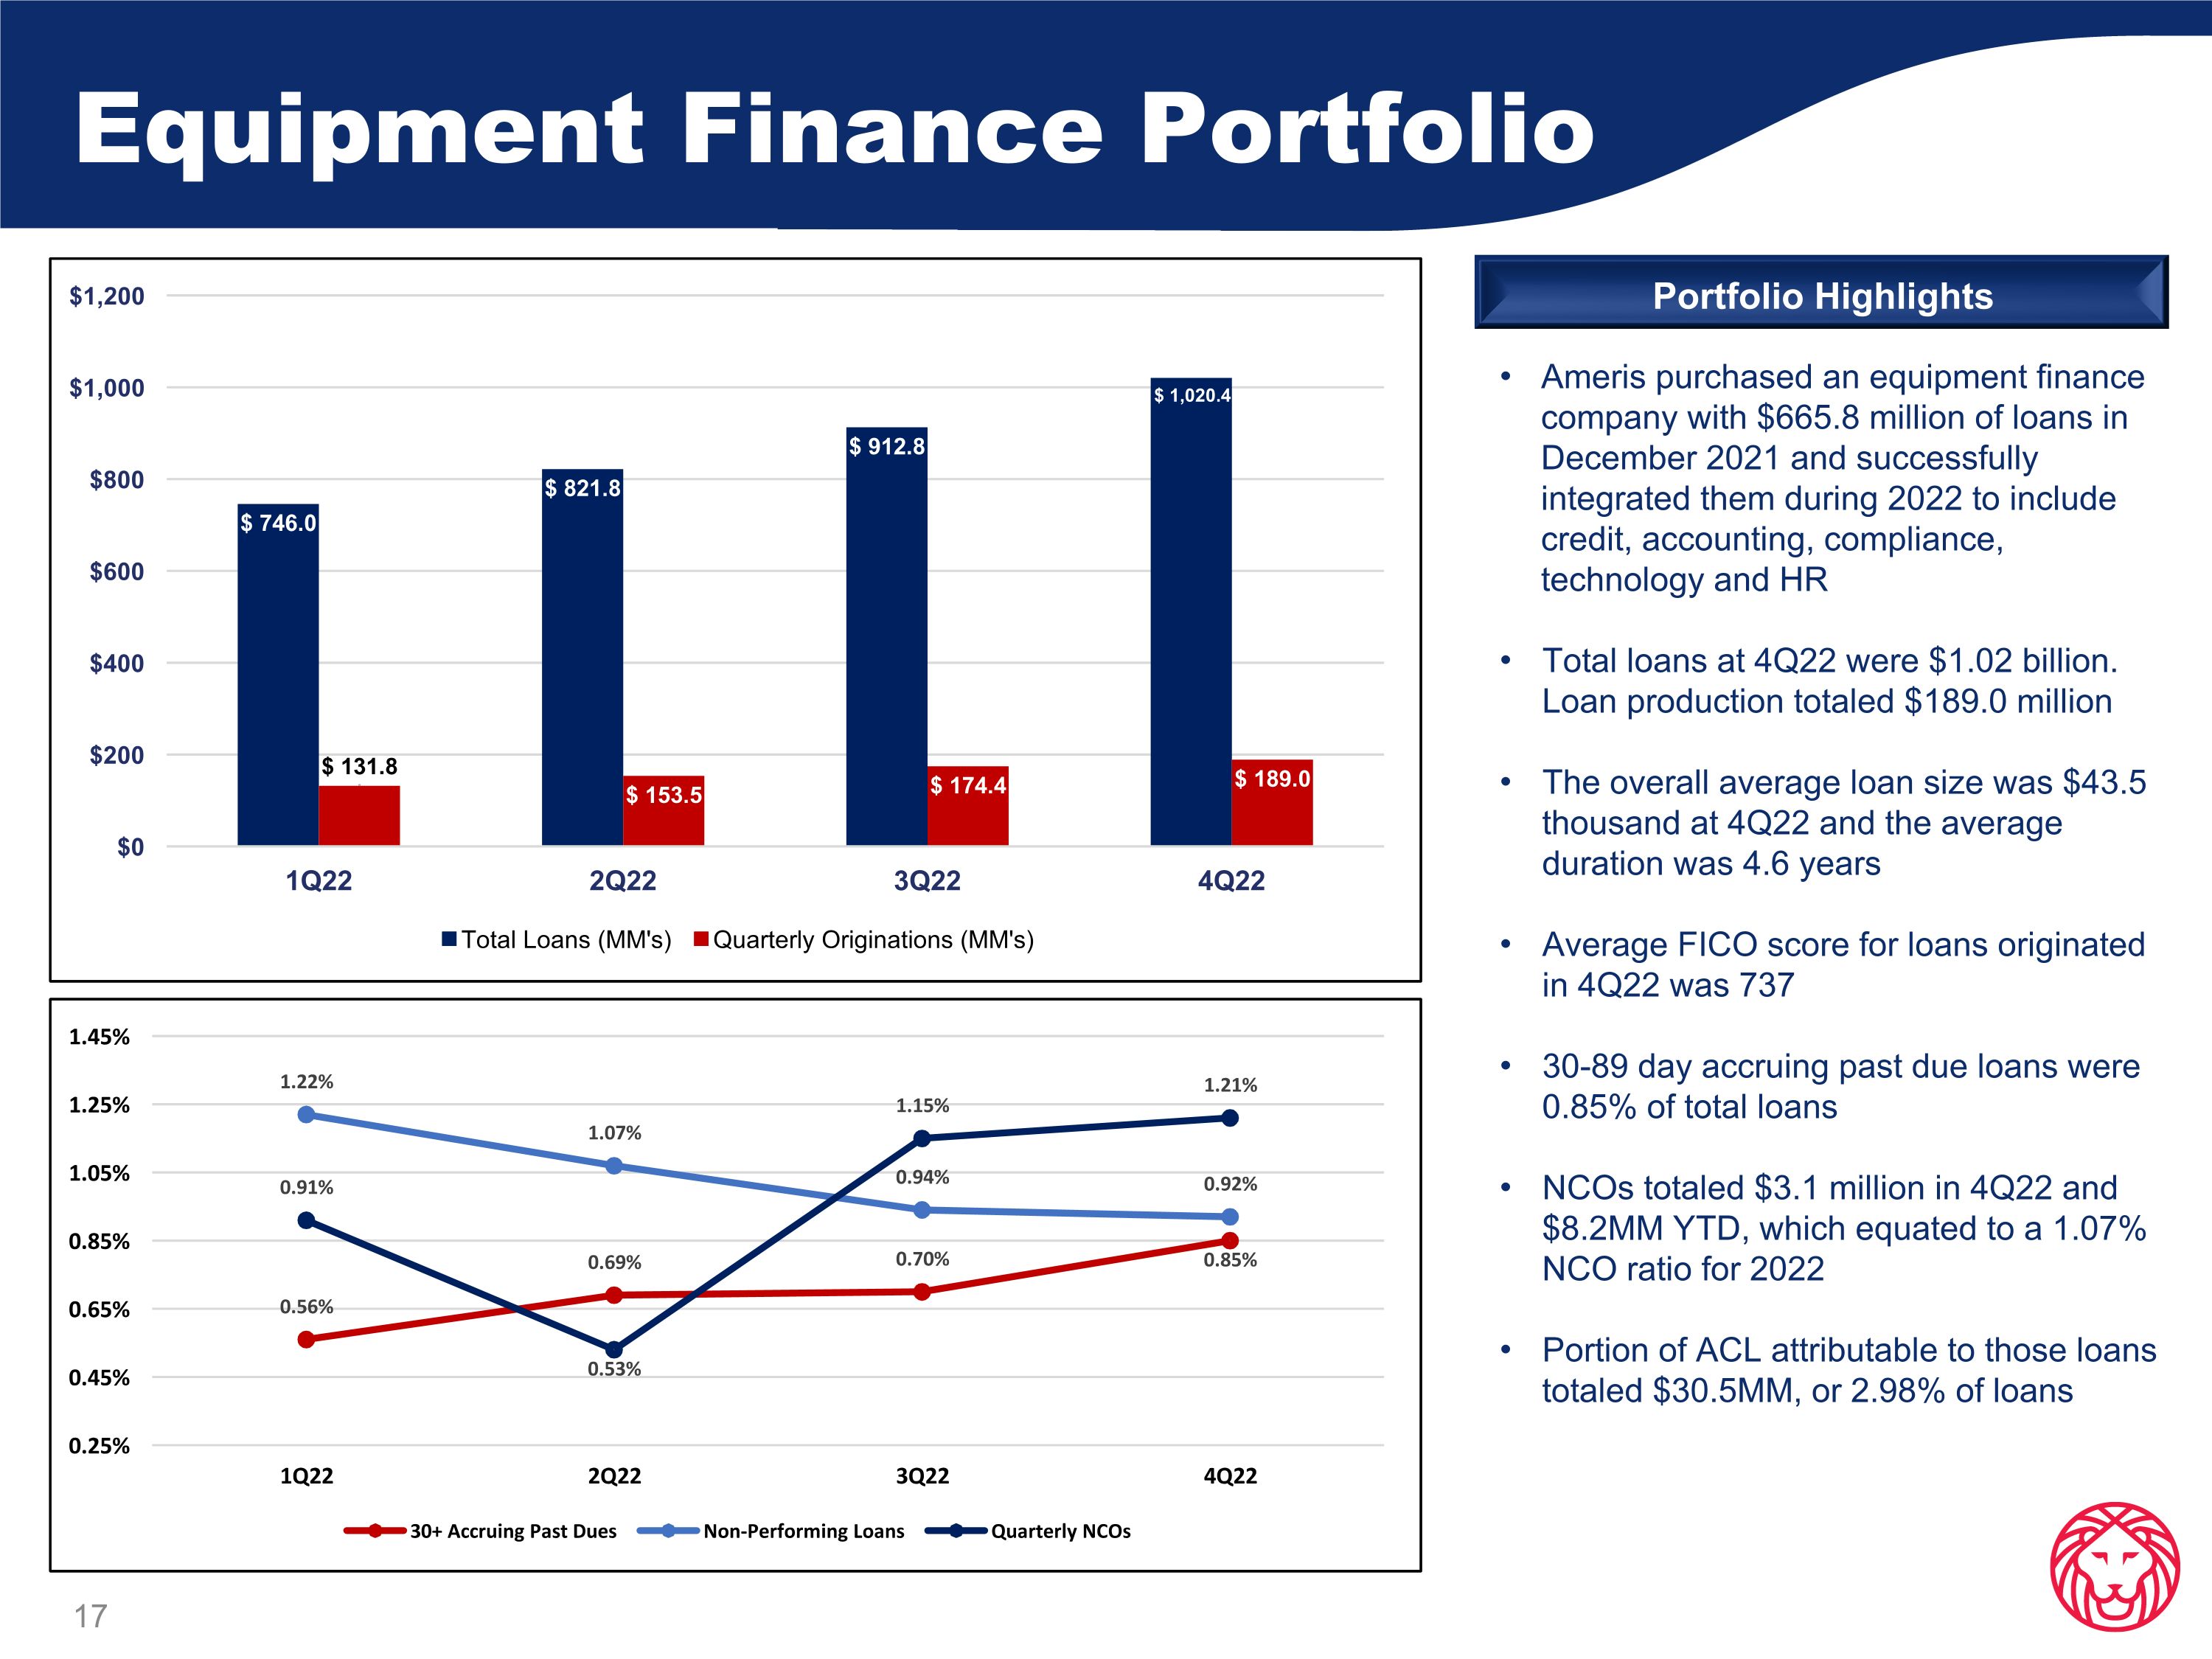
Equipment Finance Portfolio Ameris purchased an equipment finance company with $665.8 million of loans in December 2021 and successfully integrated them during 2022 to include credit, accounting, compliance, technology and HR Total loans at 4Q22 were $1.02 billion. Loan production totaled $189.0 million The overall average loan size was $43.5 thousand at 4Q22 and the average duration was 4.6 years Average FICO score for loans originated in 4Q22 was 737 30-89 day accruing past due loans were 0.85% of total loans NCOs totaled $3.1 million in 4Q22 and $8.2MM YTD, which equated to a 1.07% NCO ratio for 2022 Portion of ACL attributable to those loans totaled $30.5MM, or 2.98% of loans Portfolio Highlights
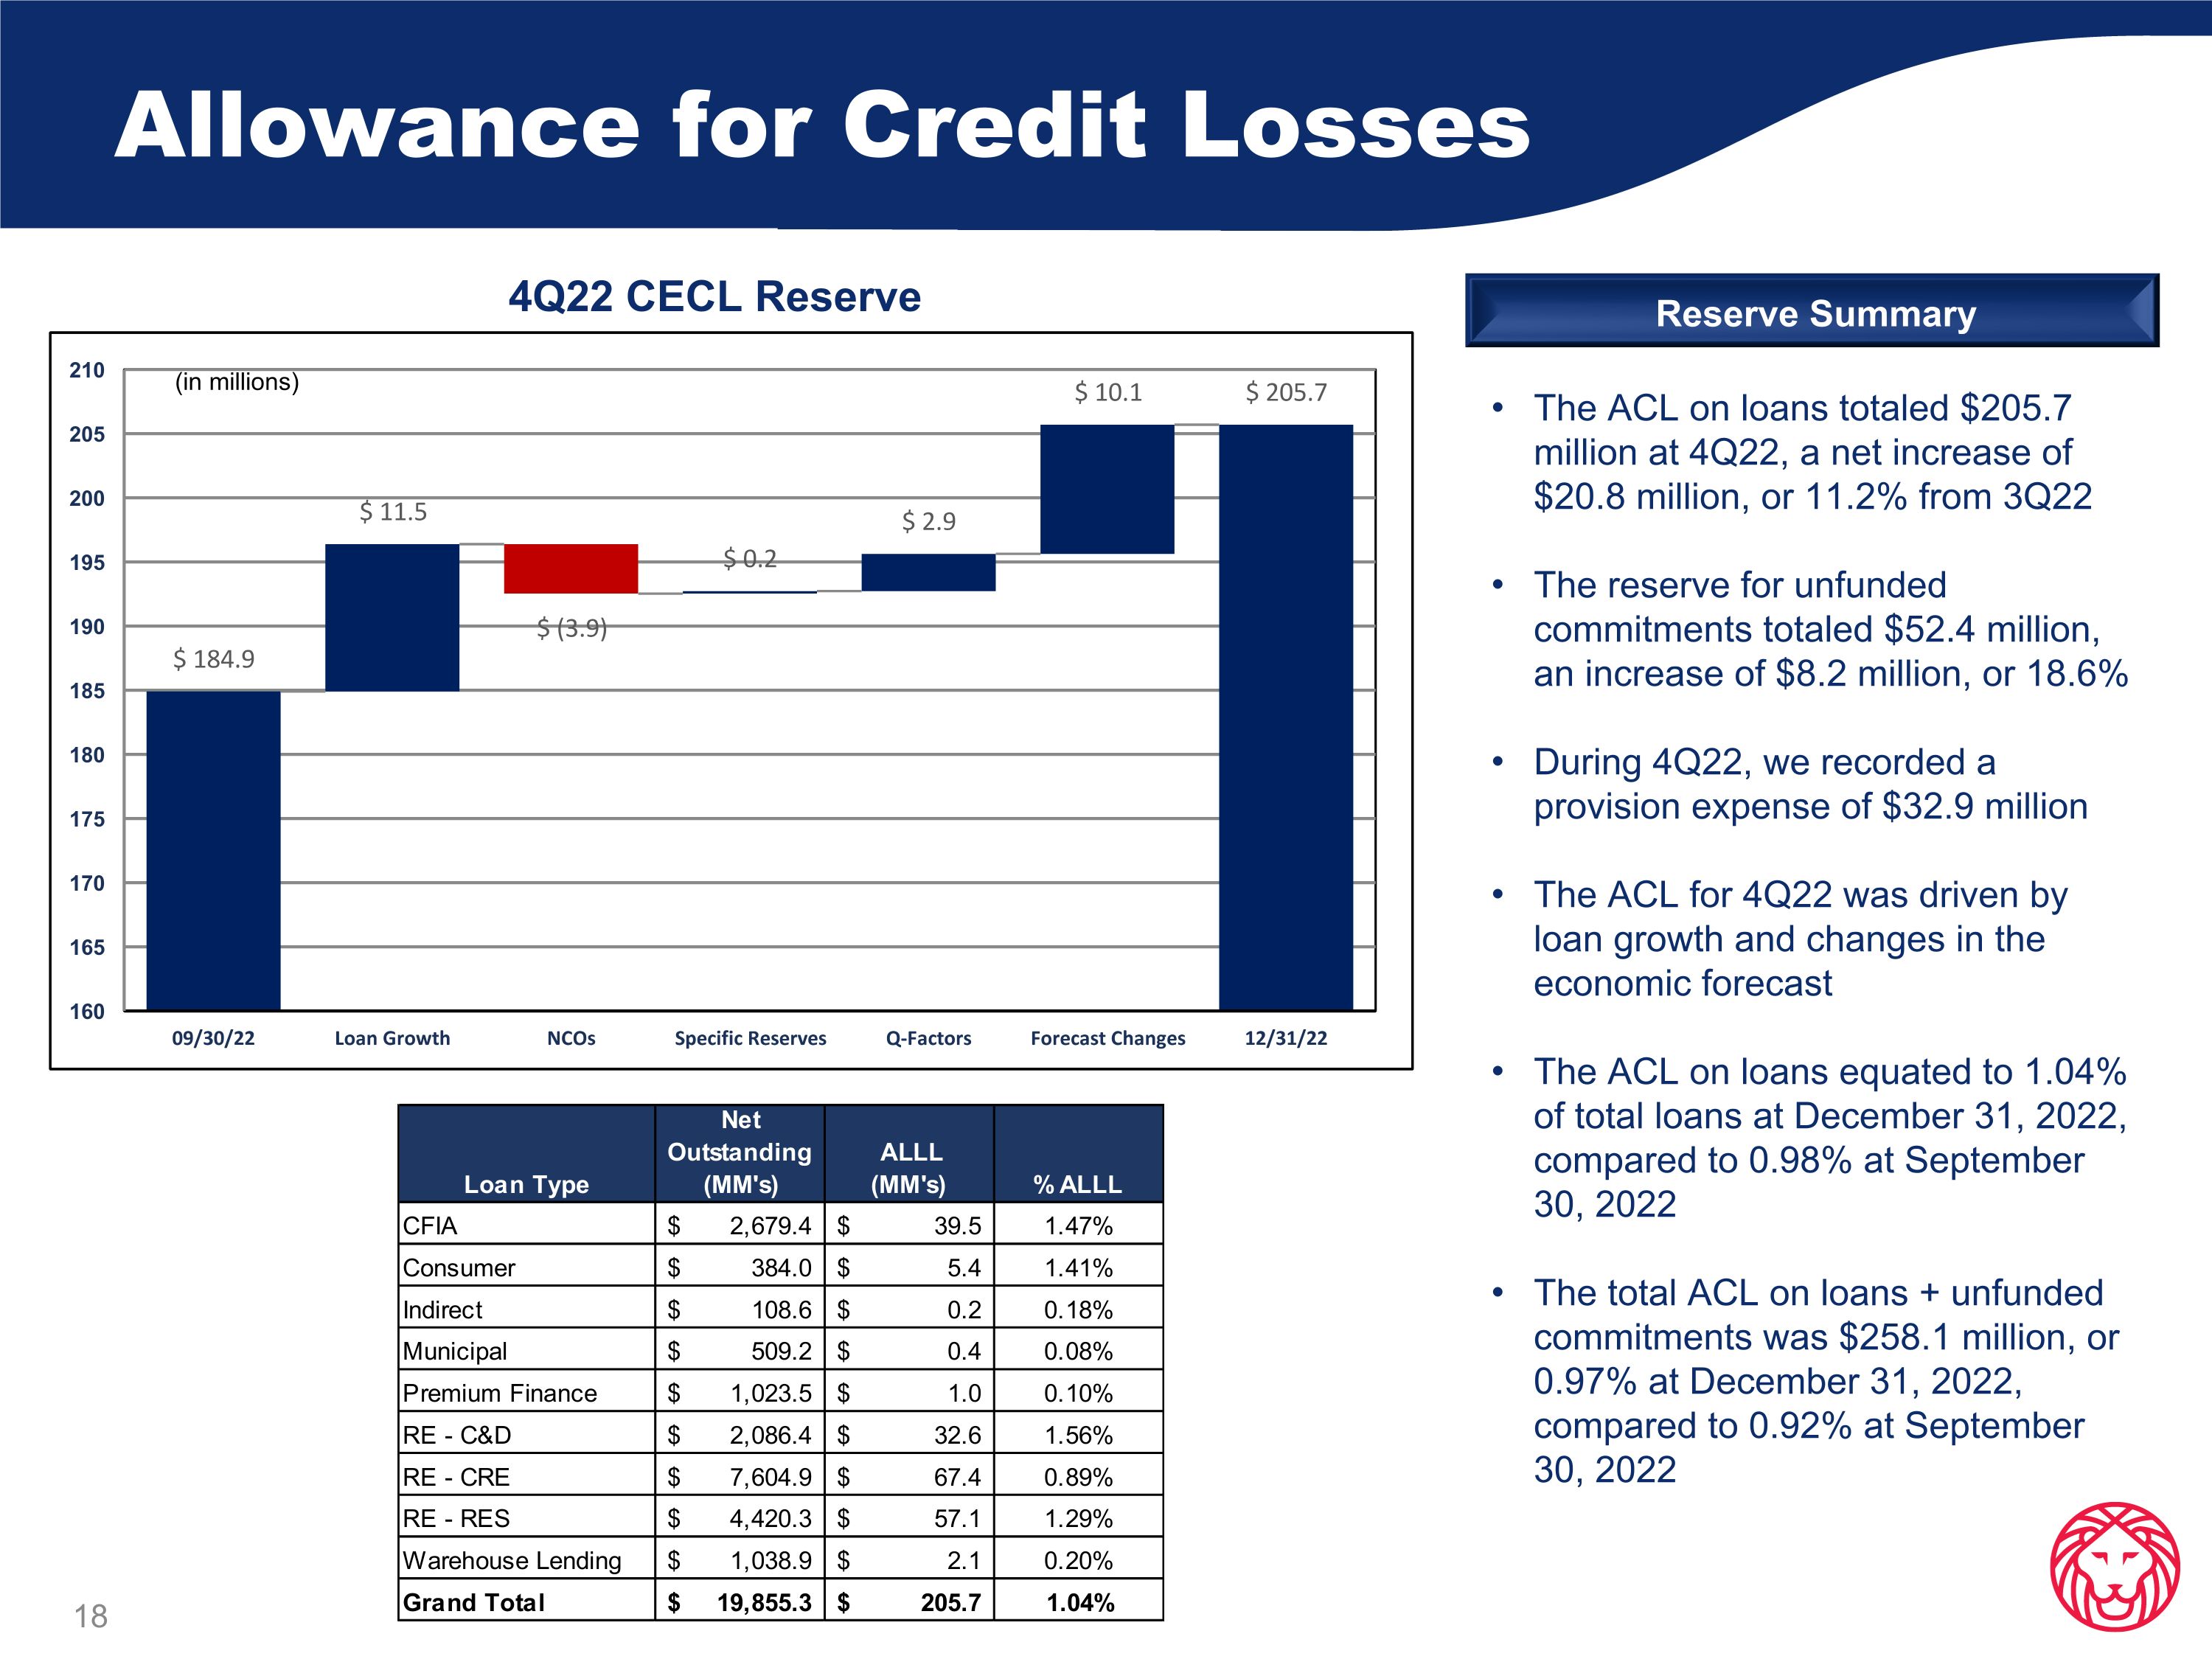
Allowance for Credit Losses The ACL on loans totaled $205.7 million at 4Q22, a net increase of $20.8 million, or 11.2% from 3Q22 The reserve for unfunded commitments totaled $52.4 million, an increase of $8.2 million, or 18.6% During 4Q22, we recorded a provision expense of $32.9 million The ACL for 4Q22 was driven by loan growth and changes in the economic forecast The ACL on loans equated to 1.04% of total loans at December 31, 2022, compared to 0.98% at September 30, 2022 The total ACL on loans + unfunded commitments was $258.1 million, or 0.97% at December 31, 2022, compared to 0.92% at September 30, 2022 4Q22 CECL Reserve Reserve Summary (in millions)
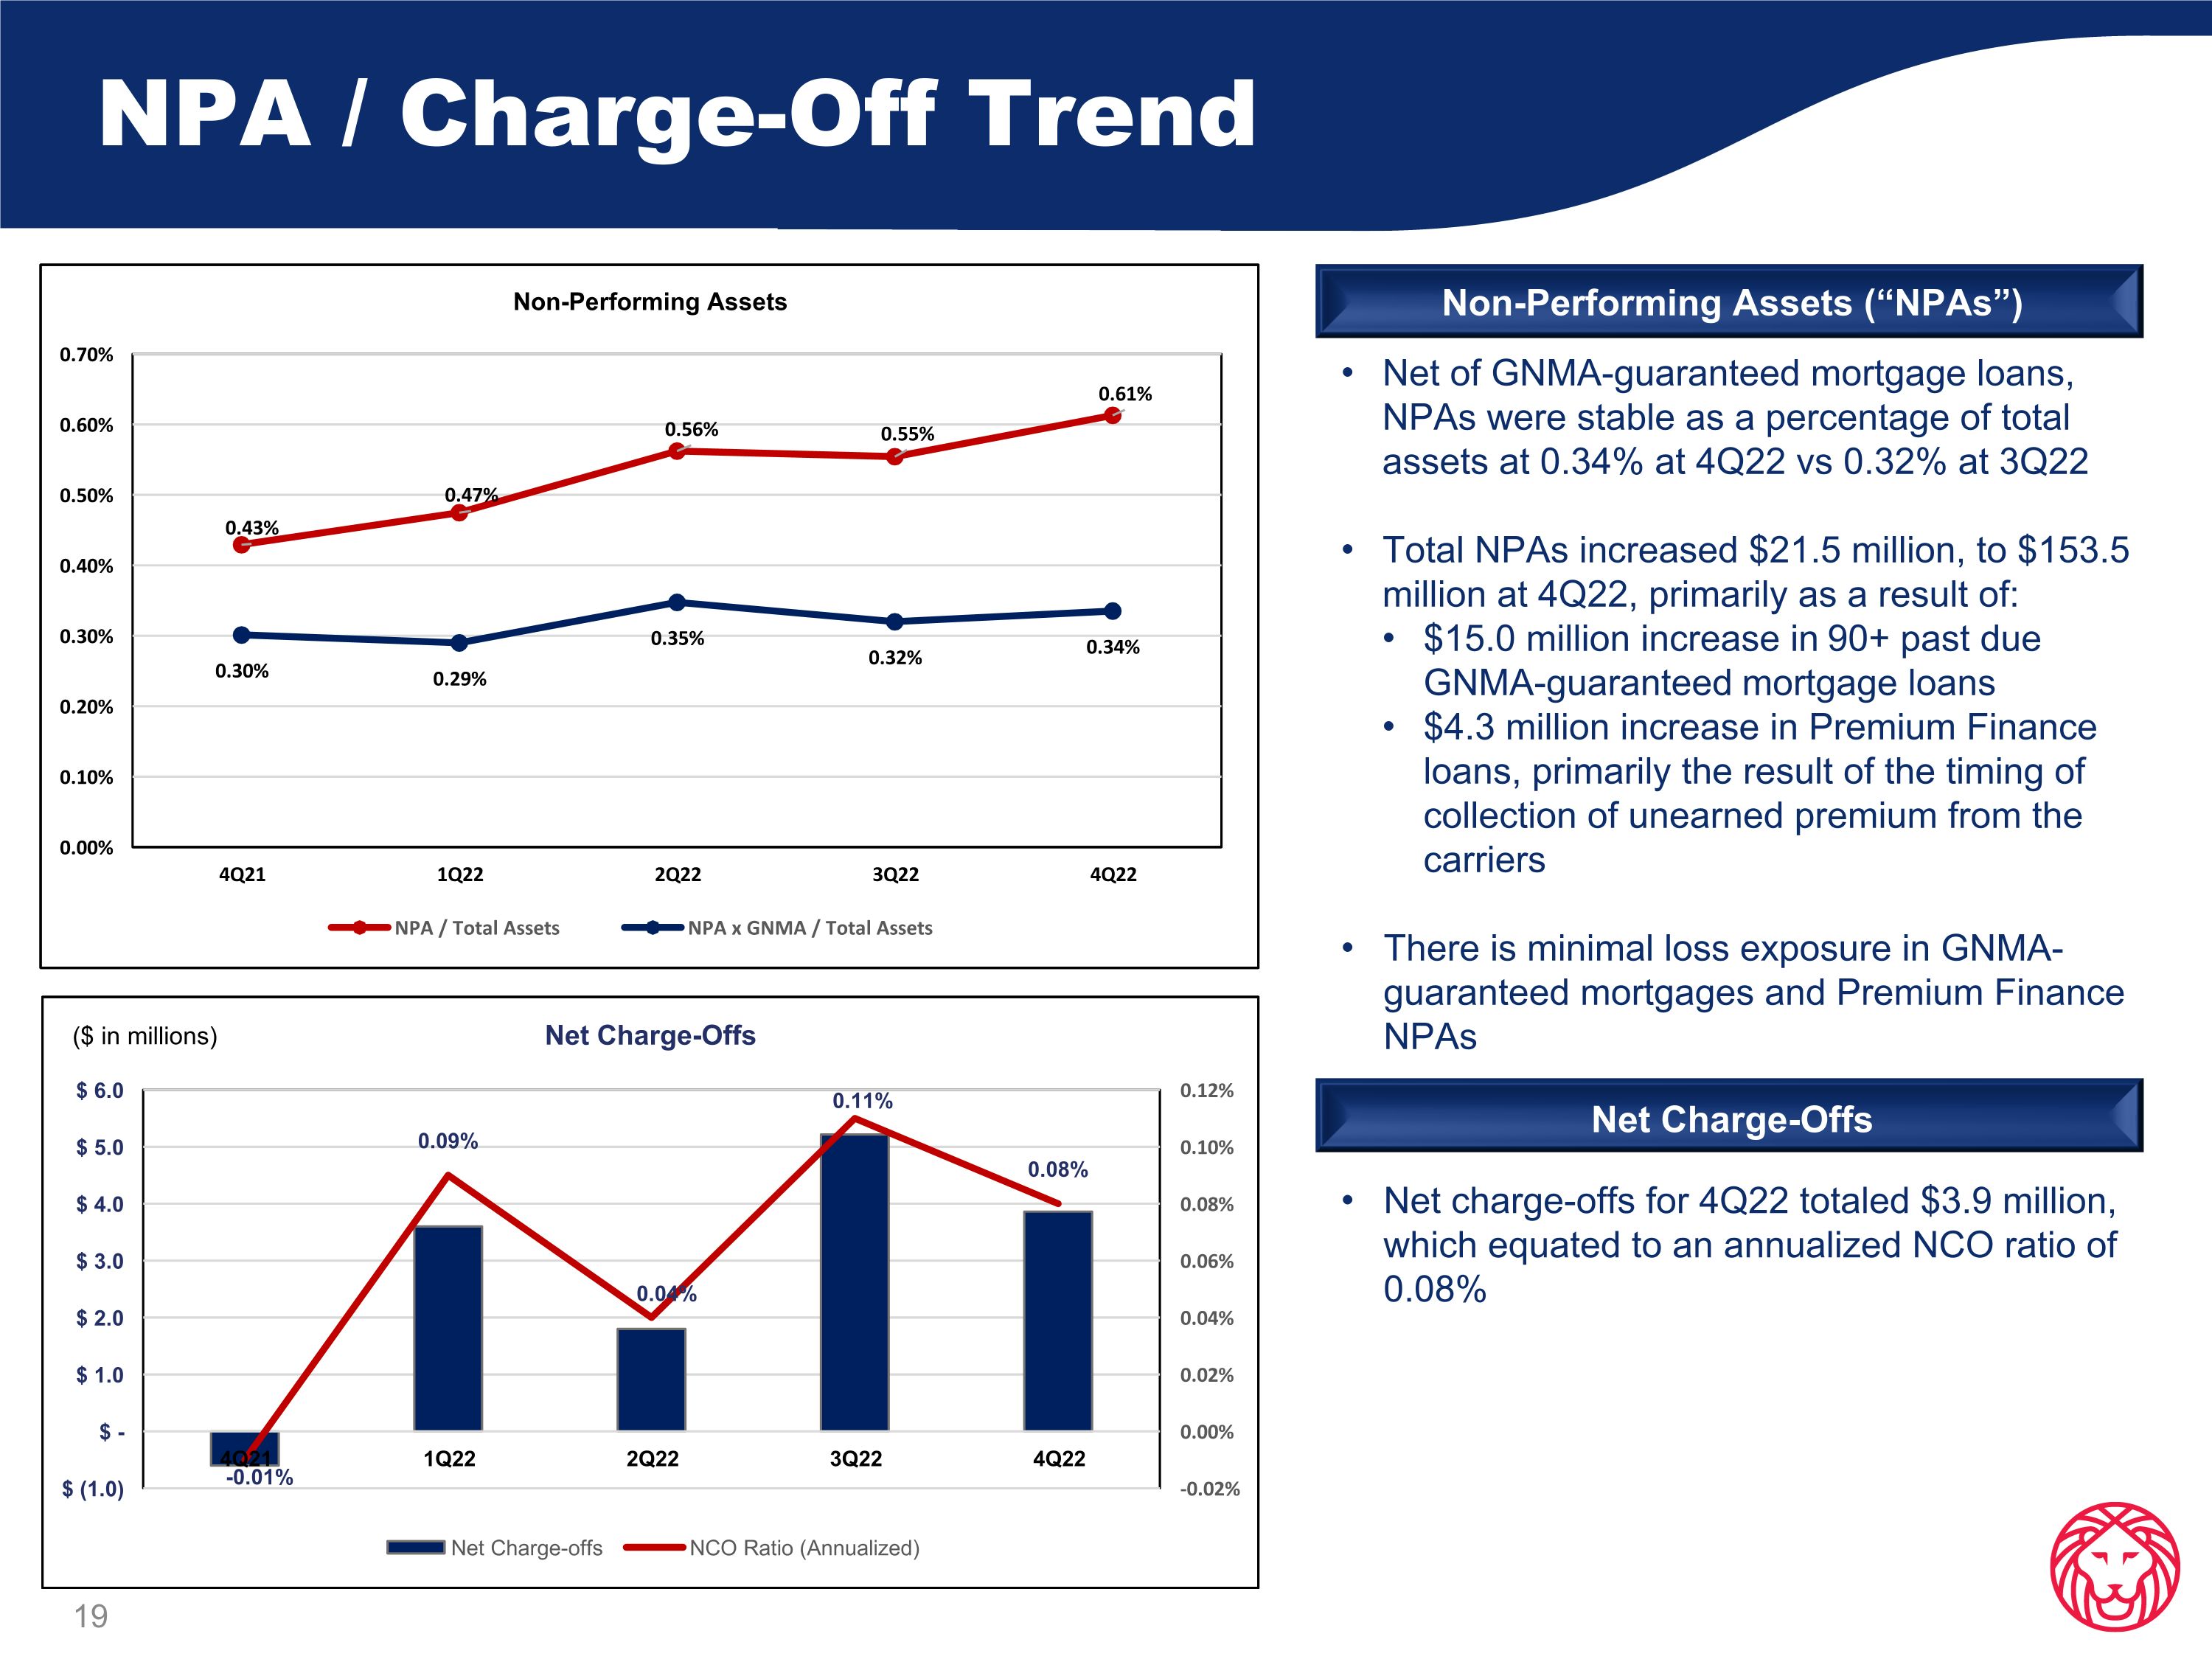
NPA / Charge-Off Trend Net of GNMA-guaranteed mortgage loans, NPAs were stable as a percentage of total assets at 0.34% at 4Q22 vs 0.32% at 3Q22 Total NPAs increased $21.5 million, to $153.5 million at 4Q22, primarily as a result of: $15.0 million increase in 90+ past due GNMA-guaranteed mortgage loans $4.3 million increase in Premium Finance loans, primarily the result of the timing of collection of unearned premium from the carriers There is minimal loss exposure in GNMA-guaranteed mortgages and Premium Finance NPAs Net charge-offs for 4Q22 totaled $3.9 million, which equated to an annualized NCO ratio of 0.08% Non-Performing Assets (“NPAs”) Net Charge-Offs ($ in millions)
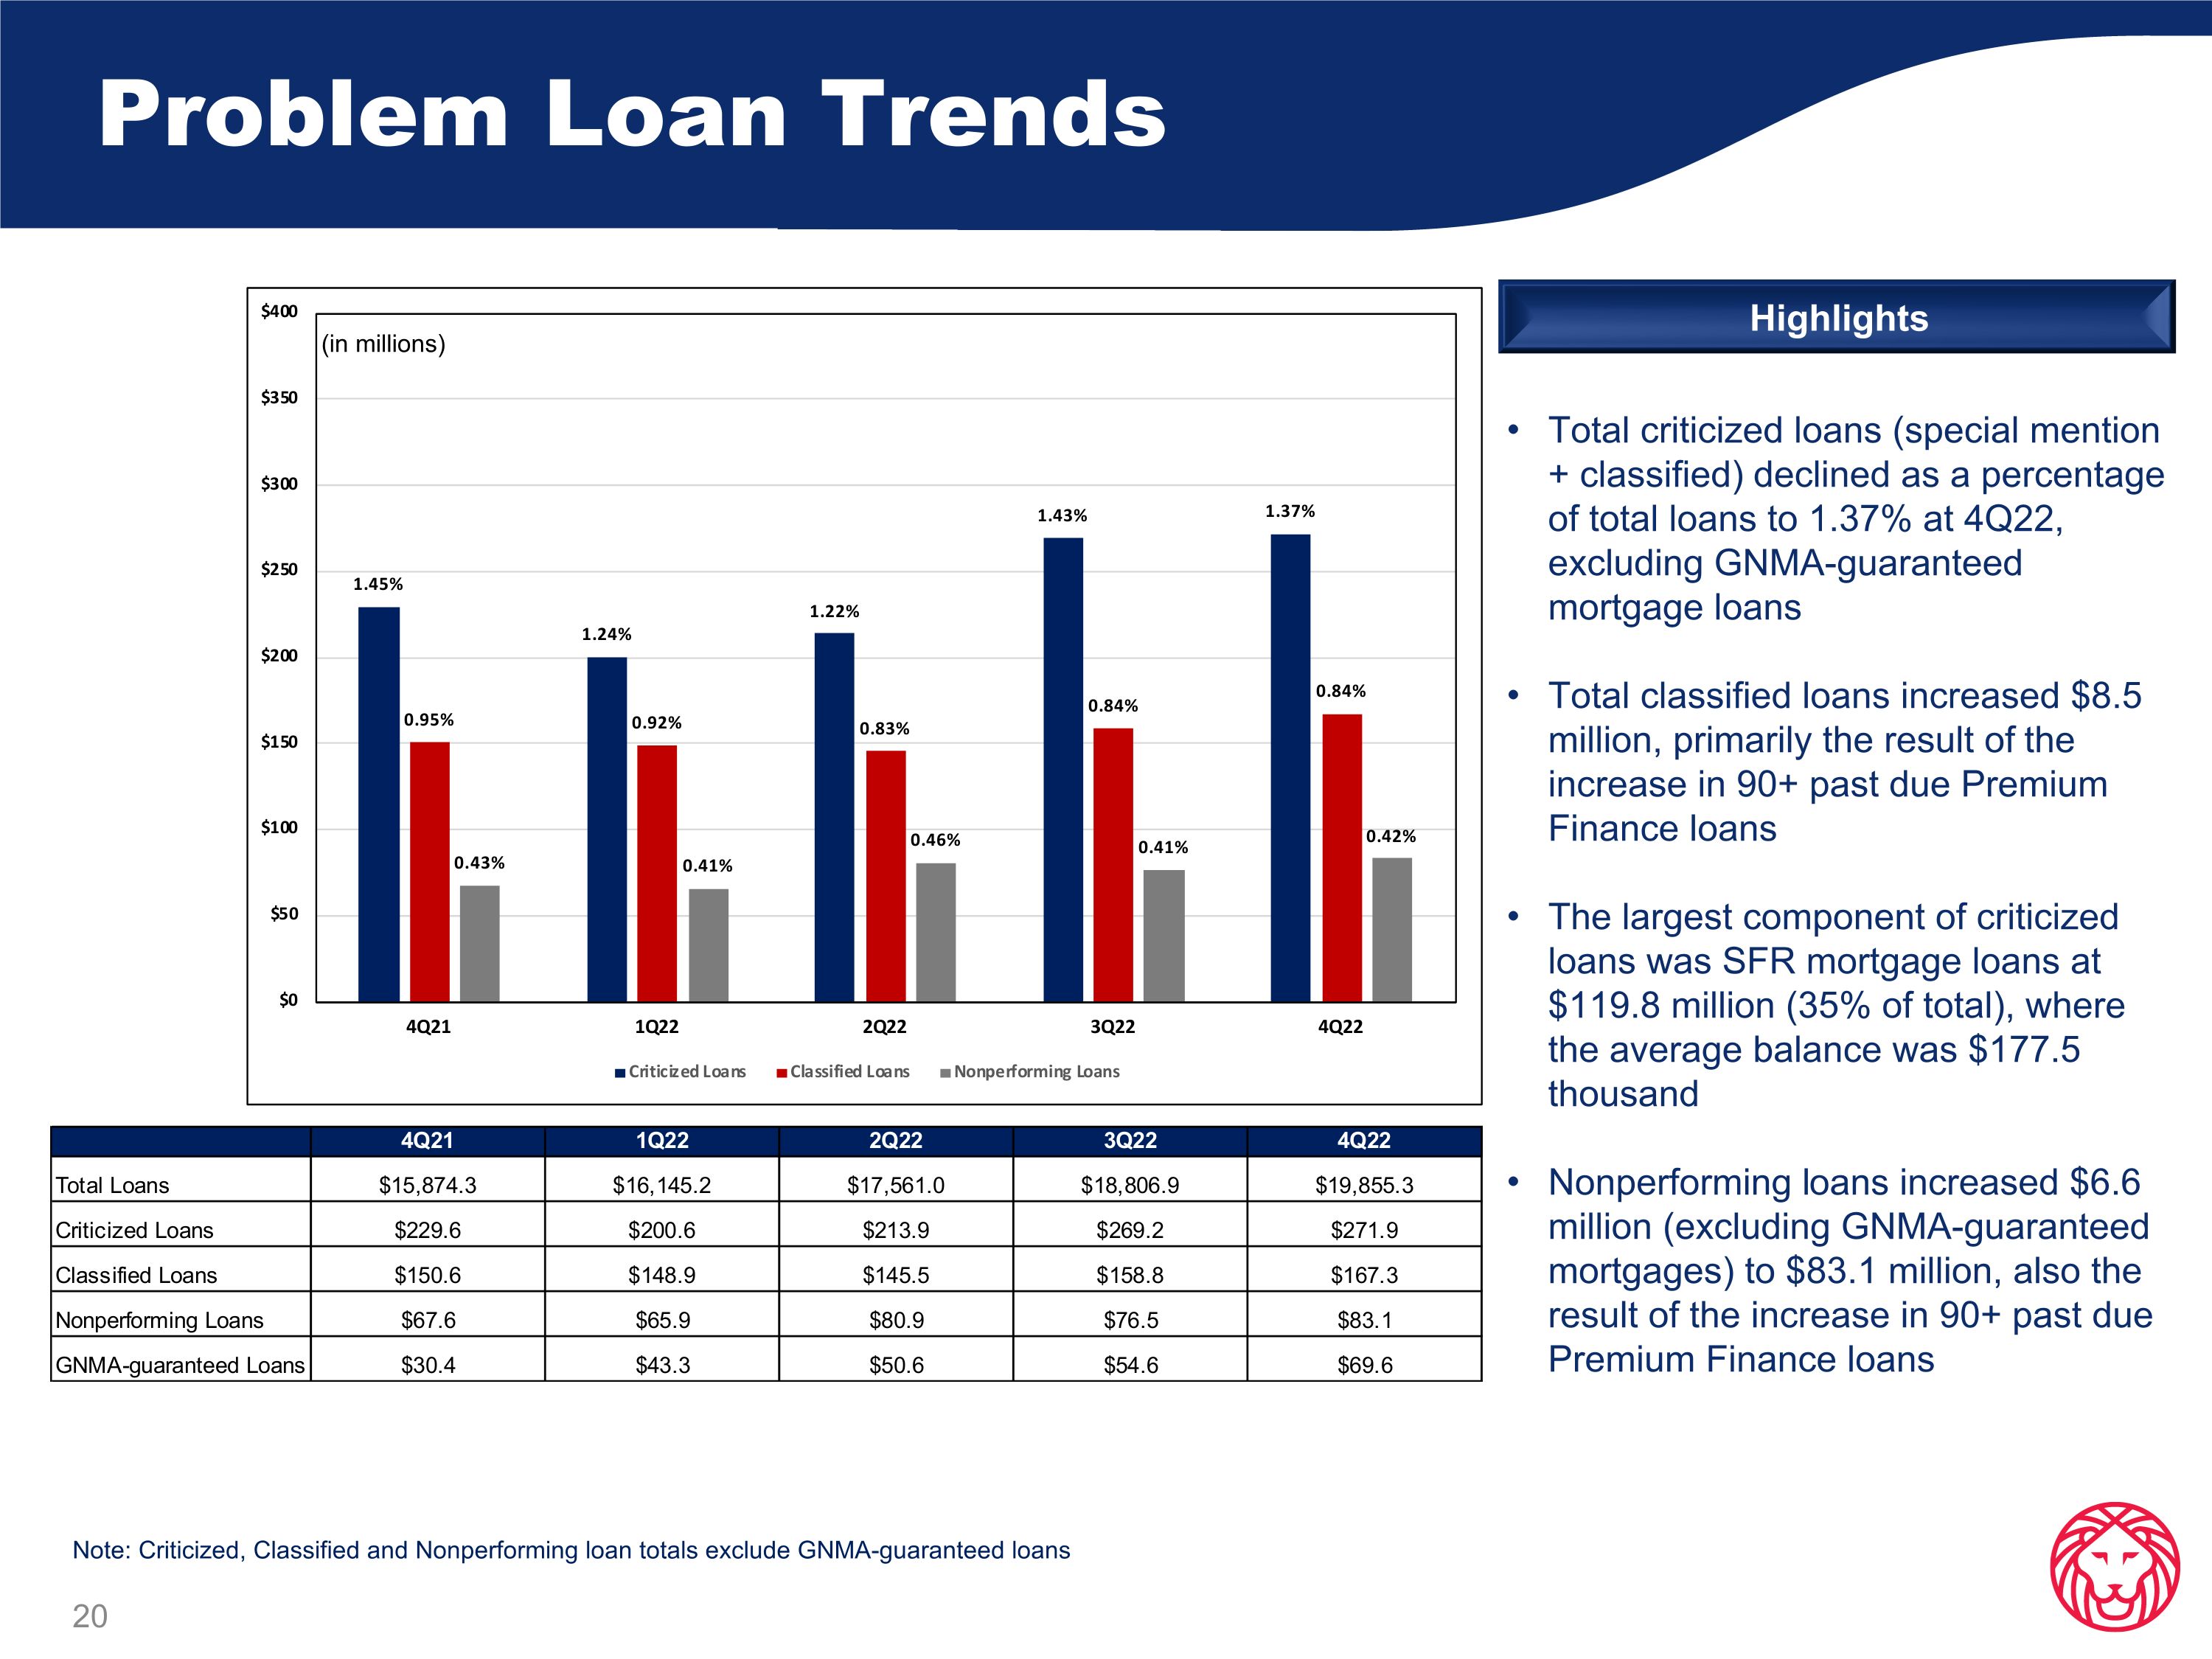
Problem Loan Trends Total criticized loans (special mention + classified) declined as a percentage of total loans to 1.37% at 4Q22, excluding GNMA-guaranteed mortgage loans Total classified loans increased $8.5 million, primarily the result of the increase in 90+ past due Premium Finance loans The largest component of criticized loans was SFR mortgage loans at $119.8 million (35% of total), where the average balance was $177.5 thousand Nonperforming loans increased $6.6 million (excluding GNMA-guaranteed mortgages) to $83.1 million, also the result of the increase in 90+ past due Premium Finance loans Highlights Note: Criticized, Classified and Nonperforming loan totals exclude GNMA-guaranteed loans (in millions)
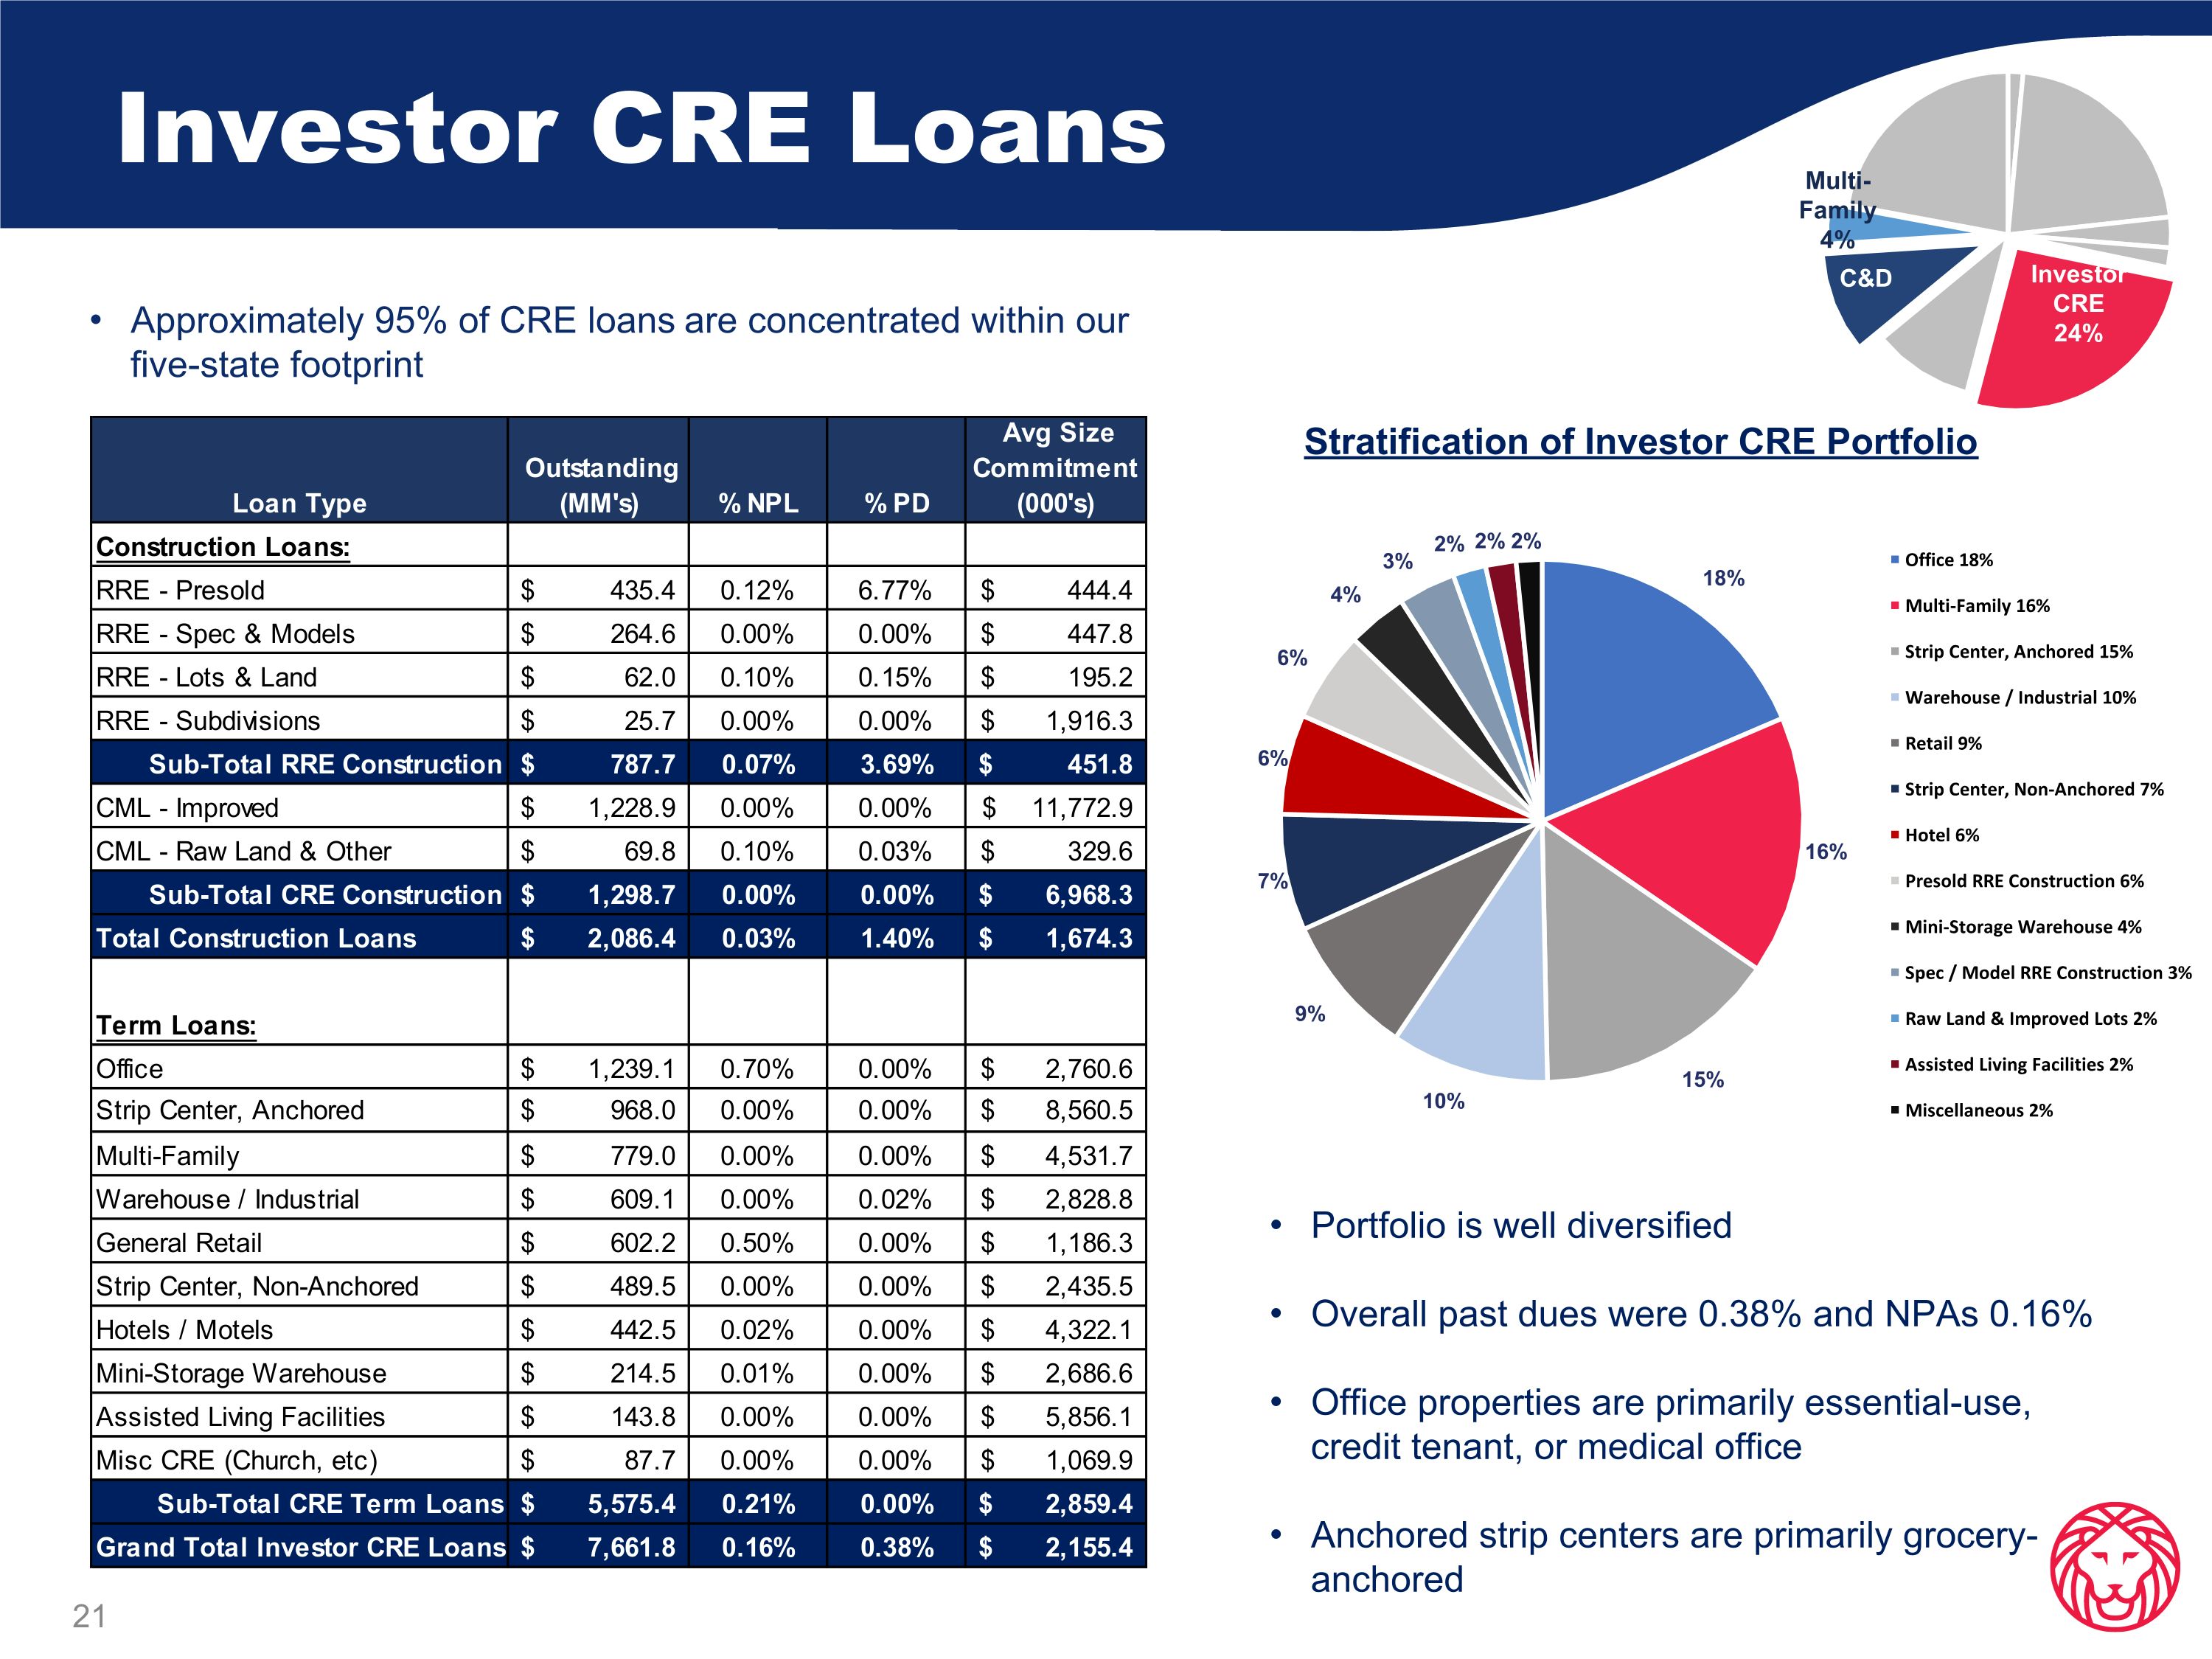
Investor CRE Loans Approximately 95% of CRE loans are concentrated within our five-state footprint Stratification of Investor CRE Portfolio Portfolio is well diversified Overall past dues were 0.38% and NPAs 0.16% Office properties are primarily essential-use, credit tenant, or medical office Anchored strip centers are primarily grocery-anchored
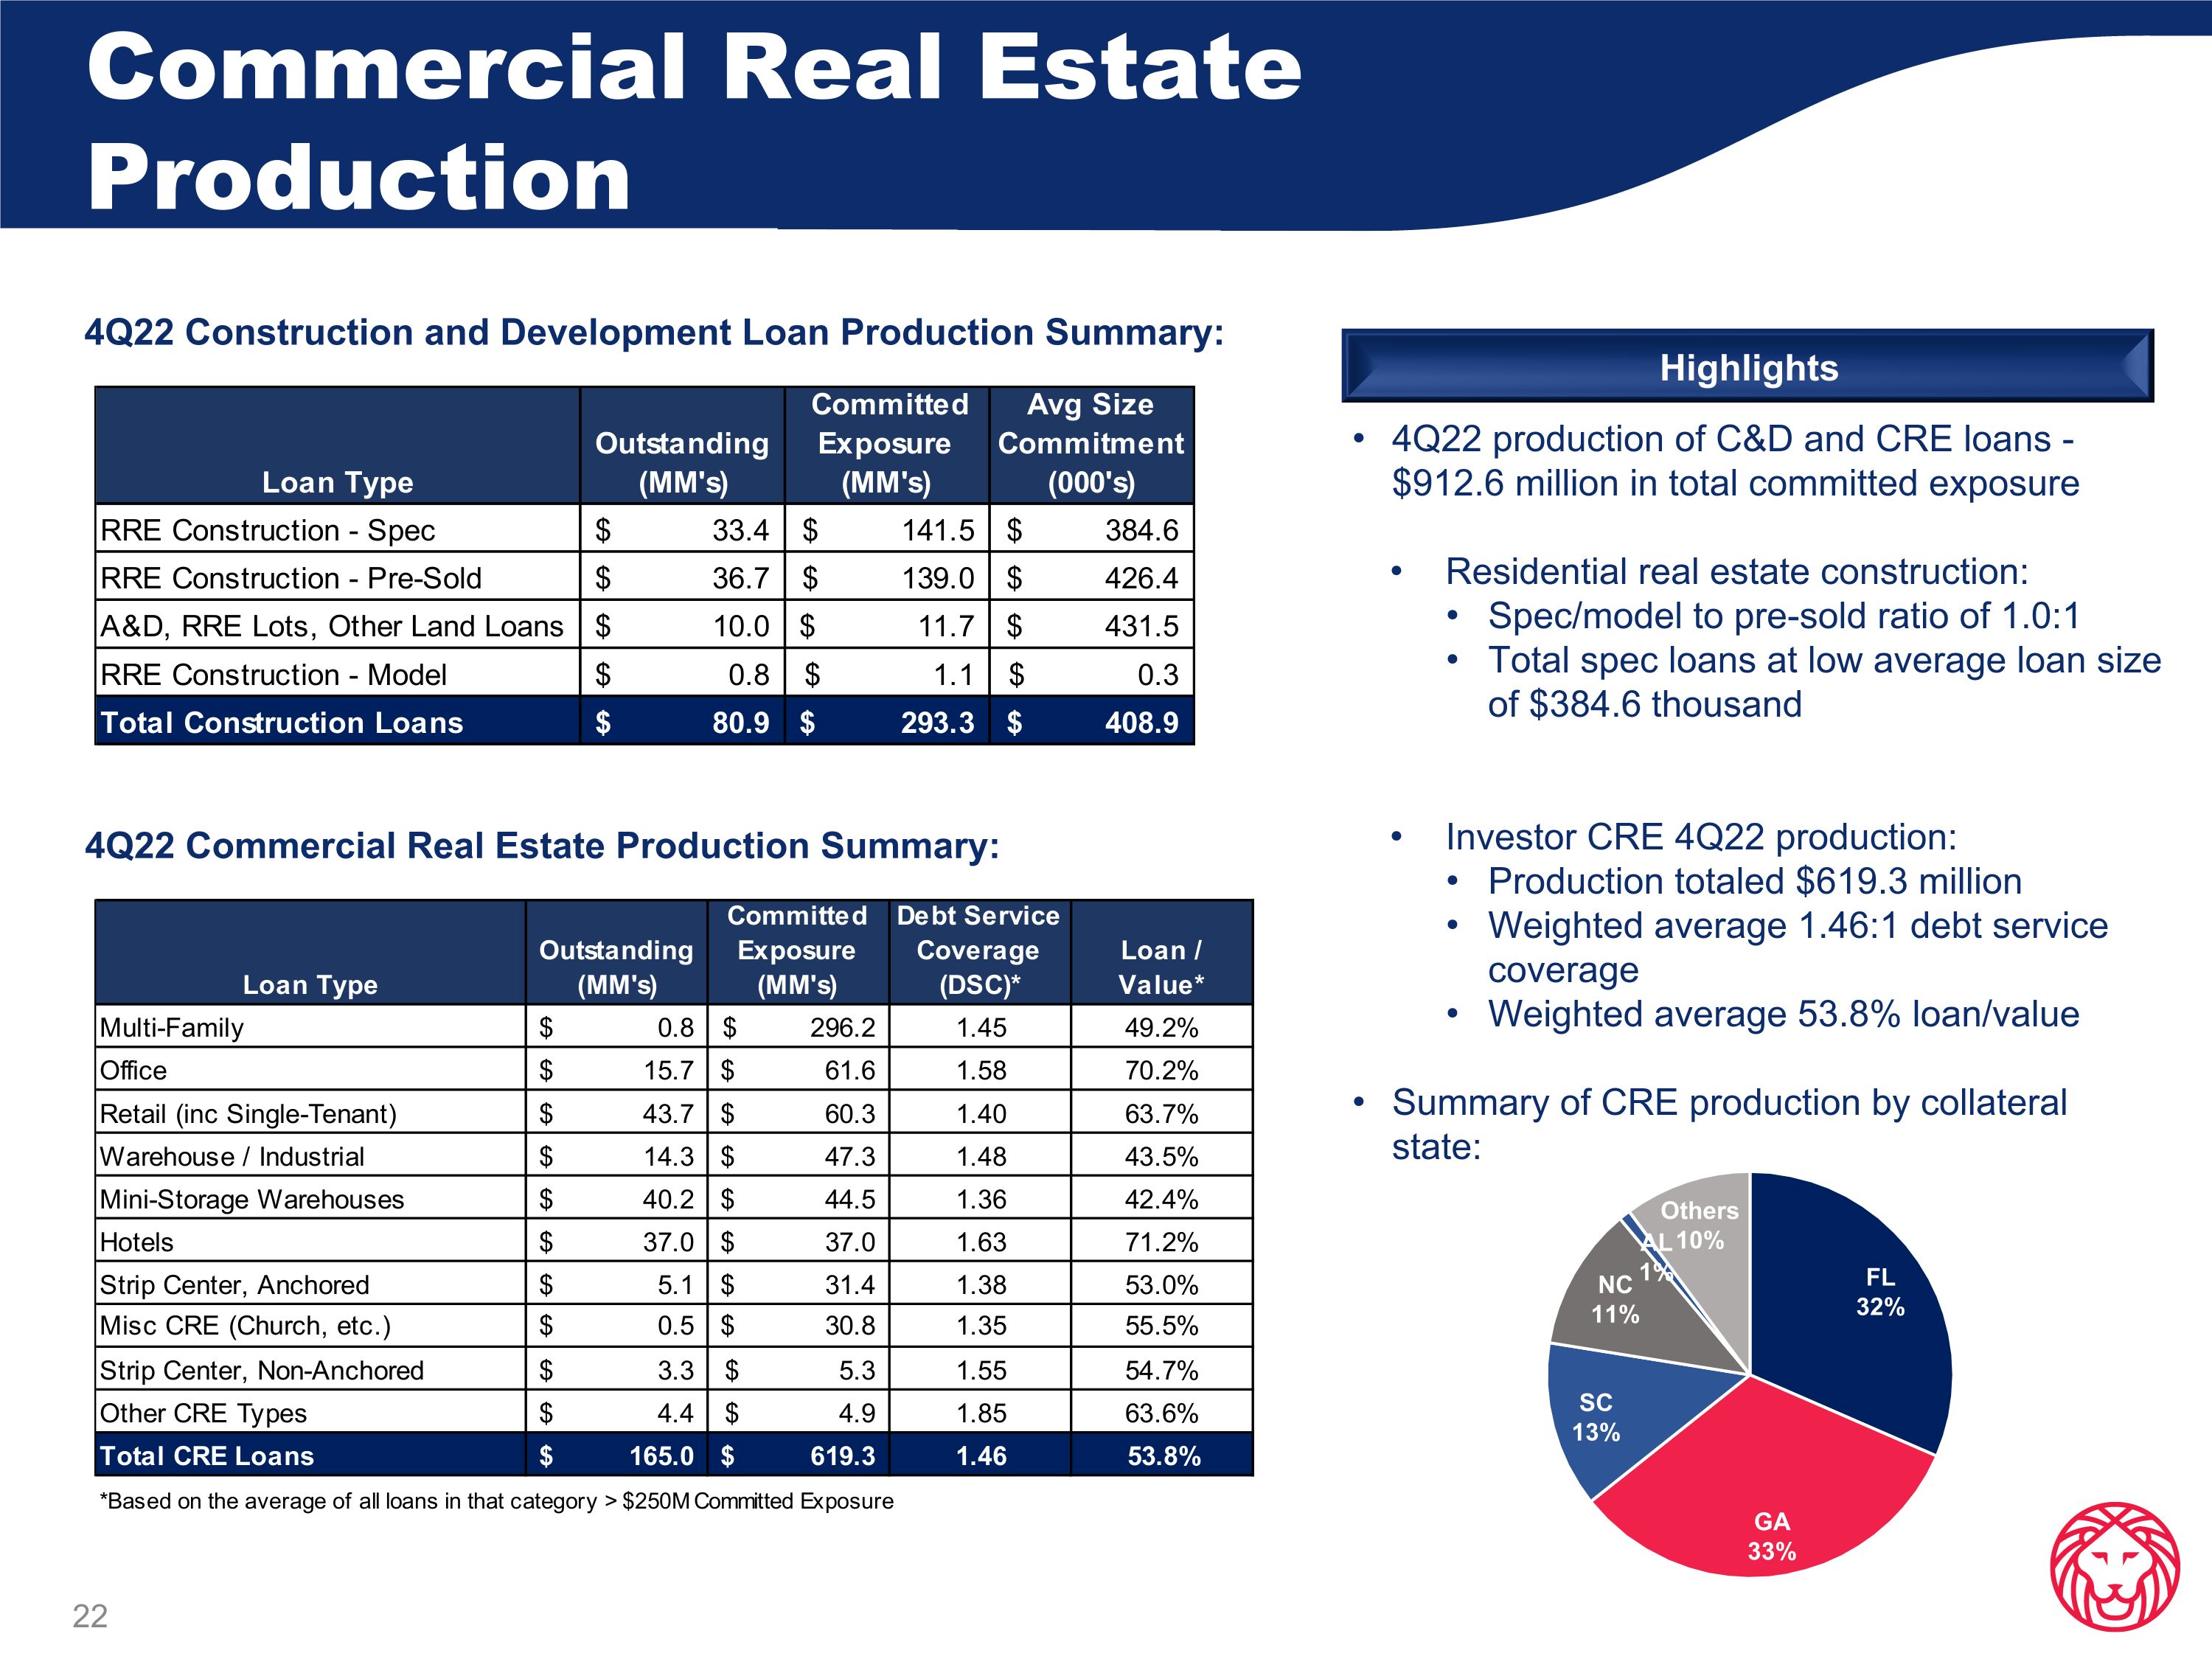
Commercial Real Estate Production 4Q22 Commercial Real Estate Production Summary: 4Q22 Construction and Development Loan Production Summary: 4Q22 production of C&D and CRE loans - $912.6 million in total committed exposure Residential real estate construction: Spec/model to pre-sold ratio of 1.0:1 Total spec loans at low average loan size of $384.6 thousand Investor CRE 4Q22 production: Production totaled $619.3 million Weighted average 1.46:1 debt service coverage Weighted average 53.8% loan/value Summary of CRE production by collateral state: Highlights
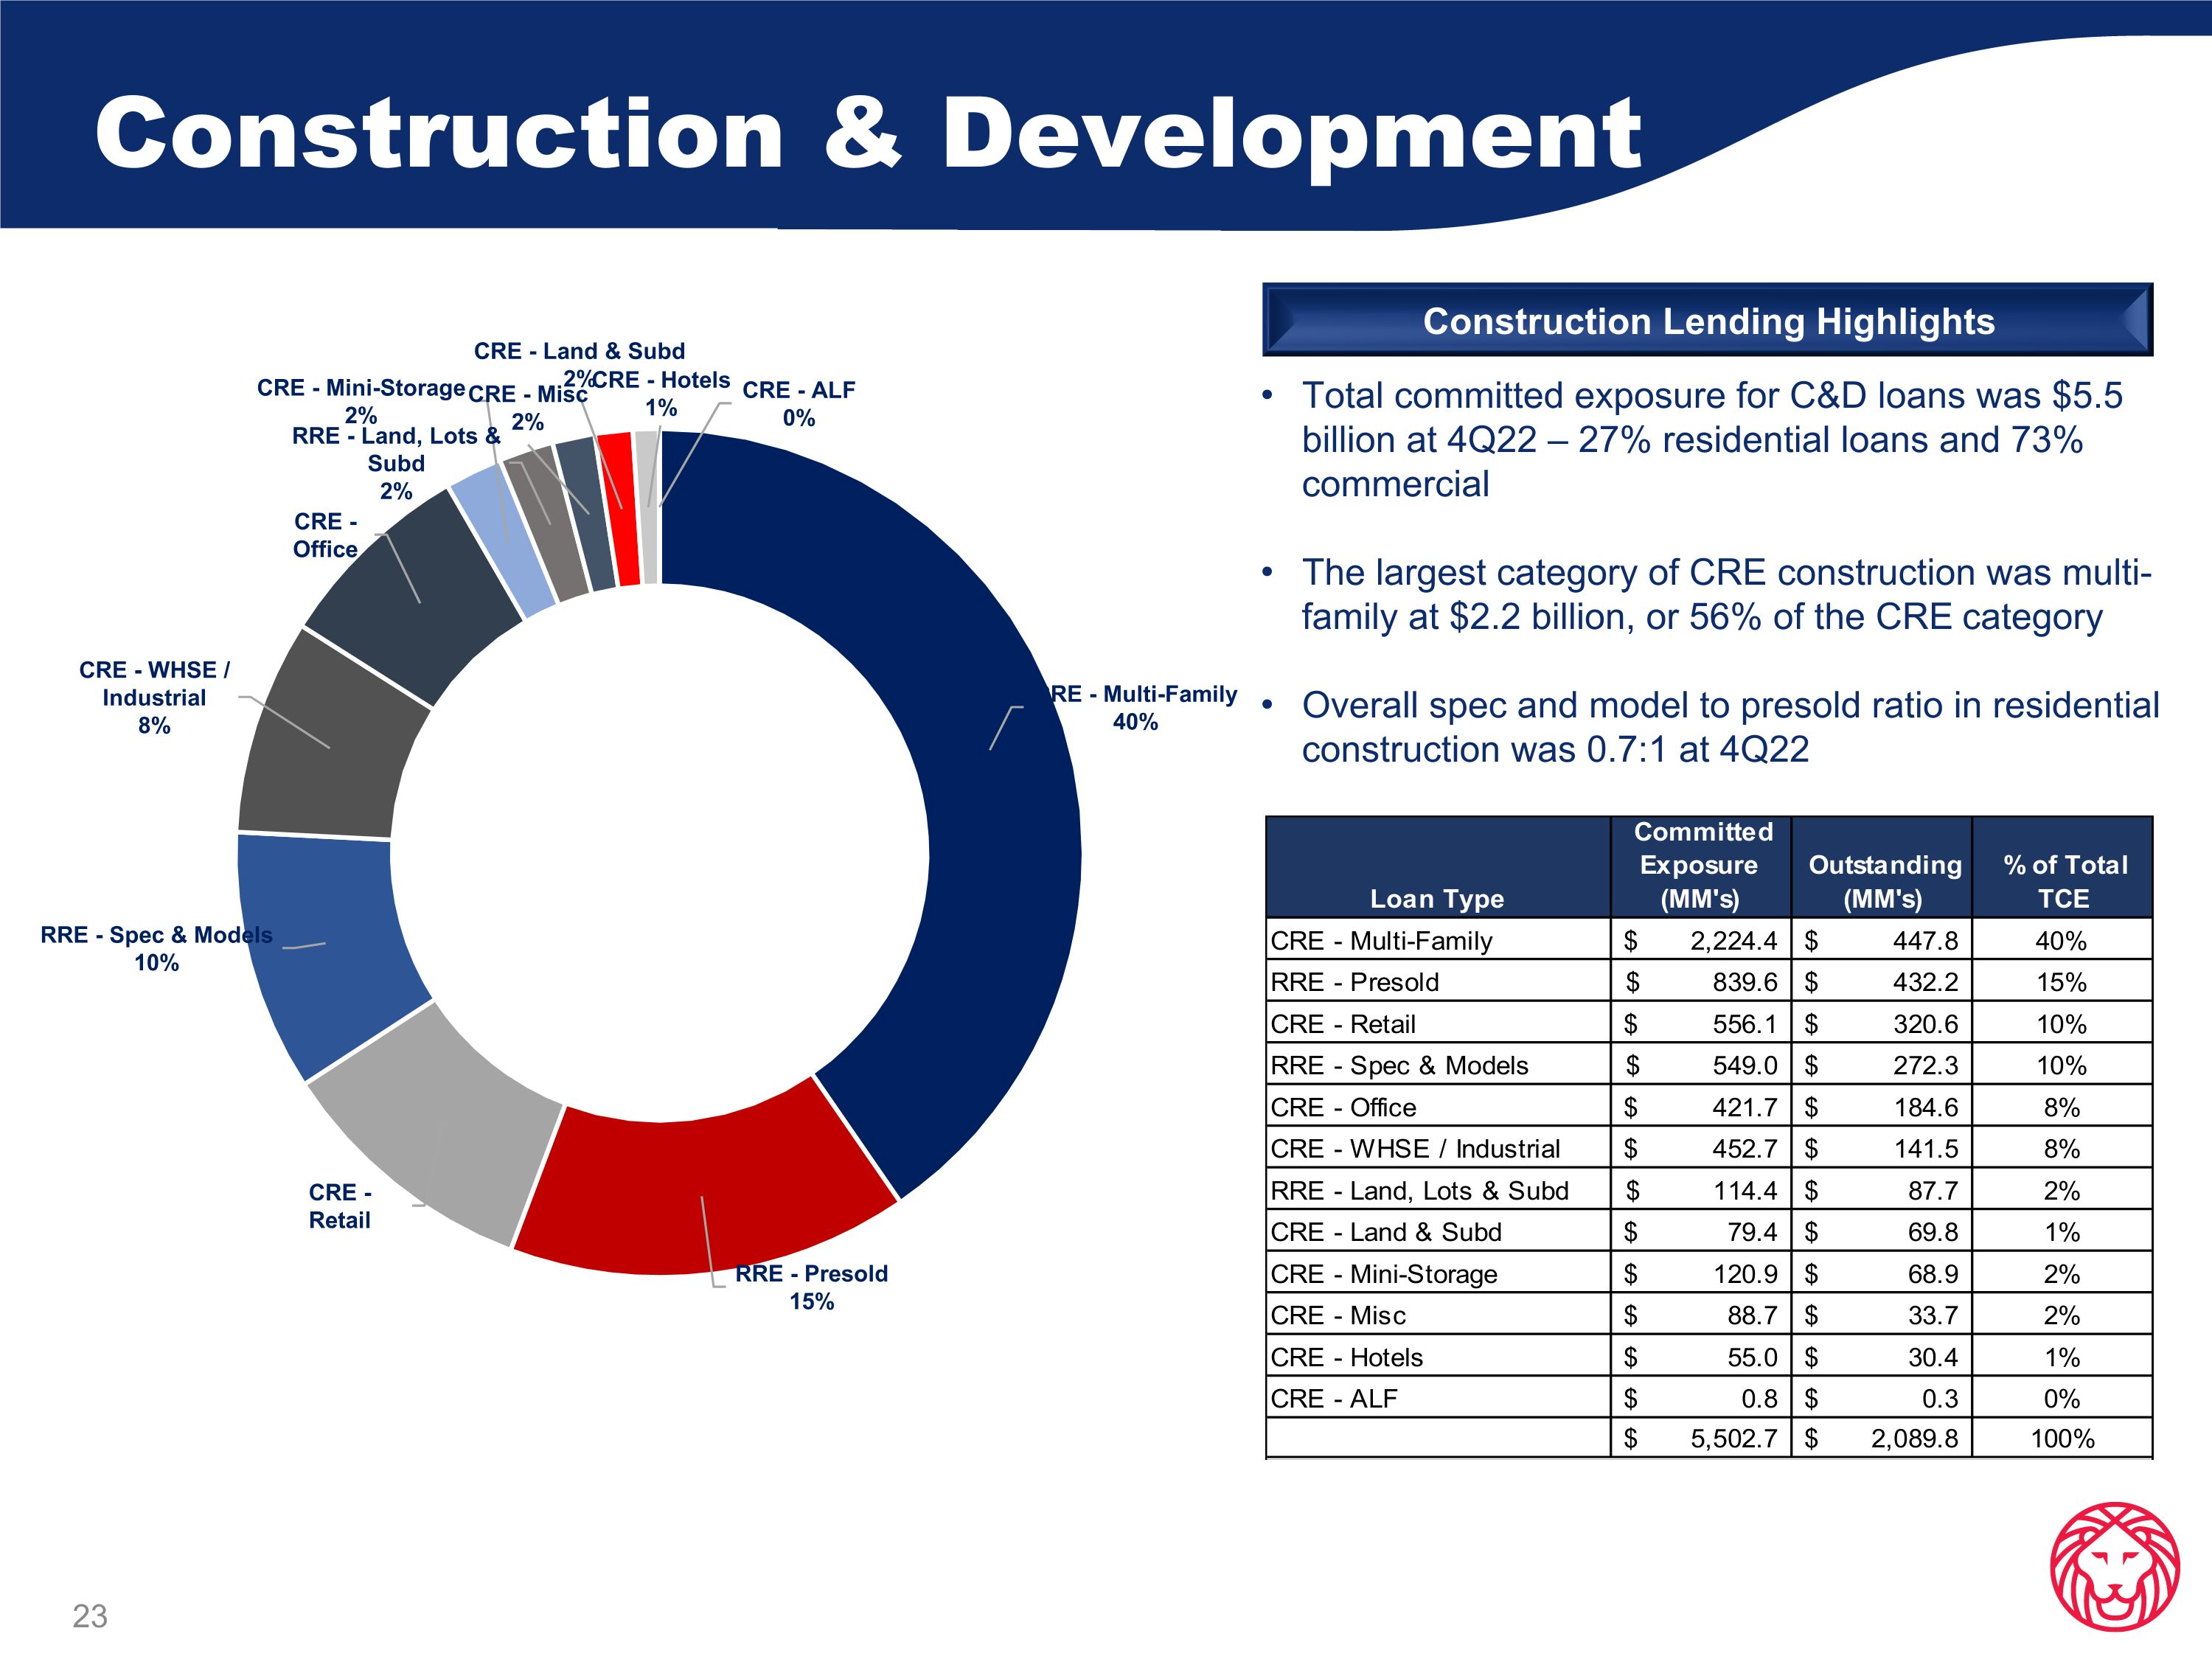
Construction & Development Total committed exposure for C&D loans was $5.5 billion at 4Q22 – 27% residential loans and 73% commercial The largest category of CRE construction was multi-family at $2.2 billion, or 56% of the CRE category Overall spec and model to presold ratio in residential construction was 0.7:1 at 4Q22 Construction Lending Highlights
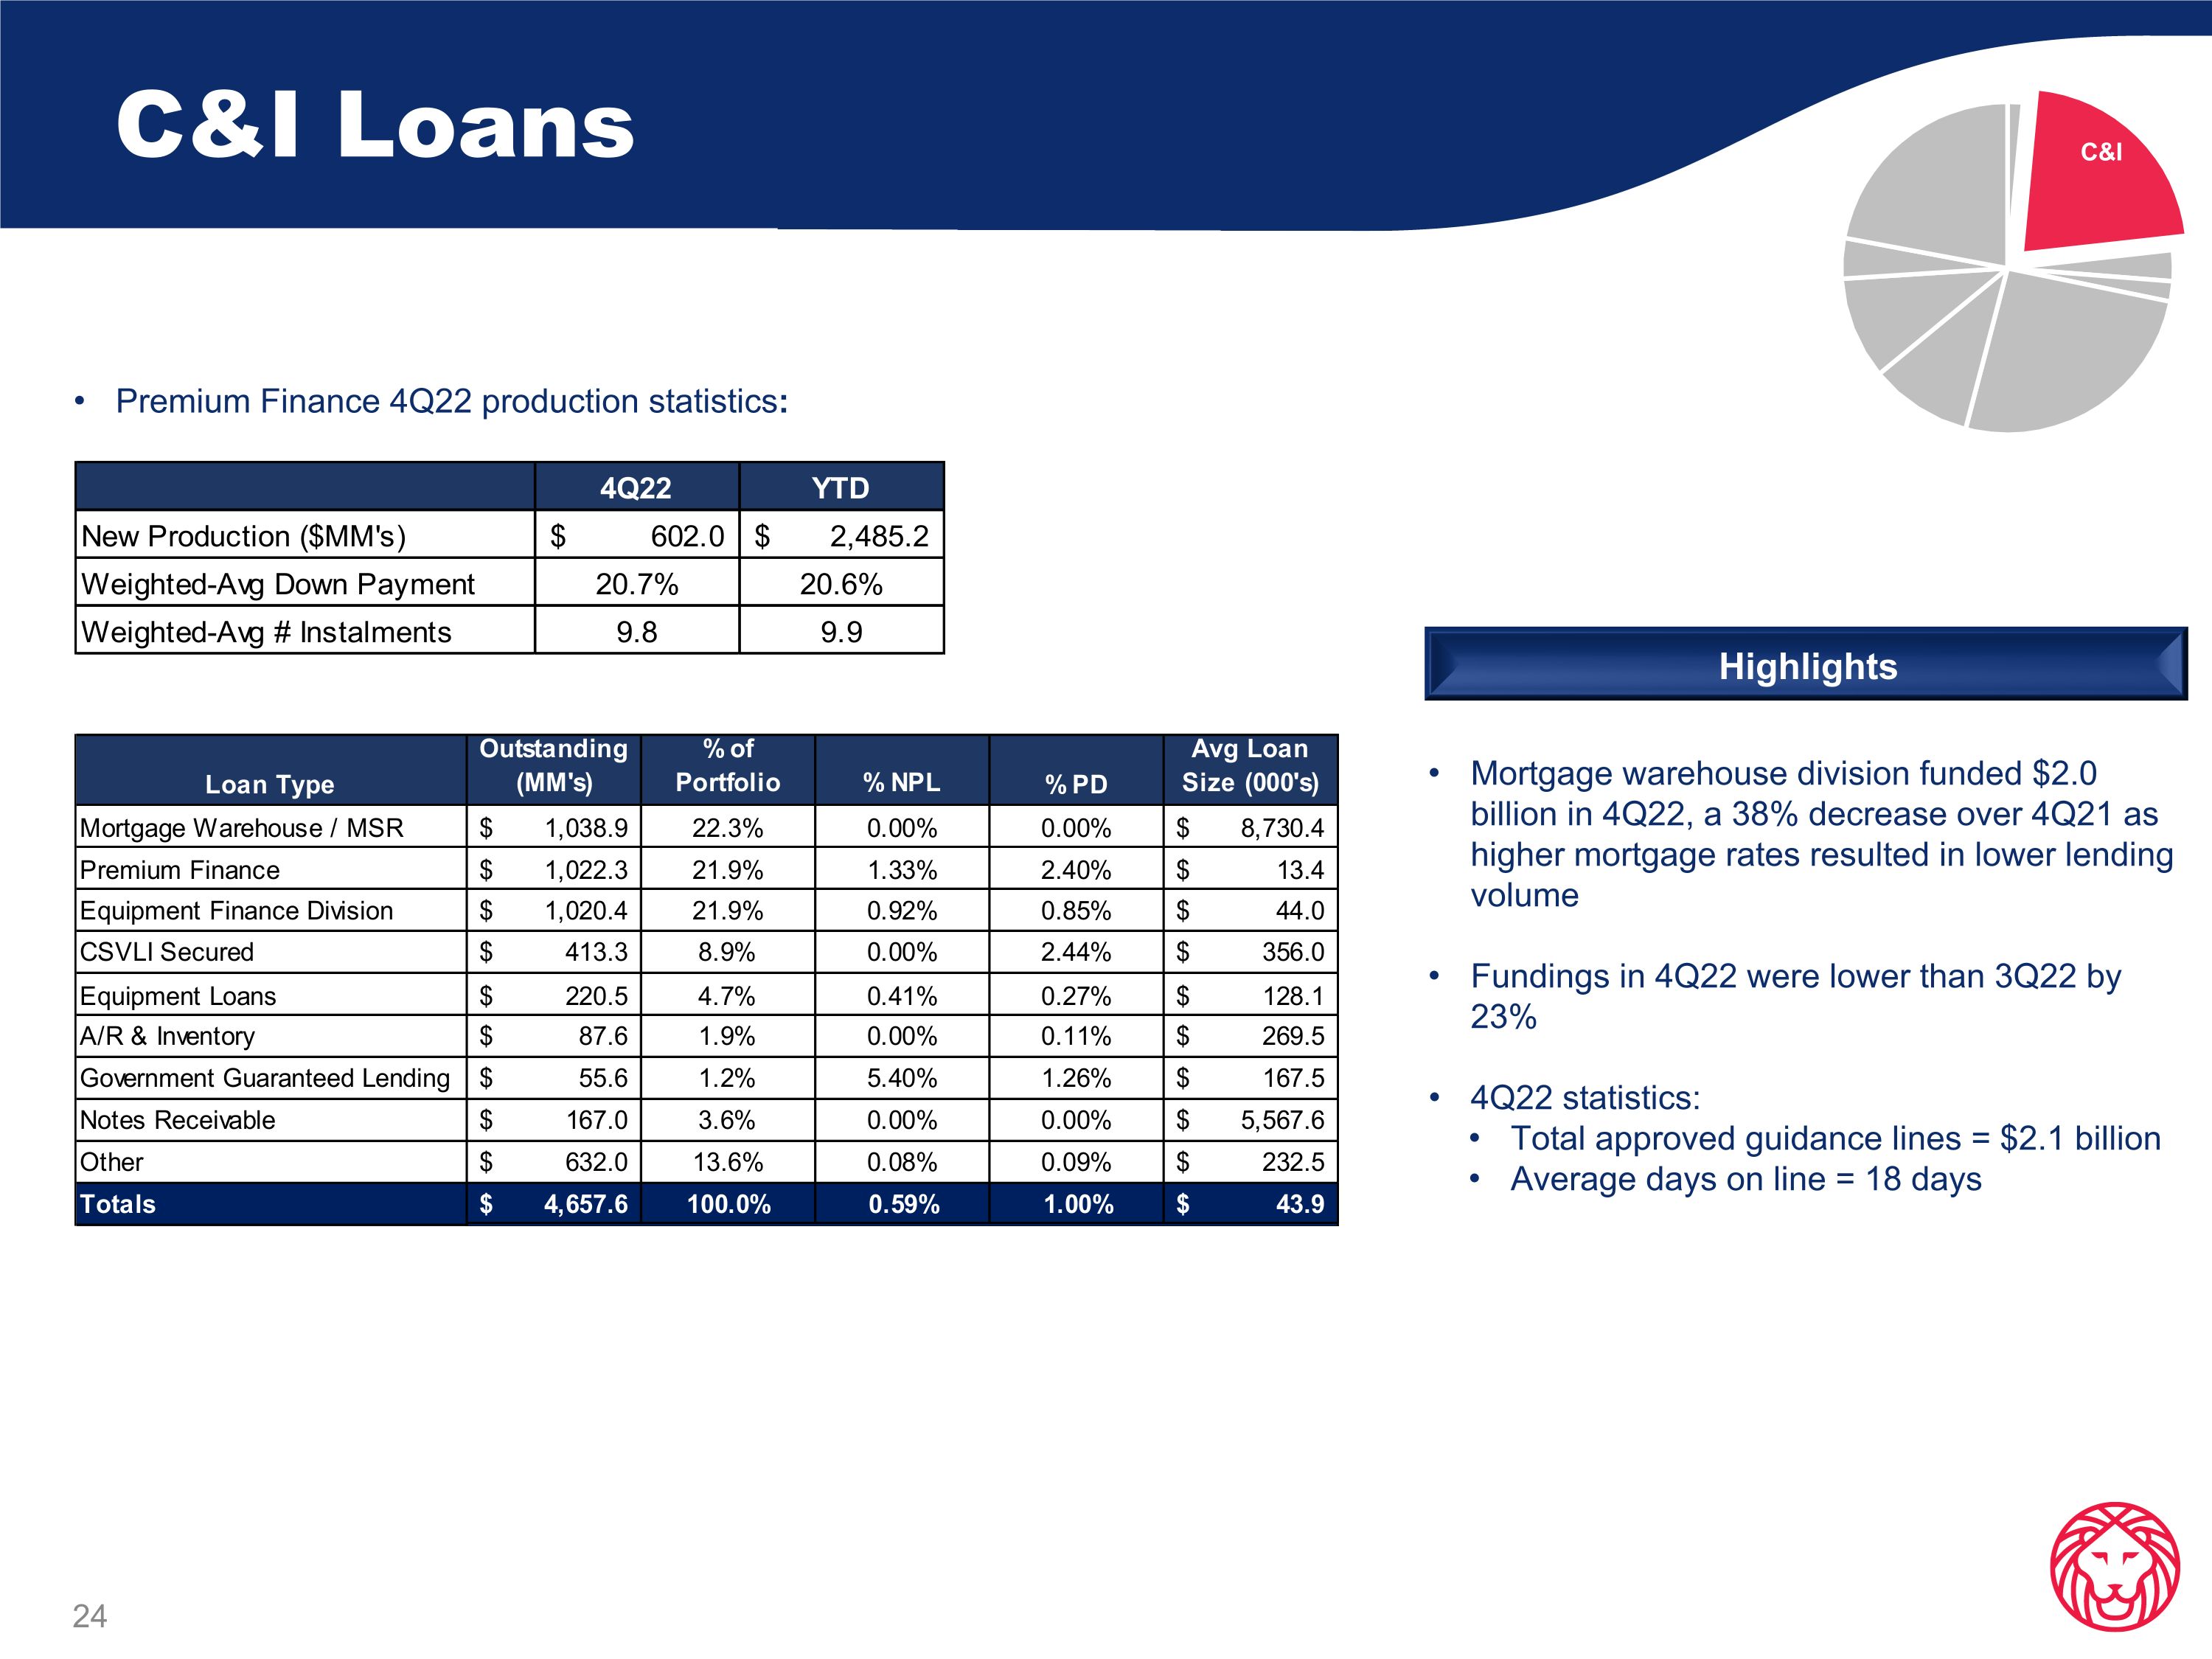
C&I Loans Premium Finance 4Q22 production statistics: Mortgage warehouse division funded $2.0 billion in 4Q22, a 38% decrease over 4Q21 as higher mortgage rates resulted in lower lending volume Fundings in 4Q22 were lower than 3Q22 by 23% 4Q22 statistics: Total approved guidance lines = $2.1 billion Average days on line = 18 days Highlights
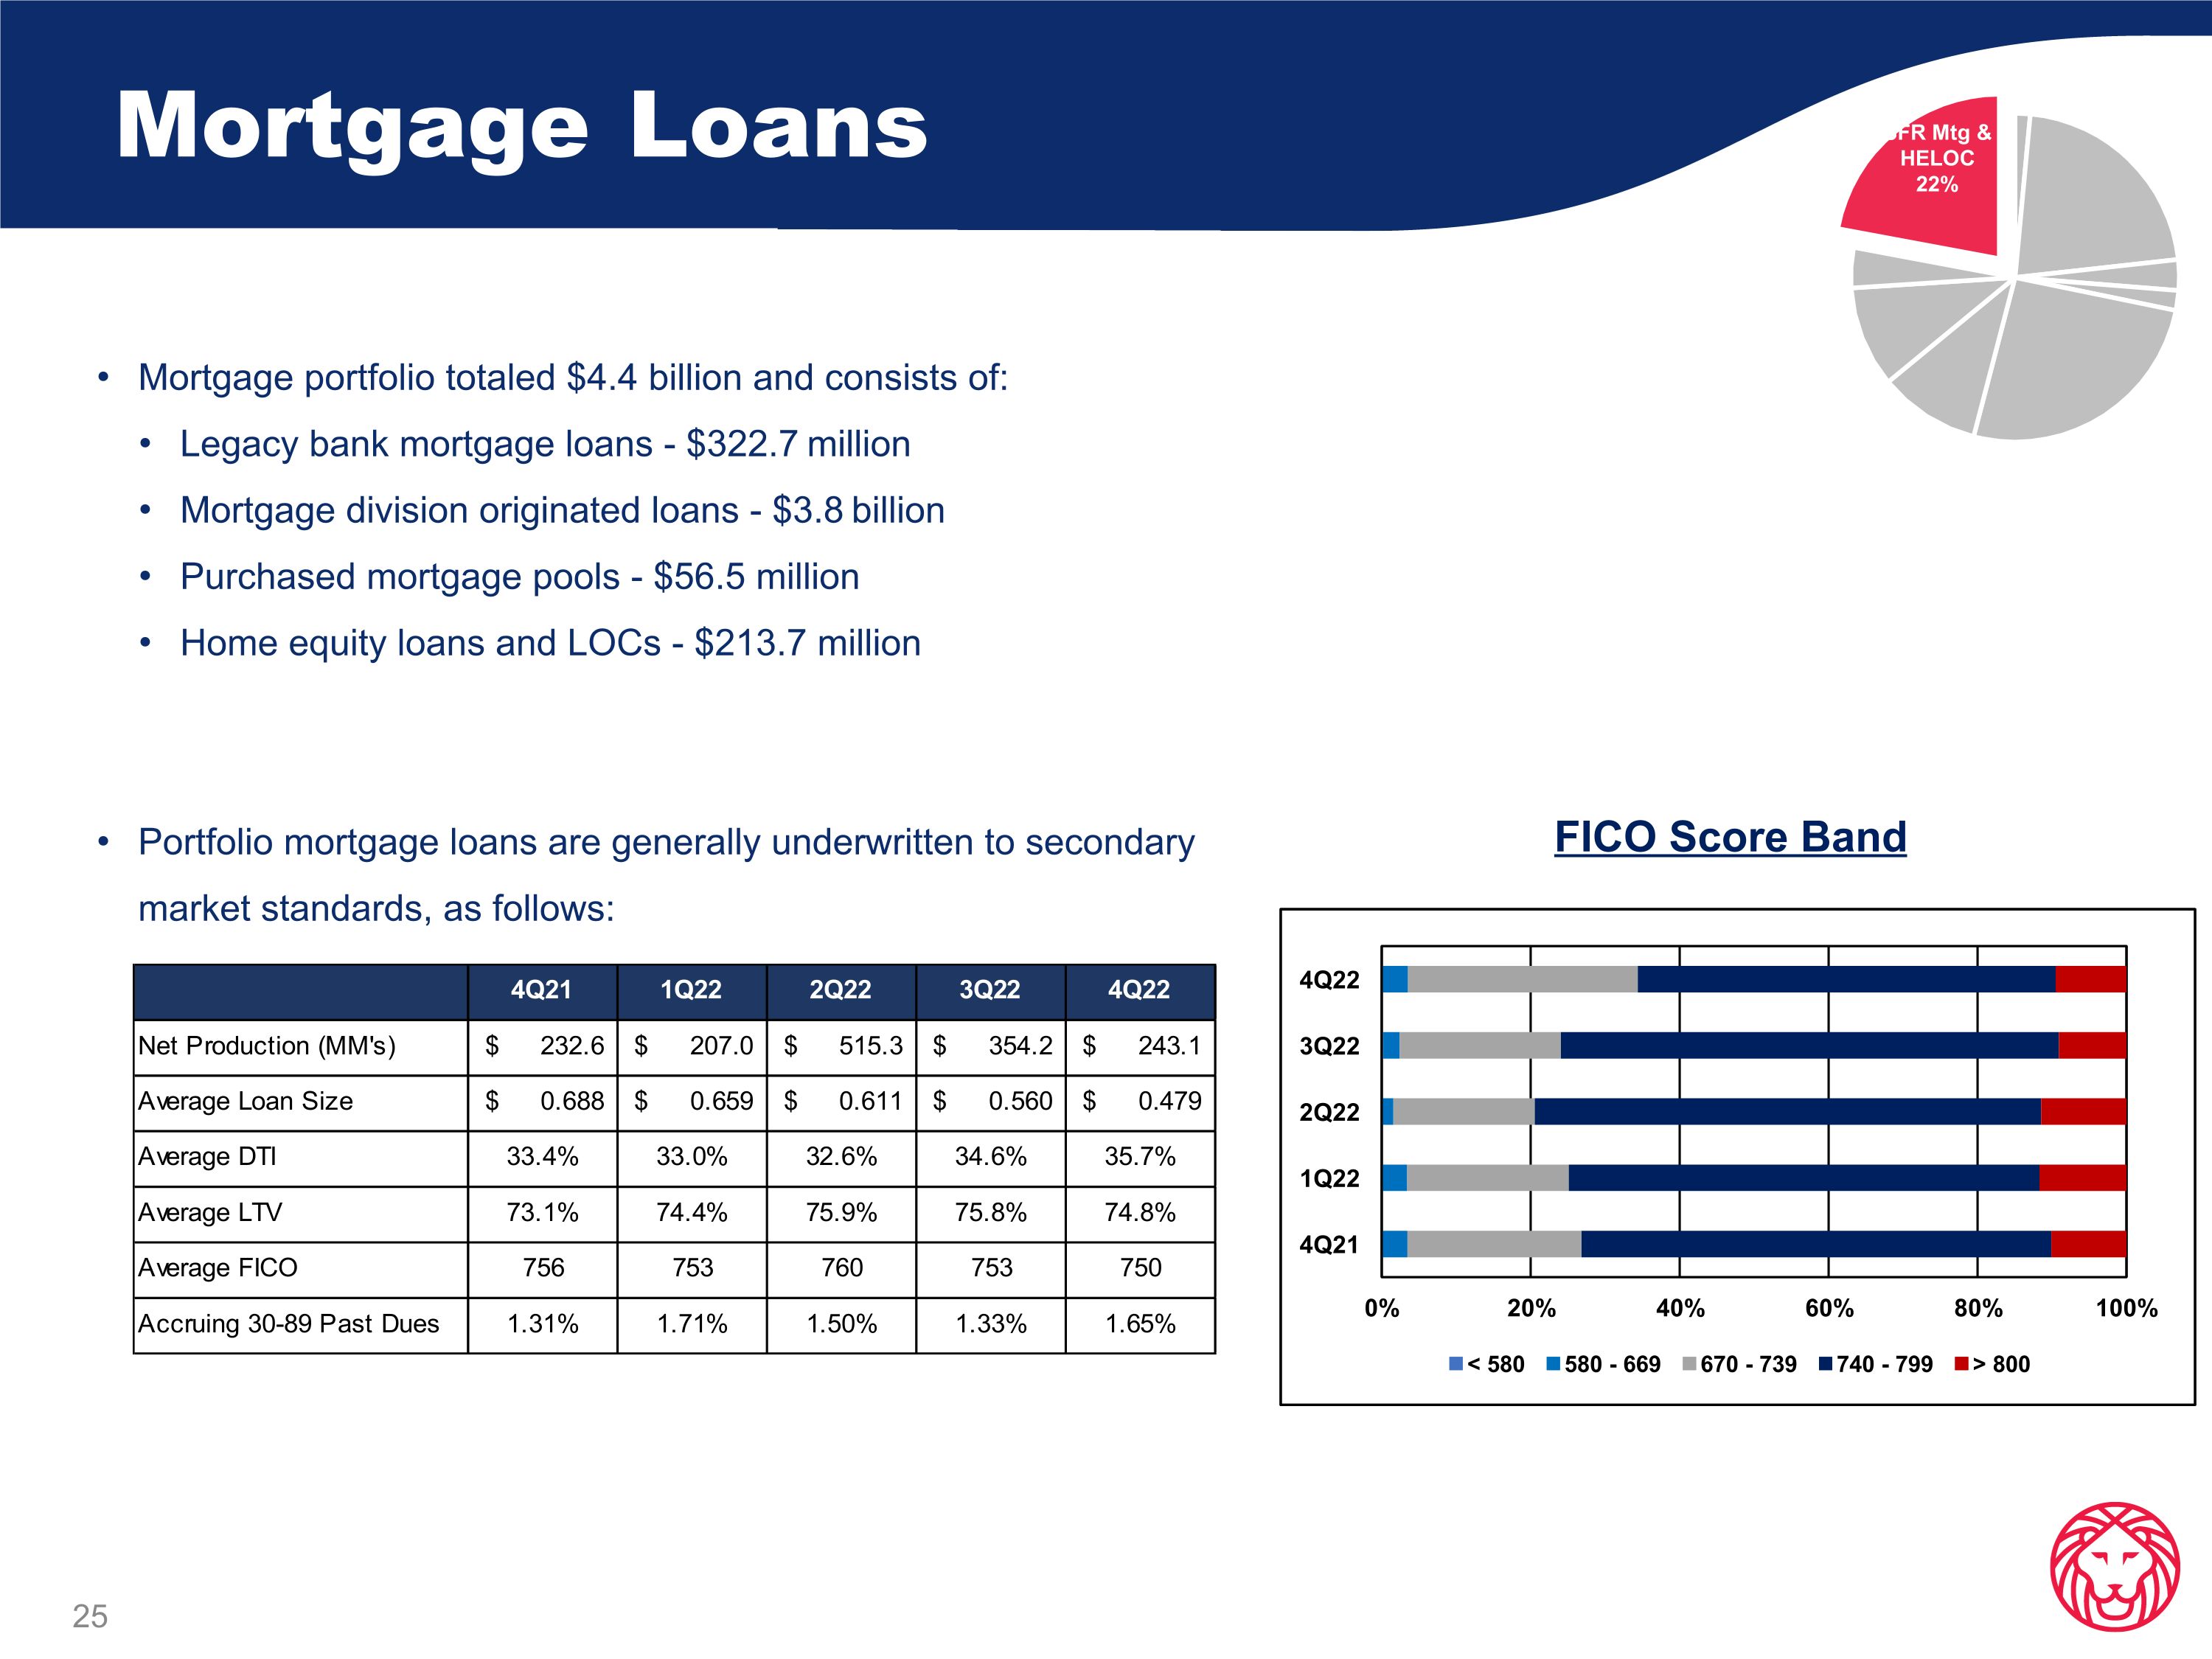
Mortgage Loans Mortgage portfolio totaled $4.4 billion and consists of: Legacy bank mortgage loans - $322.7 million Mortgage division originated loans - $3.8 billion Purchased mortgage pools - $56.5 million Home equity loans and LOCs - $213.7 million Portfolio mortgage loans are generally underwritten to secondary market standards, as follows: FICO Score Band

Appendix
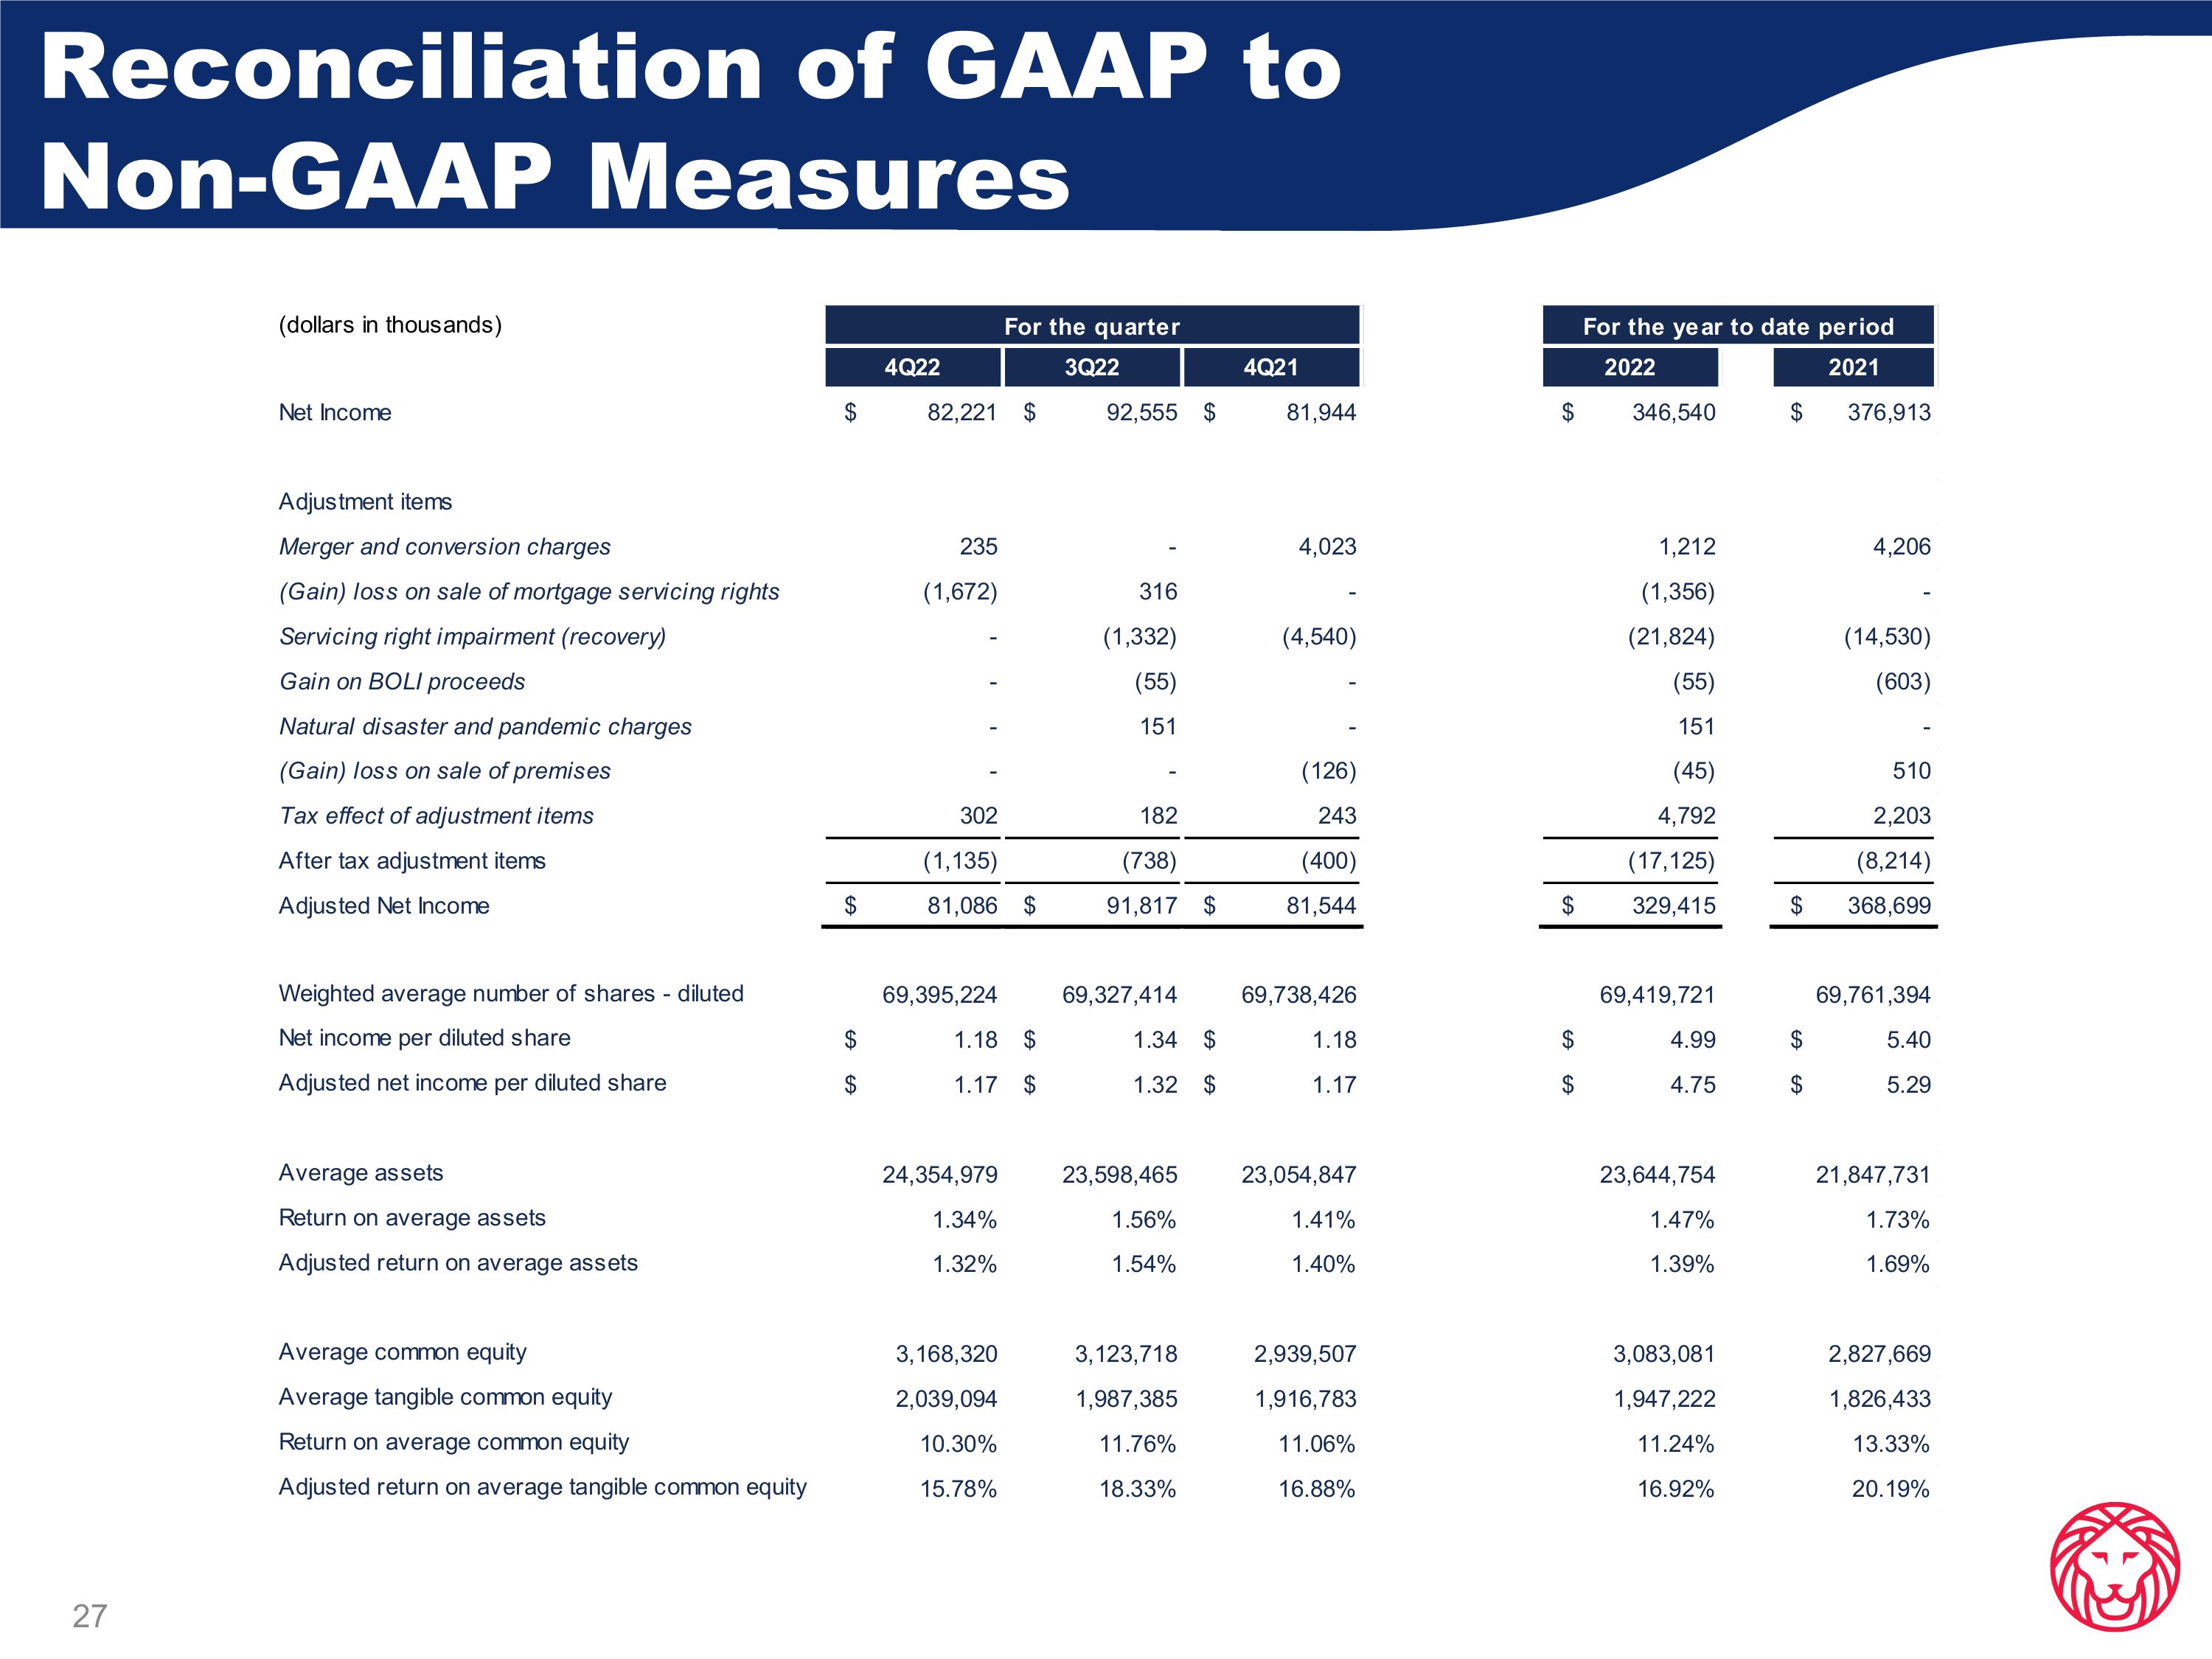
Reconciliation of GAAP to Non-GAAP Measures
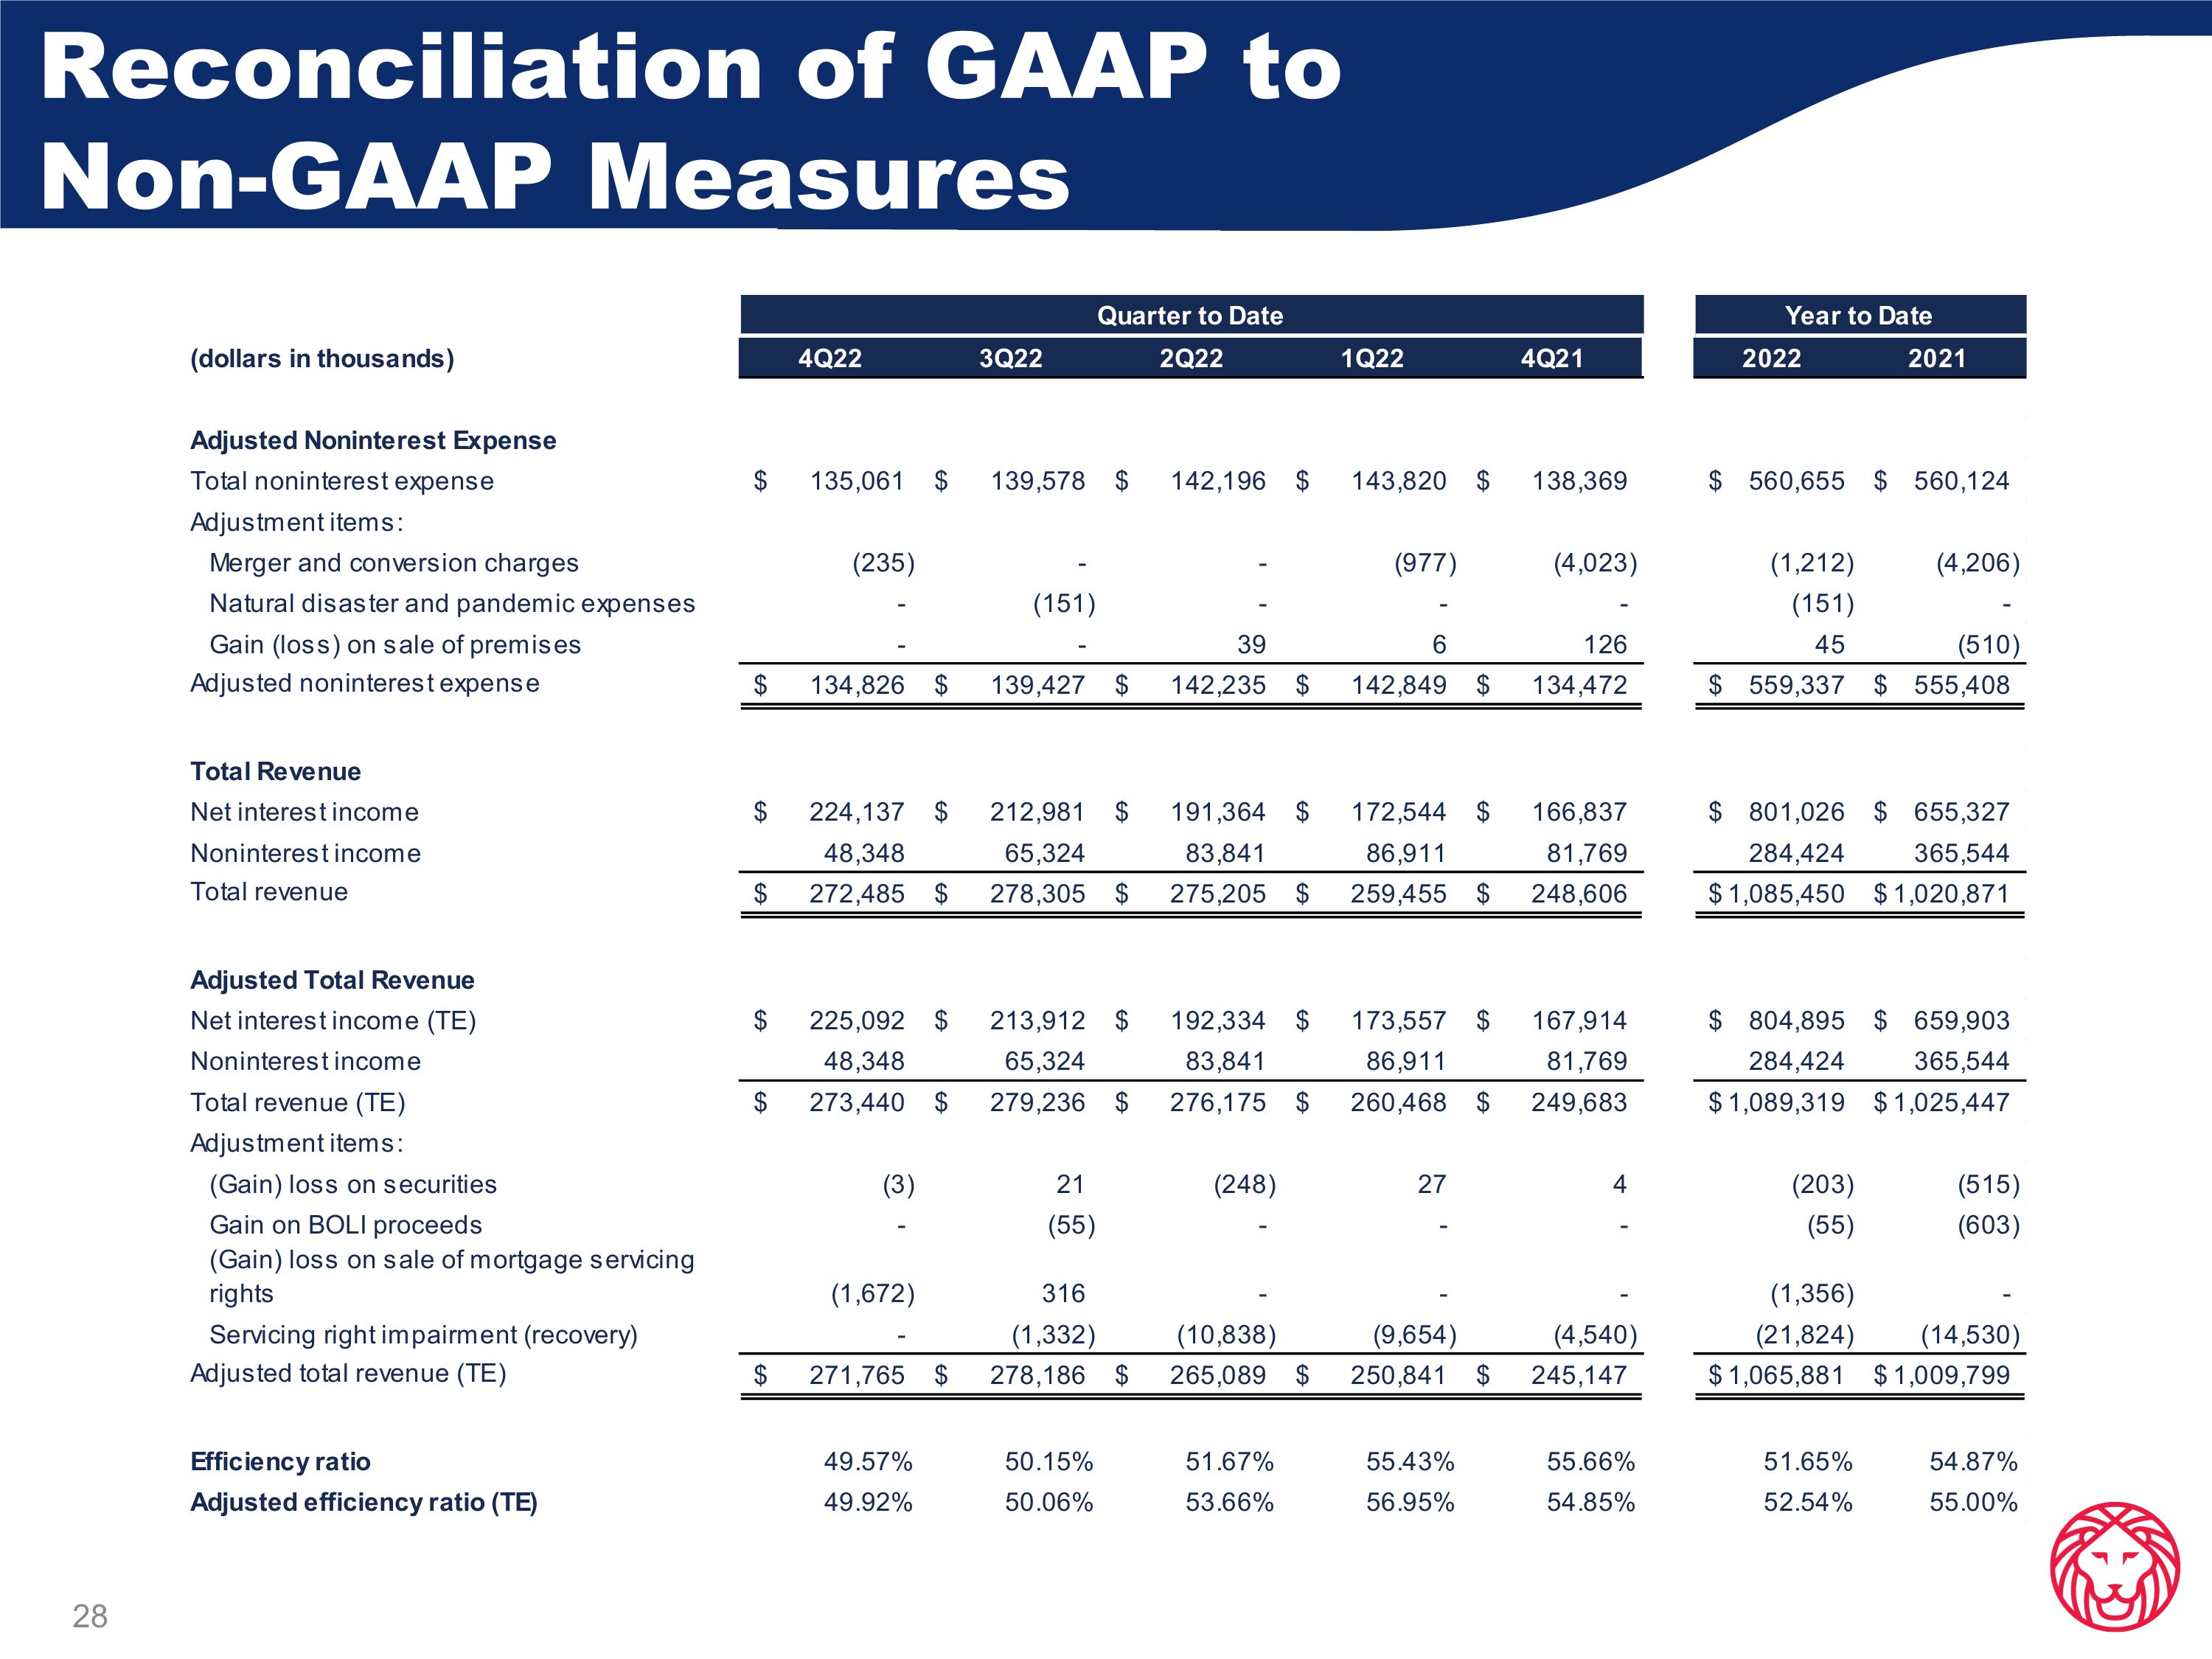
Reconciliation of GAAP to Non-GAAP Measures
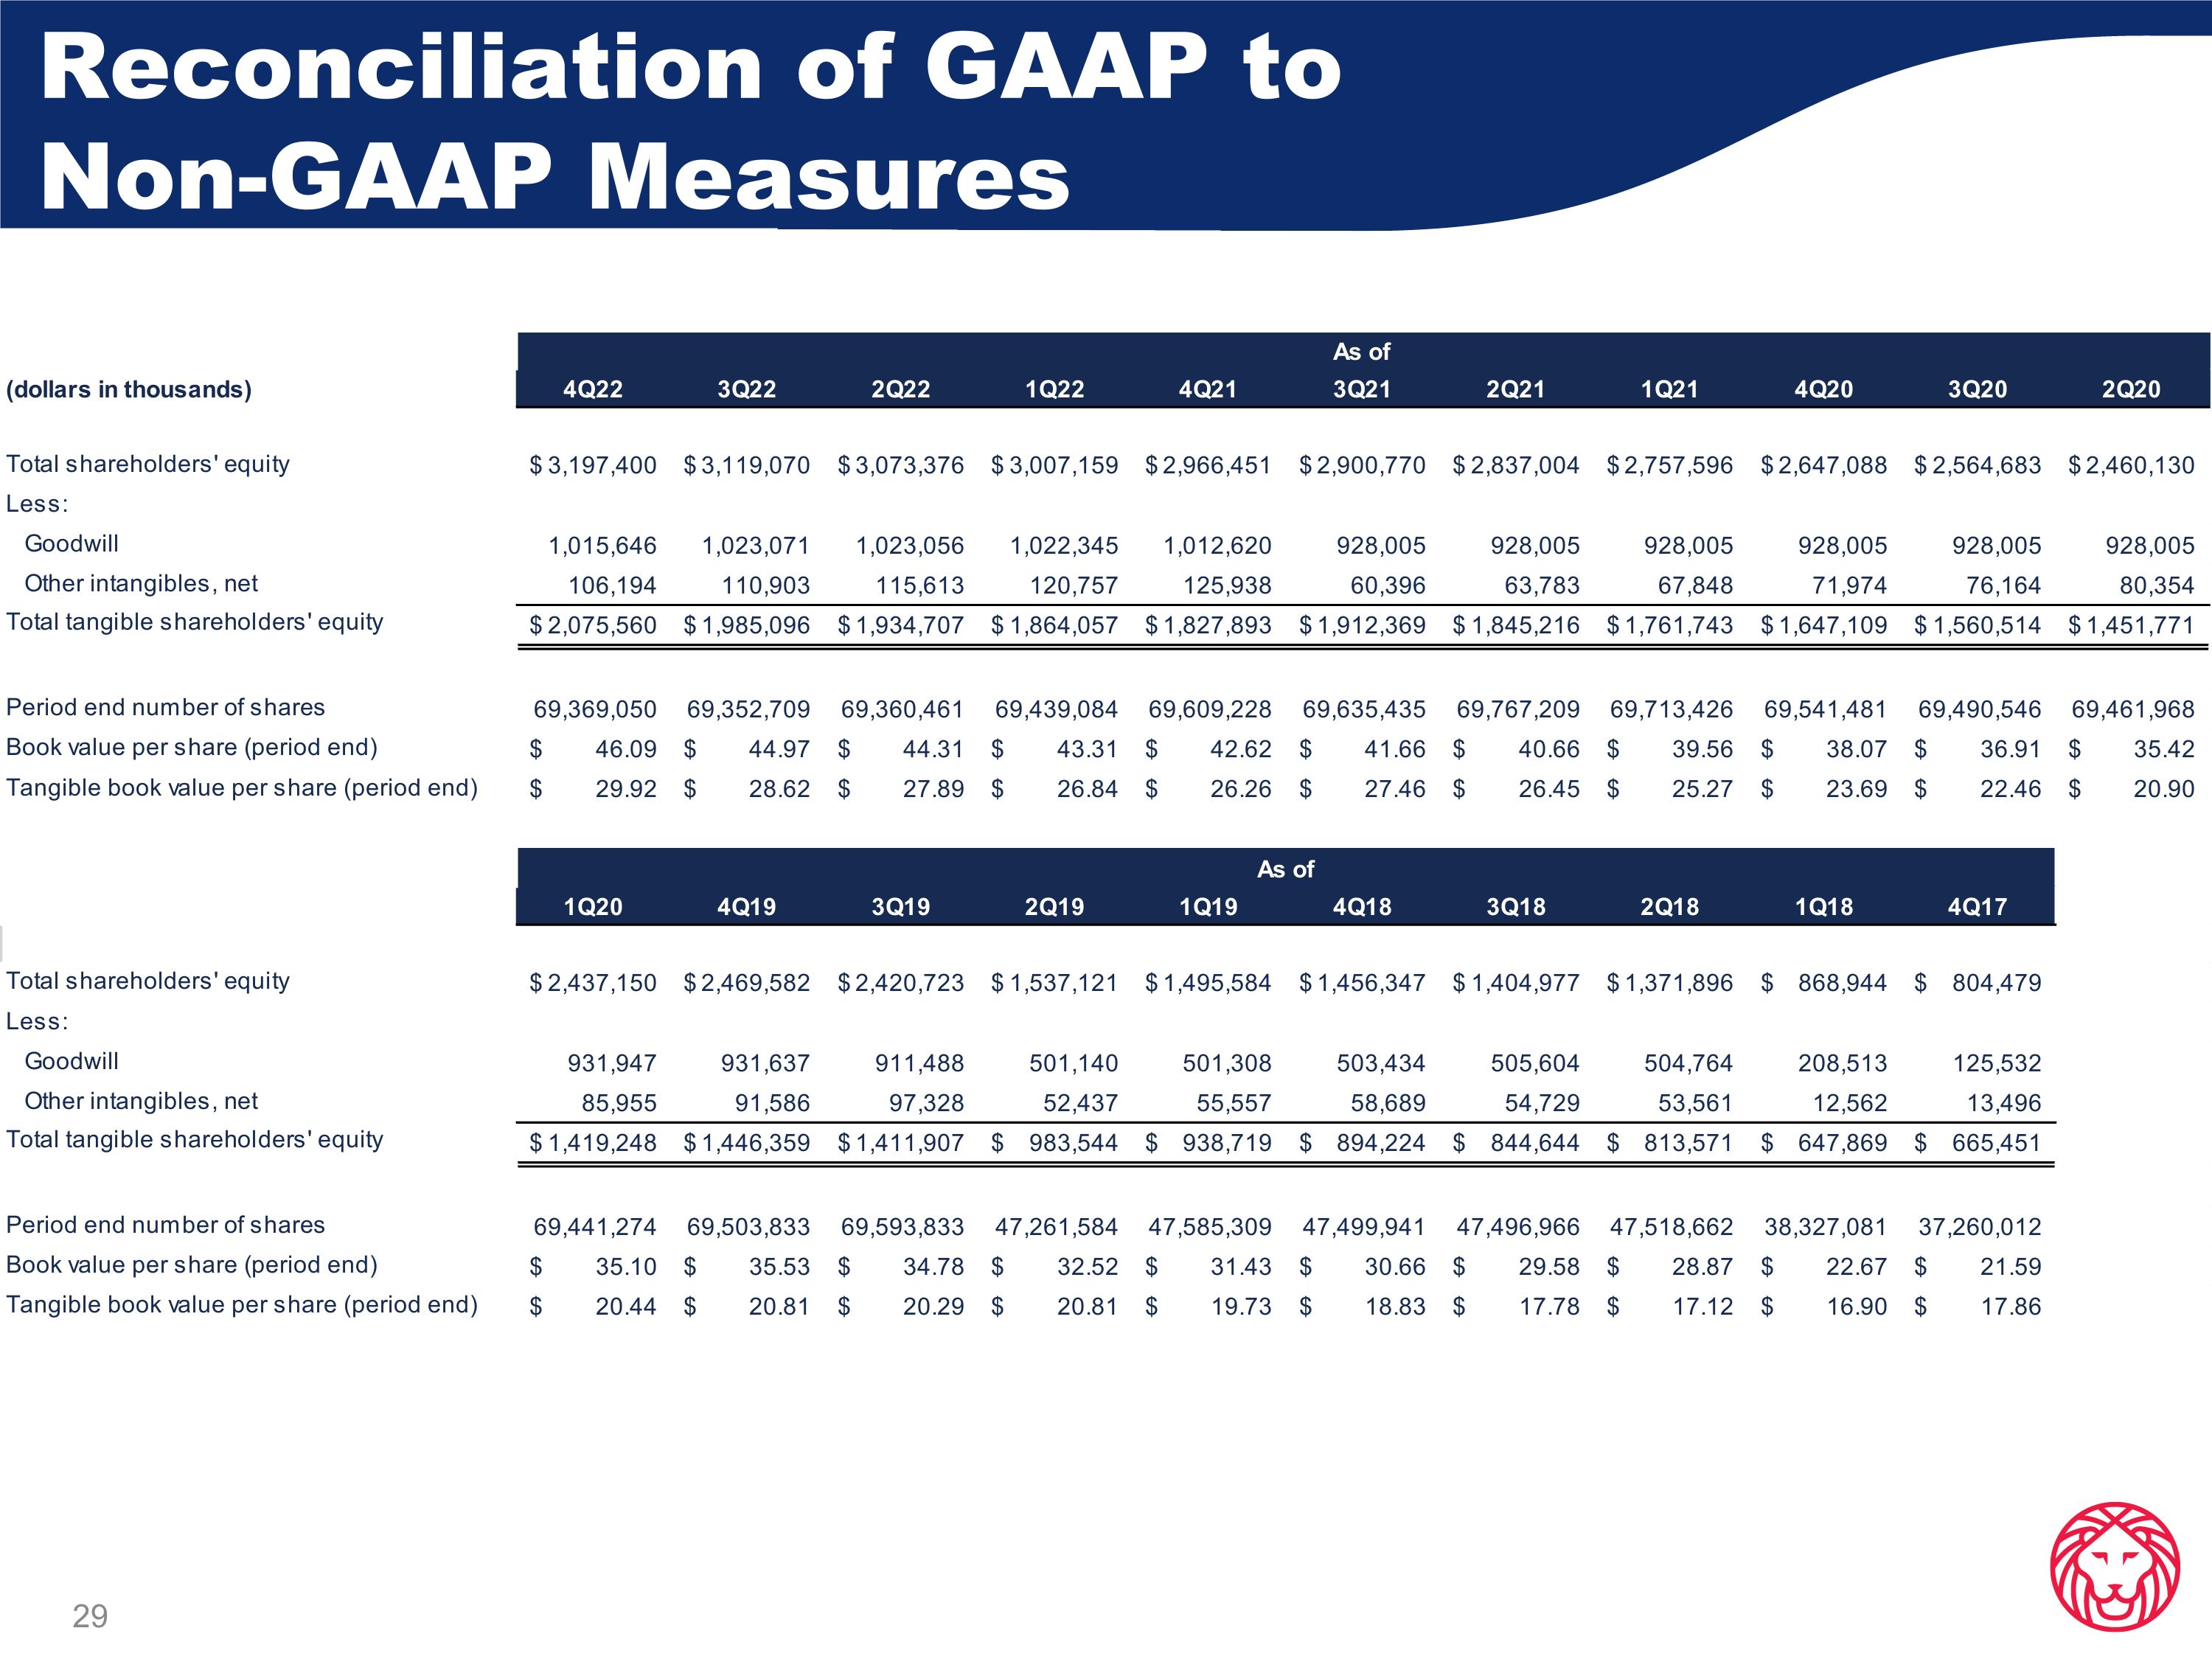
Reconciliation of GAAP to Non-GAAP Measures
Ameris Bancorp Press Release & Financial Highlights December 31, 2022