| 4Q22 Earnings Conference Call January 27, 2023 |

| Safe Harbor Statement 2 “Safe Harbor” Statement under the Private Securities Litigation Reform Act of 1995 : Statements in this Presentation relating to plans, strategies, economic performance and trends, projections of results of specific activities or investments and other statements that are not descriptions of historical facts may be forward - looking statements within the meaning of the Private Securities Litigation Reform Act of 1995 , Section 27 A of the Securities Act of 1933 and Section 21 E of the Securities Exchange Act of 1934 .. Forward - looking information is inherently subject to risks and uncertainties, and actual results could differ materially from those currently anticipated due to a number of factors, which include, but are not limited to, risk factors discussed in the Company’s Annual Report on Form 10 - K for the fiscal year ended December 31 , 2021 and in other documents filed by the Company with the Securities and Exchange Commission from time to time .. Forward - looking statements may be identified by terms such as “may”, “will”, “should”, “could”, “expects”, “plans”, “intends”, “anticipates”, “believes”, “estimates”, “predicts”, “forecasts”, “goals”, “potential” or “continue” or similar terms or the negative of these terms .. Although we believe that the expectations reflected in the forward - looking statements are reasonable, we cannot guarantee future results, levels of activity, performance or achievements .. The Company has no obligation to update these forward - looking statements .. |
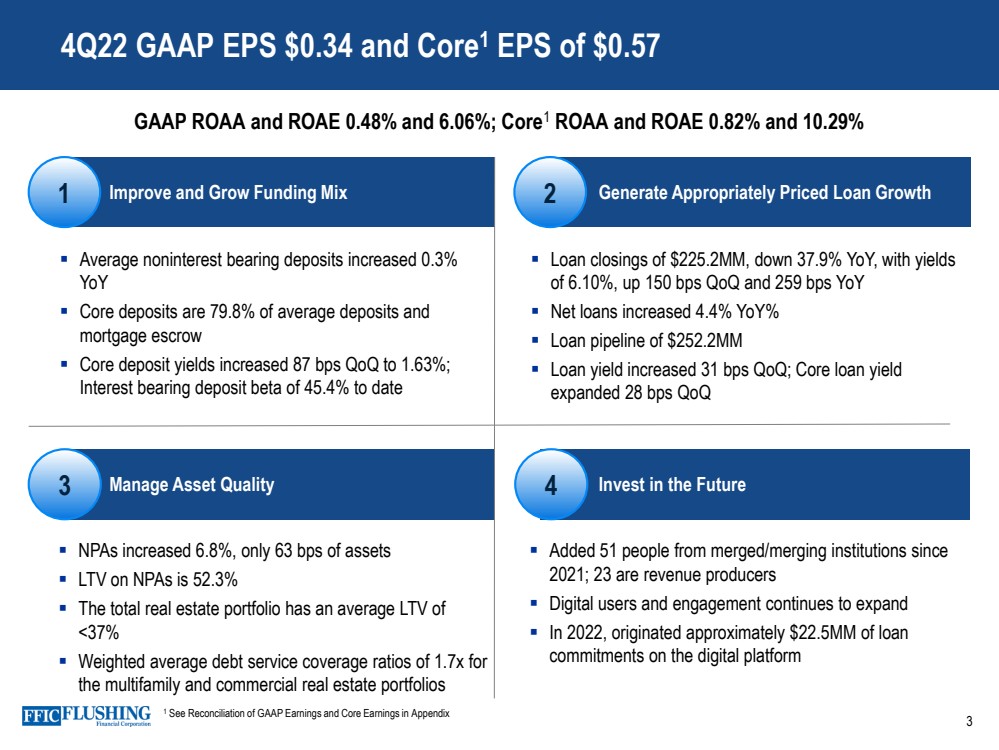
| 3 4 1 2 Improve and Grow Funding Mix Generate Appropriately Priced Loan Growth Average noninterest bearing deposits increased 0.3% YoY Core deposits are 79.8% of average deposits and mortgage escrow Core deposit yields increased 87 bps QoQ to 1.63%; Interest bearing deposit beta of 45.4% to date Loan closings of $225.2MM, down 37.9% YoY, with yields of 6.10%, up 150 bps QoQ and 259 bps YoY Net loans increased 4.4 % YoY% Loan pipeline of $252.2MM Loan yield increased 31 bps QoQ; Core loan yield expanded 28 bps QoQ Manage Asset Quality Invest in the Future NPAs increased 6.8%, only 63 bps of assets LTV on NPAs is 52.3% The total real estate portfolio has an average LTV of <37% Weighted average debt service coverage ratios of 1.7x for the multifamily and commercial real estate portfolios Added 51 people from merged/merging institutions since 2021; 23 are revenue producers Digital users and engagement continues to expand In 2022, originated approximately $22.5MM of loan commitments on the digital platform 4Q22 GAAP EPS $0.34 and Core 1 EPS of $0.57 3 GAAP ROAA and ROAE 0.48% and 6.06%; Core 1 ROAA and ROAE 0.82% and 10.29% 1 See Reconciliation of GAAP Earnings and Core Earnings in Appendix |
| 4 Annual Financial Highlights Reported Results EPS $2.50 $2.59 $1.18 $1.44 $1.92 $1.41 ROAA 0.93 % 1.00 % 0.48 % 0.59 % 0.85 % 0.66 % ROAE 11.44 12.60 5.98 7.35 10.30 7.74 NIM FTE 3.11 3.24 2.85 2.47 2.70 2.93 Core 1 Results EPS $2.49 $2.81 $1.70 $1.65 $1.94 $1.57 ROAA 0.92 % 1.09 % 0.68 % 0.68 % 0.85 % 0.74 % ROAE 11.42 13.68 8.58 8.42 10.39 8.63 NIM FTE 3.07 3.17 2.87 2.49 2.72 2.93 Credit Quality NPAs/Loans & REO 0.77 % 0.23 % 0.31 % 0.24 % 0.29 % 0.35 % LLR/Loans 0.58 0.56 0.67 0.38 0.38 0.39 LLR/NPLs 124.89 248.66 214.27 164.05 128.87 112.23 NCOs/Avg Loans 0.02 0.05 0.06 0.04 - 0.24 Criticized&Classifieds/Loans 0.98 0.87 1.07 0.66 0.96 1.21 Capital Ratios CET1 10.52 % 10.86 % 9.88 % 10.95 % 10.98 % 11.59 % Tier 1 11.25 11.75 10.54 11.77 11.79 12.38 Total Risk-based Capital 14.69 14.32 12.63 13.62 13.72 14.48 Leverage Ratio 8.61 8.98 8.38 8.73 8.74 9.02 TCE/TA 7.82 8.22 7.52 8.05 7.83 8.22 Balance Sheet Book Value/Share $22.97 $22.26 $20.11 $20.59 $19.64 $18.63 Tangible Book Value/Share 22.31 21.61 19.45 20.02 19.07 18.08 Dividends/Share 0.88 0.84 0.84 0.84 0.80 0.72 Average Assets ($B) 8.3 8.1 7.3 7.0 6.5 6.2 Average Loans ($B) 6.7 6.6 6.0 5.6 5.3 5.0 Average Deposits ($B) 6.5 6.4 5.2 5.0 4.7 4.5 2017 2021 2018 2022 2020 2019 1 See Reconciliation of GAAP Earnings and Core Earnings in Appendix |

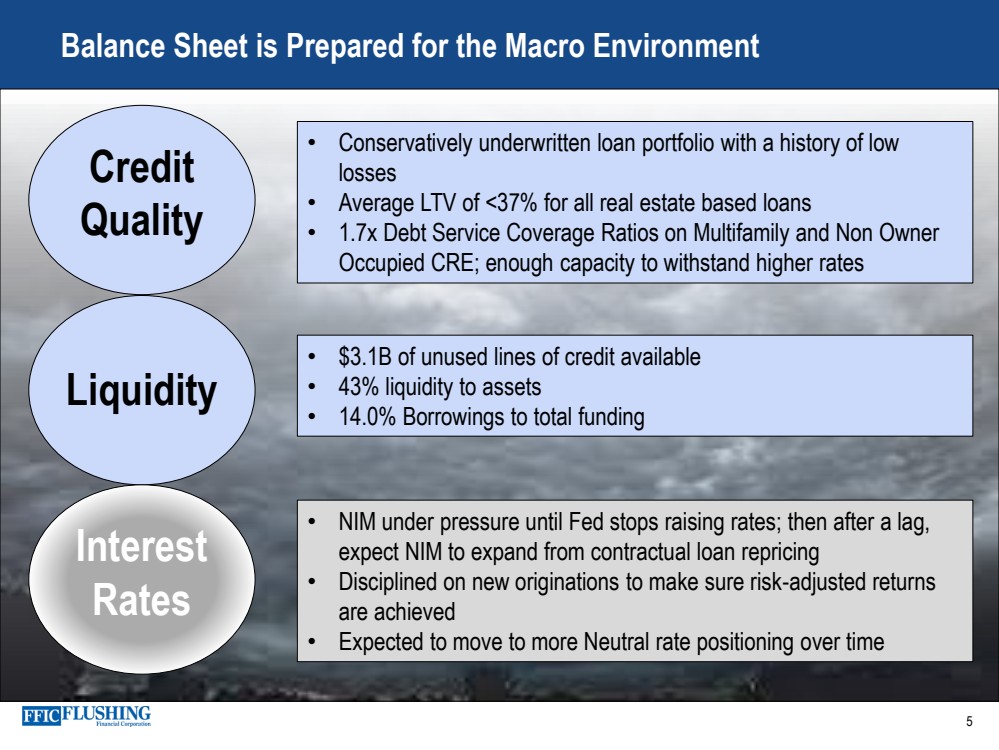
| 5 Balance Sheet is Prepared for the Macro Environment Credit Quality Liquidity Interest Rates • Conservatively underwritten loan portfolio with a history of low losses • Average LTV of <37% for all real estate based loans • 1.7x Debt Service Coverage Ratios on Multifamily and Non Owner Occupied CRE; enough capacity to withstand higher rates • $3.1B of unused lines of credit available • 43% liquidity to assets • 14.0% Borrowings to total funding • NIM under pressure until Fed stops raising rates; then after a lag, expect NIM to expand from contractual loan repricing • Disciplined on new originations to make sure risk - adjusted returns are achieved • Expected to move to more Neutral rate positioning over time |
| Digital Banking Usage Continues to Increase 6 Technology Enhancements Remain a Priority 24% Increase in Monthly Mobile Deposit Active Users Dec 2022 YoY ~27,700 Users with Active Online Banking Status 20% Dec 2022 YoY Growth 11% Digital Banking Enrollment Dec 2022 YoY Growth Numerated Small Business Lending Platform $22.5MM of Commitments in 2022 Internet Banks iGObanking and BankPurely national deposit gathering platforms ~2% of Average Deposits in Dec 2022 ~6,500 Zelle ® Transactions ~$2.2MM Zelle Dollar Transactions in Dec 2022 |

| Signed Lease for Bensonhurst Branch Expanding our Asian Banking Footprint Maintained Investment Grade Rating by Kroll Bond Rating Agency, Inc. Presented Sponsorship Check to Queens Tech + Innovation Challenge Assisting to help transform Queens into a leading hub of innovation and technology Attended Ribbon Cutting Ceremony for Charles B. Wang Community Health Center Flushing Bank was a significant participant in the financing of the health center 7 Key Events During 4Q22 |

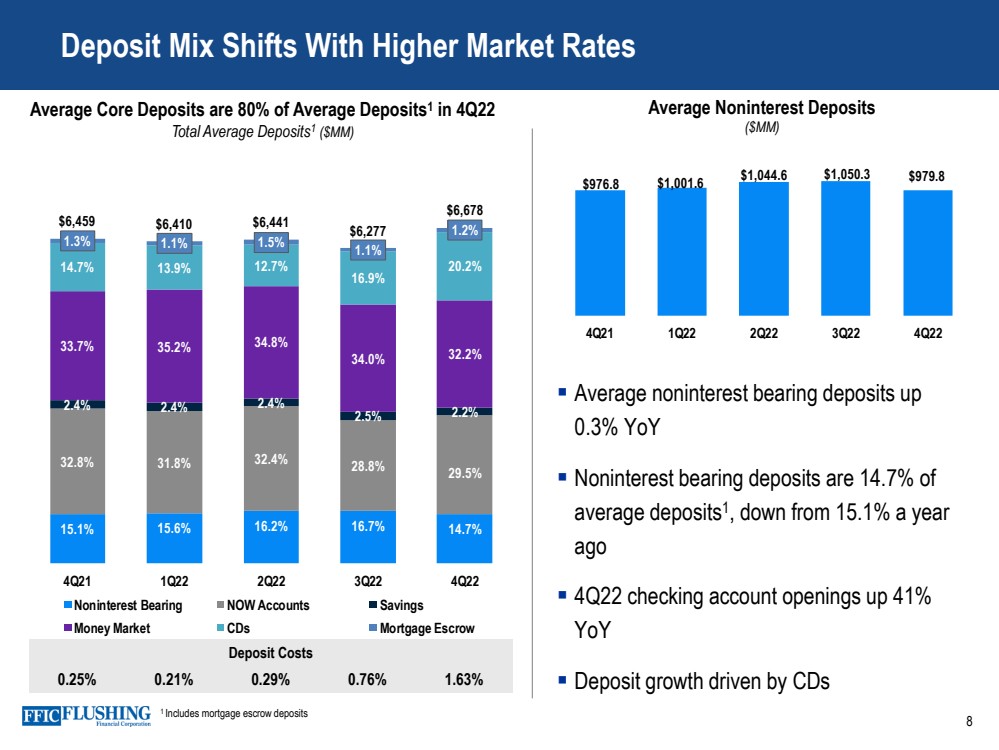
| Deposit Mix Shifts With Higher Market Rates 8 Average Core Deposits are 80% of Average Deposits 1 in 4Q22 Total Average Deposits 1 ($MM) 1 Includes mortgage escrow deposits Average noninterest bearing deposits up 0.3% YoY Noninterest bearing deposits are 14.7% of average deposits 1 , down from 15.1% a year ago 4Q22 checking account openings up 41% YoY Deposit growth driven by CDs Average Noninterest Deposits ($MM) 15.1% 15.6% 16.2% 16.7% 14.7% 32.8% 31.8% 32.4% 28.8% 29.5% 2.4% 2.4% 2.4% 2.5% 2.2% 33.7% 35.2% 34.8% 34.0% 32.2% 14.7% 13.9% 12.7% 16.9% 20.2% 1.3% 1.1% 1.5% 1.1% 1.2% $6,459 $6,410 $6,441 $6,277 $6,678 0 1000 2000 3000 4000 5000 6000 7000 8000 4Q21 1Q22 2Q22 3Q22 4Q22 Noninterest Bearing NOW Accounts Savings Money Market CDs Mortgage Escrow Deposit Costs 0.25% 0.21% 0.29% 0.76% 1.63% $976.8 $1,001.6 $1,044.6 $1,050.3 $979.8 -100 100 300 500 700 900 1100 1300 4Q21 1Q22 2Q22 3Q22 4Q22 |
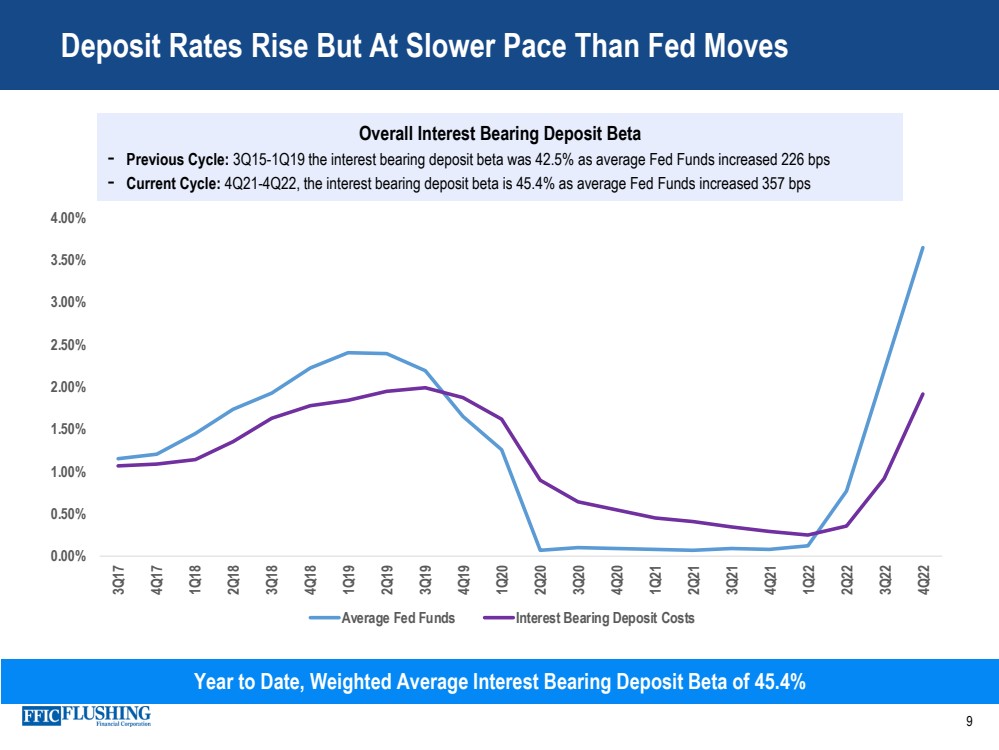
| Deposit Rates Rise But At Slower Pace Than Fed Moves 9 Year to Date, Weighted Average Interest Bearing Deposit Beta of 45.4% 0.00% 0.50% 1.00% 1.50% 2.00% 2.50% 3.00% 3.50% 4.00% 3Q17 4Q17 1Q18 2Q18 3Q18 4Q18 1Q19 2Q19 3Q19 4Q19 1Q20 2Q20 3Q20 4Q20 1Q21 2Q21 3Q21 4Q21 1Q22 2Q22 3Q22 4Q22 Average Fed Funds Interest Bearing Deposit Costs Overall Interest Bearing Deposit Beta - Previous Cycle: 3Q15 - 1Q19 the interest bearing deposit beta was 42.5% as average Fed Funds increased 226 bps - Current Cycle: 4Q21 - 4Q22, the interest bearing deposit beta is 45.4% as average Fed Funds increased 357 bps |
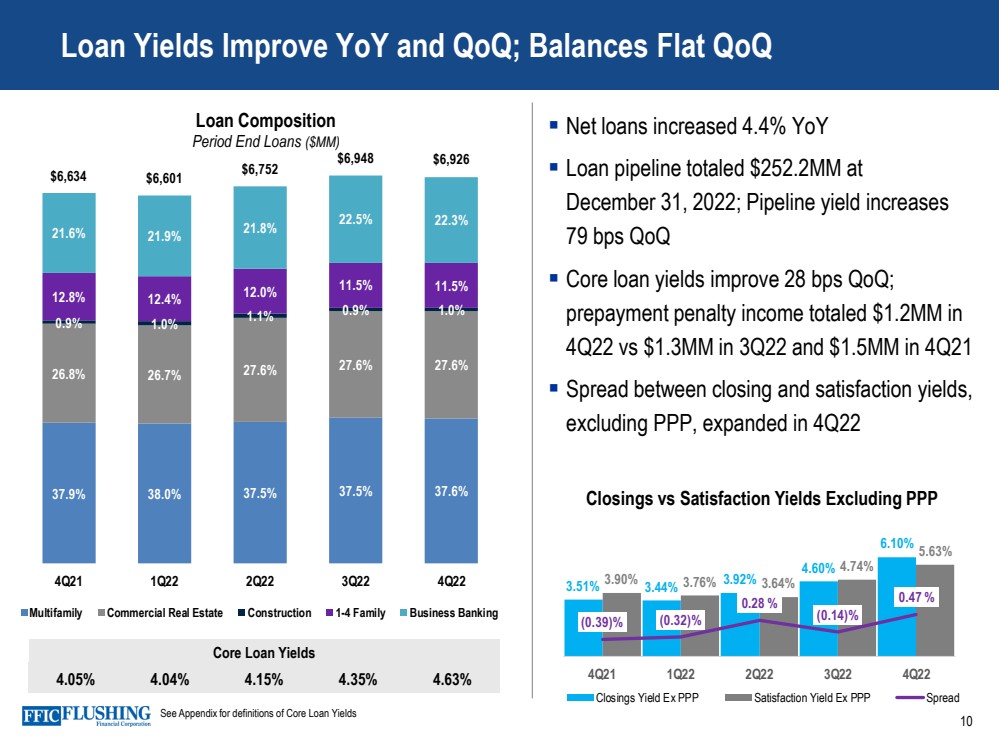
| 37.9% 38.0% 37.5% 37.5% 37.6% 26.8% 26.7% 27.6% 27.6% 27.6% 0.9% 1.0% 1.1% 0.9% 1.0% 12.8% 12.4% 12.0% 11.5% 11.5% 21.6% 21.9% 21.8% 22.5% 22.3% $6,634 $6,601 $6,752 $6,948 $6,926 - 1,000 2,000 3,000 4,000 5,000 6,000 7,000 8,000 4Q21 1Q22 2Q22 3Q22 4Q22 Multifamily Commercial Real Estate Construction 1-4 Family Business Banking Loan Yields Improve YoY and QoQ; Balances Flat QoQ 10 Core Loan Yields 4.05% 4.04% 4.15% 4.35% 4.63% Loan Composition Period End Loans ($MM) Net loans increased 4.4% YoY Loan pipeline totaled $252.2MM at December 31, 2022; Pipeline yield increases 79 bps QoQ Core loan yields improve 28 bps QoQ; prepayment penalty income totaled $1.2MM in 4Q22 vs $1.3MM in 3Q22 and $1.5MM in 4Q21 Spread between closing and satisfaction yields, excluding PPP, expanded in 4Q22 See Appendix for definitions of Core Loan Yields Closings vs Satisfaction Yields Excluding PPP 3.51% 3.44% 3.92% 4.60% 6.10% 3.90% 3.76% 3.64% 4.74% 5.63% (0.39)% (0.32)% 0.28 % (0.14)% 0.47 % (1.00)% (0.50)% 0.00 % 0.50 % 1.00 % 1.50 % 2.00 % 2.50 % 3.00 % 0.00% 1.00% 2.00% 3.00% 4.00% 5.00% 6.00% 7.00% 4Q21 1Q22 2Q22 3Q22 4Q22 Closings Yield Ex PPP Satisfaction Yield Ex PPP Spread |
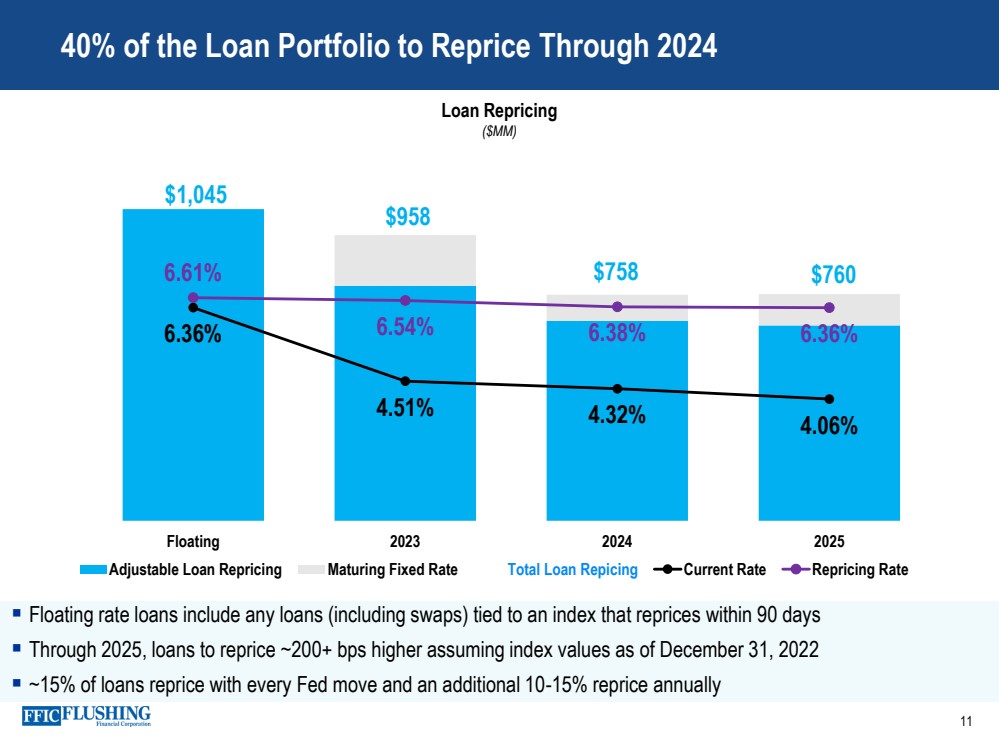
| Floating rate loans include any loans (including swaps) tied to an index that reprices within 90 days Through 2025, loans to reprice ~200+ bps higher assuming index values as of December 31, 2022 ~15% of loans reprice with every Fed move and an additional 10 - 15% reprice annually 40% of the Loan Portfolio to Reprice Through 2024 11 Loan Repricing ($MM) $1,045 $958 $758 $760 6.36% 4.51% 4.32% 4.06% 6.61% 6.54% 6.38% 6.36% - 200 400 600 800 1,000 1,200 Floating 2023 2024 2025 Adjustable Loan Repricing Maturing Fixed Rate Total Loan Repicing Current Rate Repricing Rate |
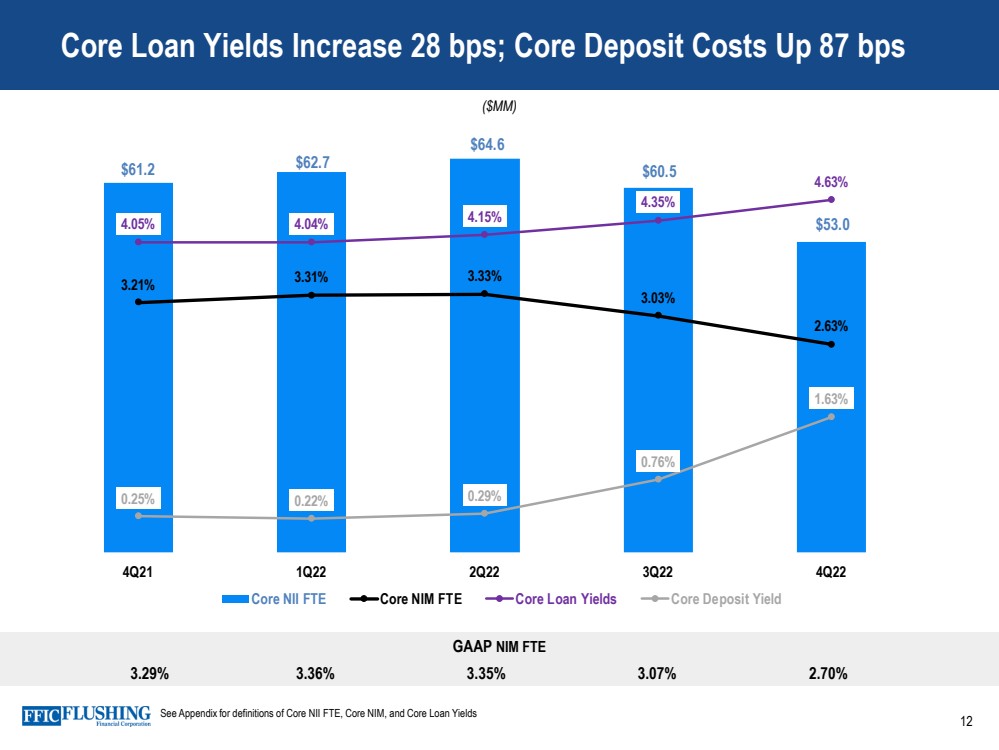
| GAAP NIM FTE 3.29% 3.36% 3.35% 3.07% 2.70% Core Loan Yields Increase 28 bps; Core Deposit Costs Up 87 bps 12 $61.2 $62.7 $64.6 $60.5 $53.0 3.21% 3.31% 3.33% 3.03% 2.63% 4.05% 4.04% 4.15% 4.35% 4.63% 0.25% 0.22% 0.29% 0.76% 1.63% -0.25% 0.75% 1.75% 2.75% 3.75% 4.75% 5.75% $10.0 $20.0 $30.0 $40.0 $50.0 $60.0 $70.0 4Q21 1Q22 2Q22 3Q22 4Q22 Core NII FTE Core NIM FTE Core Loan Yields Core Deposit Yield ($MM) See Appendix for definitions of Core NII FTE, Core NIM, and Core Loan Yields |
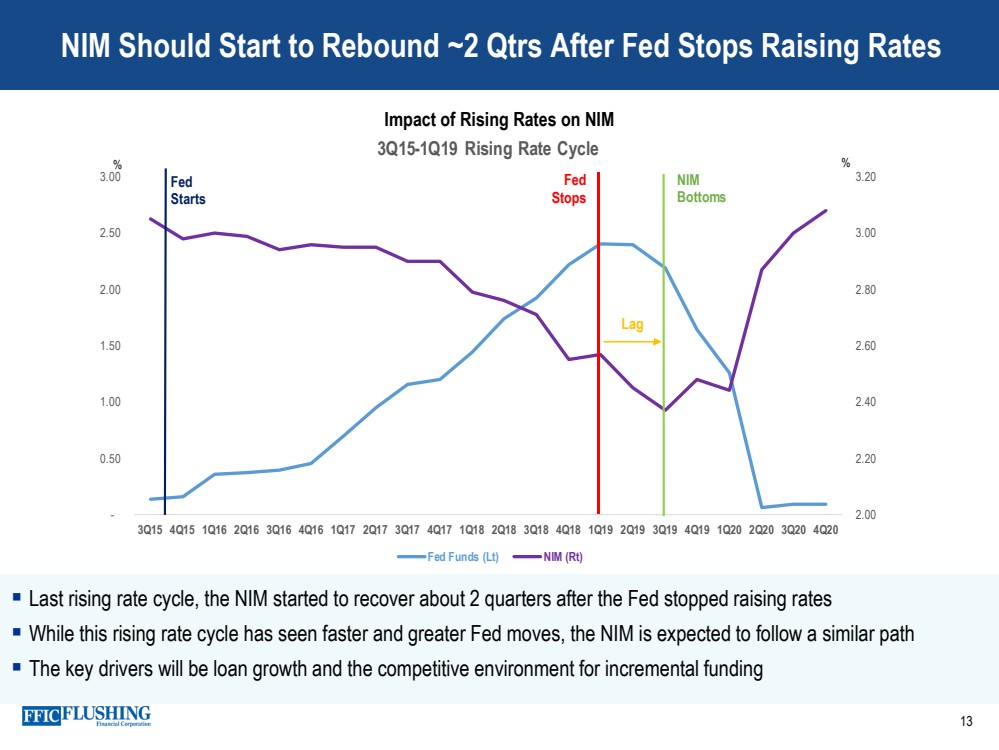
| 2.00 2.20 2.40 2.60 2.80 3.00 3.20 - 0.50 1.00 1.50 2.00 2.50 3.00 3Q15 4Q15 1Q16 2Q16 3Q16 4Q16 1Q17 2Q17 3Q17 4Q17 1Q18 2Q18 3Q18 4Q18 1Q19 2Q19 3Q19 4Q19 1Q20 2Q20 3Q20 4Q20 3Q15 - 1Q19 Rising Rate Cycle Fed Funds (Lt) NIM (Rt) NIM Bottoms Fed Starts % % Last rising rate cycle, the NIM started to recover about 2 quarters after the Fed stopped raising rates While this rising rate cycle has seen faster and greater Fed moves, the NIM is expected to follow a similar path The key drivers will be loan growth and the competitive environment for incremental funding NIM Should Start to Rebound ~2 Qtrs After Fed Stops Raising Rates 13 Impact of Rising Rates on NIM Fed Stops Lag |
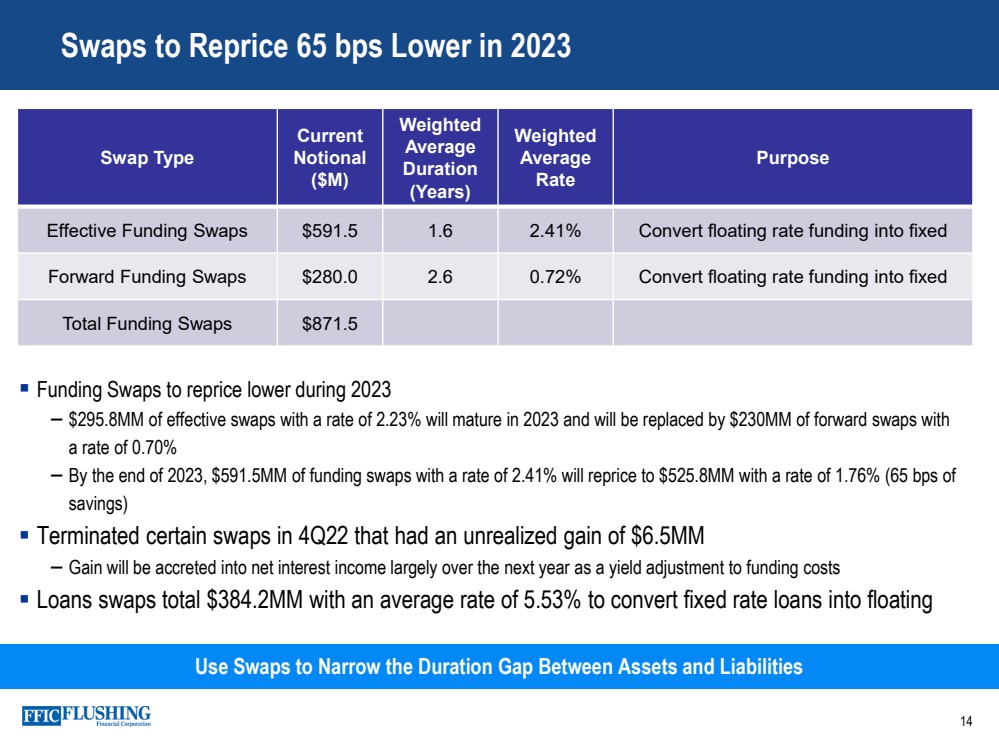
| Funding Swaps to reprice lower during 2023 – $295.8MM of effective swaps with a rate of 2.23% will mature in 2023 and will be replaced by $230MM of forward swaps with a rate of 0.70% – By the end of 2023, $591.5MM of funding swaps with a rate of 2.41% will reprice to $525.8MM with a rate of 1.76% (65 bps of savings) Terminated certain swaps in 4Q22 that had an unrealized gain of $6.5MM – Gain will be accreted into net interest income largely over the next year as a yield adjustment to funding costs Loans swaps total $384.2MM with an average rate of 5.53% to convert fixed rate loans into floating 14 Swaps to Reprice 65 bps Lower in 2023 Swap Type Current Notional ($M) Weighted Average Duration (Years) Weighted Average Rate Purpose Effective Funding Swaps $591.5 1.6 2.41% Convert floating rate funding into fixed Forward Funding Swaps $280.0 2.6 0.72% Convert floating rate funding into fixed Total Funding Swaps $871.5 Use Swaps to Narrow the Duration Gap Between Assets and Liabilities |
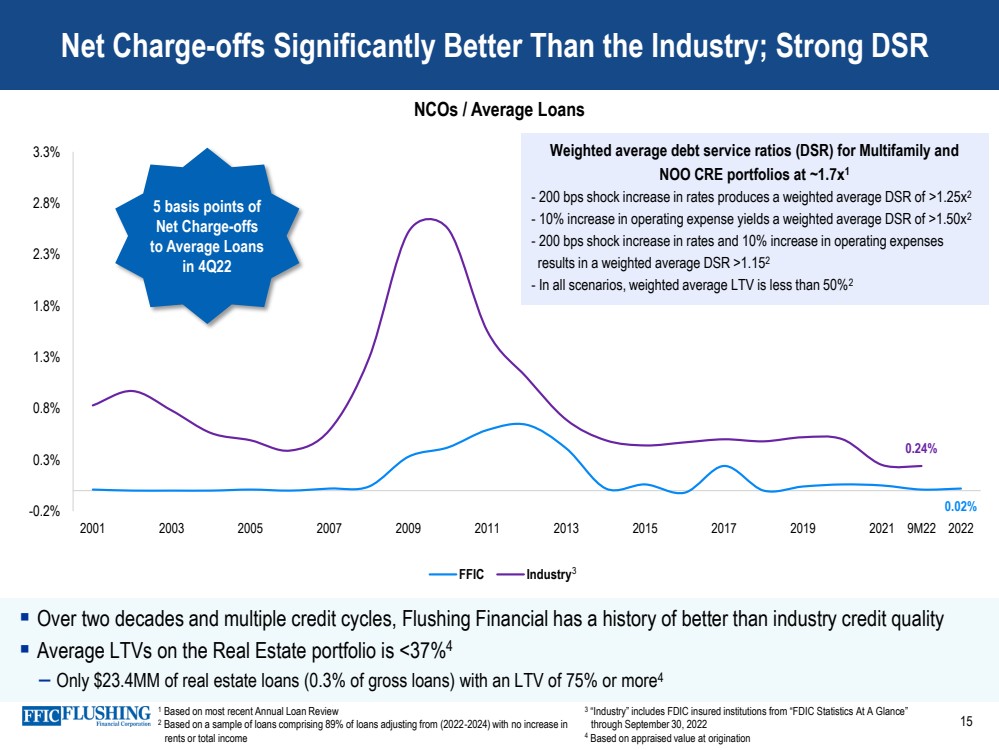
| Over two decades and multiple credit cycles, Flushing Financial has a history of better than industry credit quality Average LTVs on the Real Estate portfolio is <37% 4 – Only $23.4MM of real estate loans (0.3% of gross loans) with an LTV of 75% or more 4 Net Charge - offs Significantly Better Than the Industry; Strong DSR 15 NCOs / Average Loans 0.02% 0.24% -0.2% 0.3% 0.8% 1.3% 1.8% 2.3% 2.8% 3.3% 2001 2003 2005 2007 2009 2011 2013 2015 2017 2019 2021 2022 FFIC Industry 5 basis points of Net Charge - offs to Average Loans in 4Q22 9M22 Weighted average debt service ratios (DSR) for Multifamily and NOO CRE portfolios at ~1.7x 1 - 200 bps shock increase in rates produces a weighted average DSR of >1.25x 2 - 10% increase in operating expense yields a weighted average DSR of >1.50x 2 - 200 bps shock increase in rates and 10% increase in operating expenses results in a weighted average DSR >1.15 2 - In all scenarios, weighted average LTV is less than 50% 2 3 1 Based on most recent Annual Loan Review 2 Based on a sample of loans comprising 89% of loans adjusting from (2022 - 2024) with no increase in rents or total income 3 “Industry” includes FDIC insured institutions from “FDIC Statistics At A Glance” through September 30, 2022 4 Based on appraised value at origination |
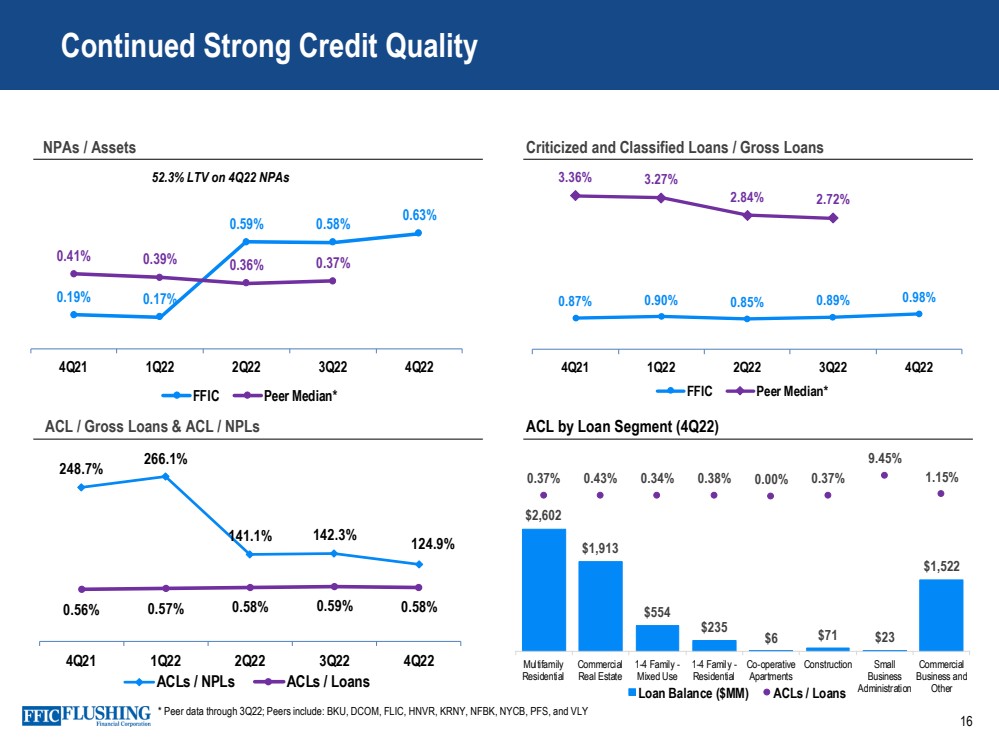
| 16 Continued Strong Credit Quality NPAs / Assets Criticized and Classified Loans / Gross Loans ACL / Gross Loans & ACL / NPLs ACL by Loan Segment (4Q22) $2,602 $1,913 $554 $235 $6 $71 $23 $1,522 0.37% 0.43% 0.34% 0.38% 0.00% 0.37% 9.45% 1.15% -70.00% -60.00% -50.00% -40.00% -30.00% -20.00% -10.00% 0.00% 10.00% Multifamily Residential Commercial Real Estate 1-4 Family - Mixed Use 1-4 Family - Residential Co-operative Apartments Construction Small Business Administration Commercial Business and Other Loan Balance ($MM) ACLs / Loans 248.7% 266.1% 141.1% 142.3% 124.9% 0.56% 0.57% 0.58% 0.59% 0.58% 0% 0% 0% 1% 1% 1% 1% 1% 2% 2% 2% 0% 50% 100% 150% 200% 250% 300% 4Q21 1Q22 2Q22 3Q22 4Q22 ACLs / NPLs ACLs / Loans 0.19% 0.17% 0.59% 0.58% 0.63% 0.41% 0.39% 0.36% 0.37% 0.00% 0.20% 0.40% 0.60% 0.80% 1.00% 4Q21 1Q22 2Q22 3Q22 4Q22 FFIC Peer Median* 52.3% LTV on 4Q22 NPAs * Peer data through 3Q22; Peers include: BKU, DCOM, FLIC, HNVR, KRNY, NFBK, NYCB, PFS, and VLY 0.87% 0.90% 0.85% 0.89% 0.98% 3.36% 3.27% 2.84% 2.72% 0.00% 1.00% 2.00% 3.00% 4.00% 5.00% 4Q21 1Q22 2Q22 3Q22 4Q22 FFIC Peer Median* |
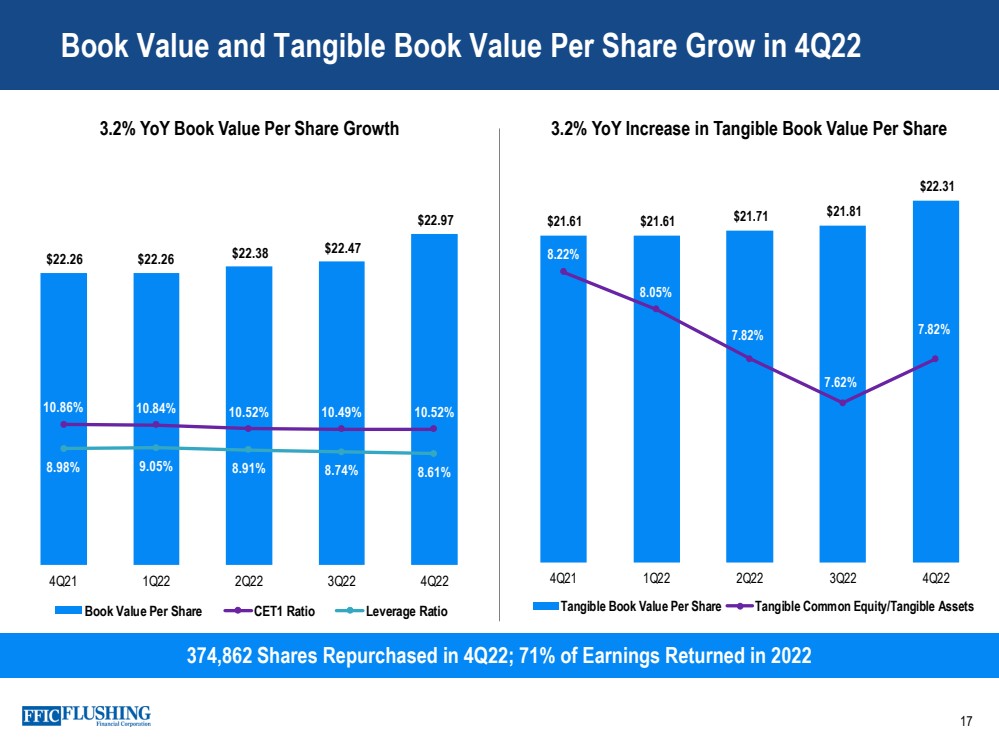
| Book Value and Tangible Book Value Per Share Grow in 4Q22 17 374,862 Shares Repurchased in 4Q22; 71% of Earnings Returned in 2022 3.2% YoY Book Value Per Share Growth 3.2 % YoY Increase in Tangible Book Value Per Share $21.61 $21.61 $21.71 $21.81 $22.31 8.22% 8.05% 7.82% 7.62% 7.82% 6.90% 7.10% 7.30% 7.50% 7.70% 7.90% 8.10% 8.30% 8.50% 8.70% $15.00 $16.00 $17.00 $18.00 $19.00 $20.00 $21.00 $22.00 $23.00 4Q21 1Q22 2Q22 3Q22 4Q22 Tangible Book Value Per Share Tangible Common Equity/Tangible Assets $22.26 $22.26 $22.38 $22.47 $22.97 10.86% 10.84% 10.52% 10.49% 10.52% 8.98% 9.05% 8.91% 8.74% 8.61% 0.00% 5.00% 10.00% 15.00% 20.00% 25.00% 30.00% $17.00 $18.00 $19.00 $20.00 $21.00 $22.00 $23.00 $24.00 4Q21 1Q22 2Q22 3Q22 4Q22 Book Value Per Share CET1 Ratio Leverage Ratio |
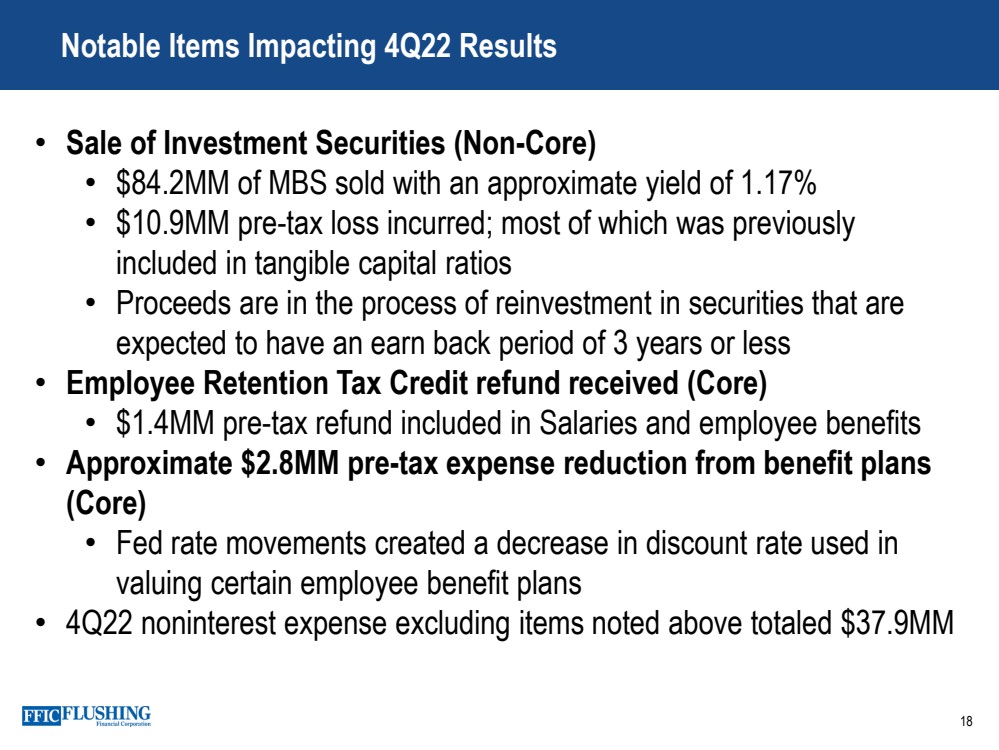
| 18 Notable Items Impacting 4Q22 Results • Sale of Investment Securities (Non - Core) • $84.2MM of MBS sold with an approximate yield of 1.17% • $10.9MM pre - tax loss incurred; most of which was previously included in tangible capital ratios • Proceeds are in the process of reinvestment in securities that are expected to have an earn back period of 3 years or less • Employee Retention Tax Credit refund received (Core) • $1.4MM pre - tax refund included in Salaries and employee benefits • Approximate $2.8MM pre - tax expense reduction from benefit plans (Core) • Fed rate movements created a decrease in discount rate used in valuing certain employee benefit plans • 4Q22 noninterest expense excluding items noted above totaled $37.9MM |
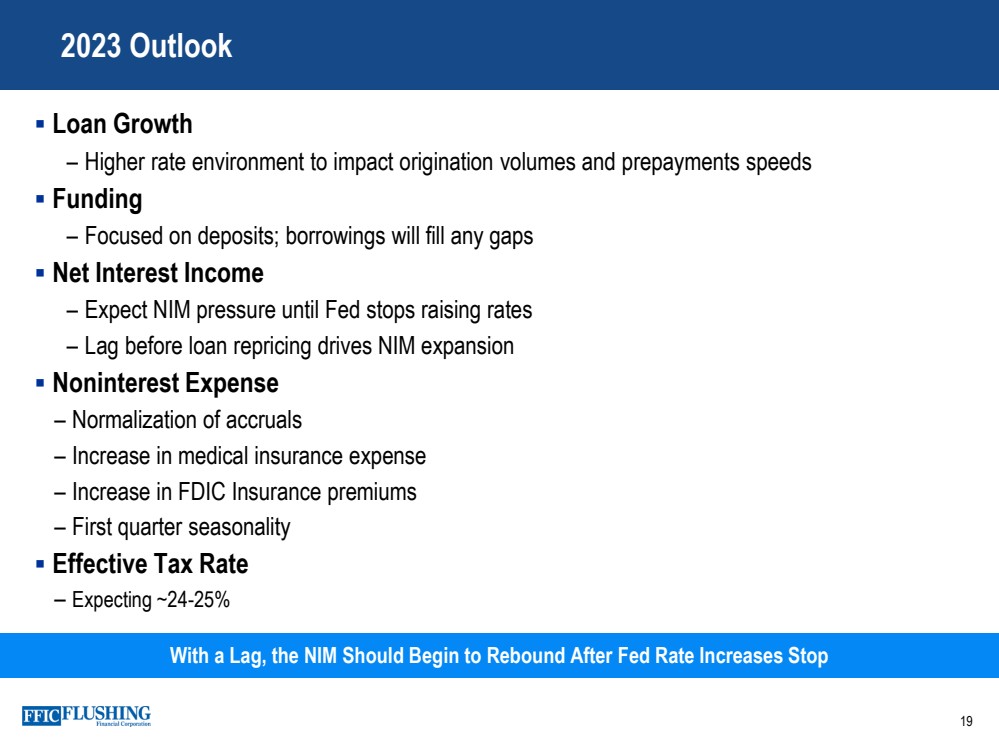
| 2023 Outlook 19 With a Lag, the NIM Should Begin to Rebound After Fed Rate Increases Stop Loan Growth – Higher rate environment to impact origination volumes and prepayments speeds Funding – Focused on deposits; borrowings will fill any gaps Net Interest Income – Expect NIM pressure until Fed stops raising rates – Lag before loan repricing drives NIM expansion Noninterest Expense – Normalization of accruals – Increase in medical insurance expense – Increase in FDIC Insurance premiums – First quarter seasonality Effective Tax Rate – Expecting ~24 - 25% |
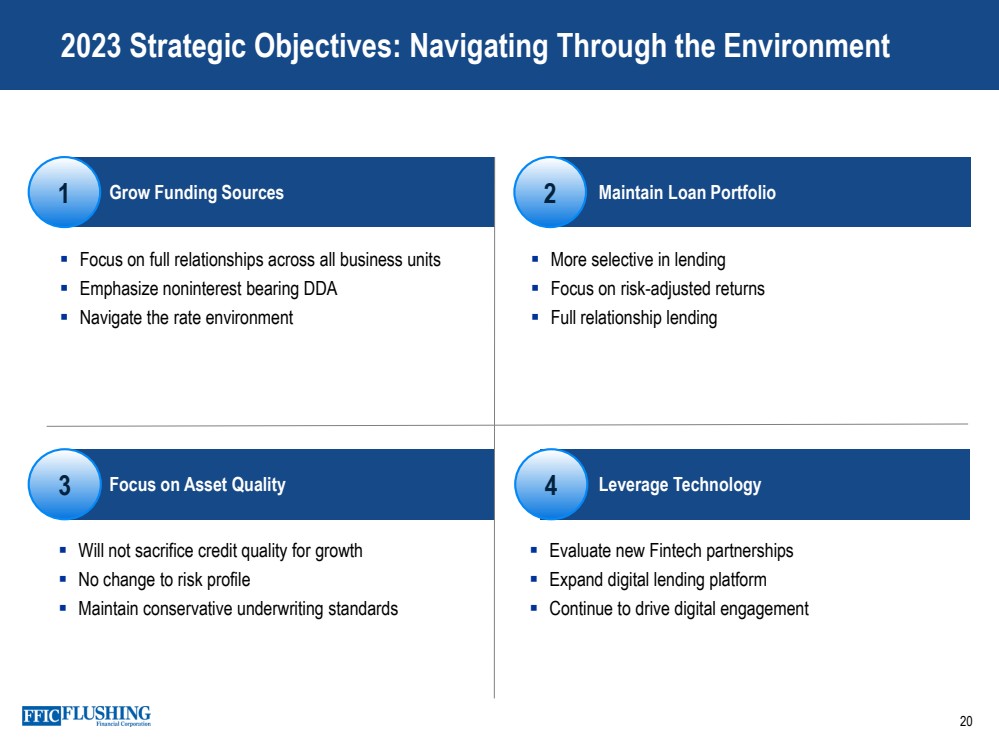
| 3 4 1 2 Grow Funding Sources Maintain Loan Portfolio Focus on full relationships across all business units Emphasize noninterest bearing DDA Navigate the rate environment More selective in lending Focus on risk - adjusted returns Full relationship lending Focus on Asset Quality Leverage Technology Will not sacrifice credit quality for growth No change to risk profile Maintain conservative underwriting standards Evaluate new Fintech partnerships Expand digital lending platform Continue to drive digital engagement 2023 Strategic Objectives: Navigating Through the Environment 20 |
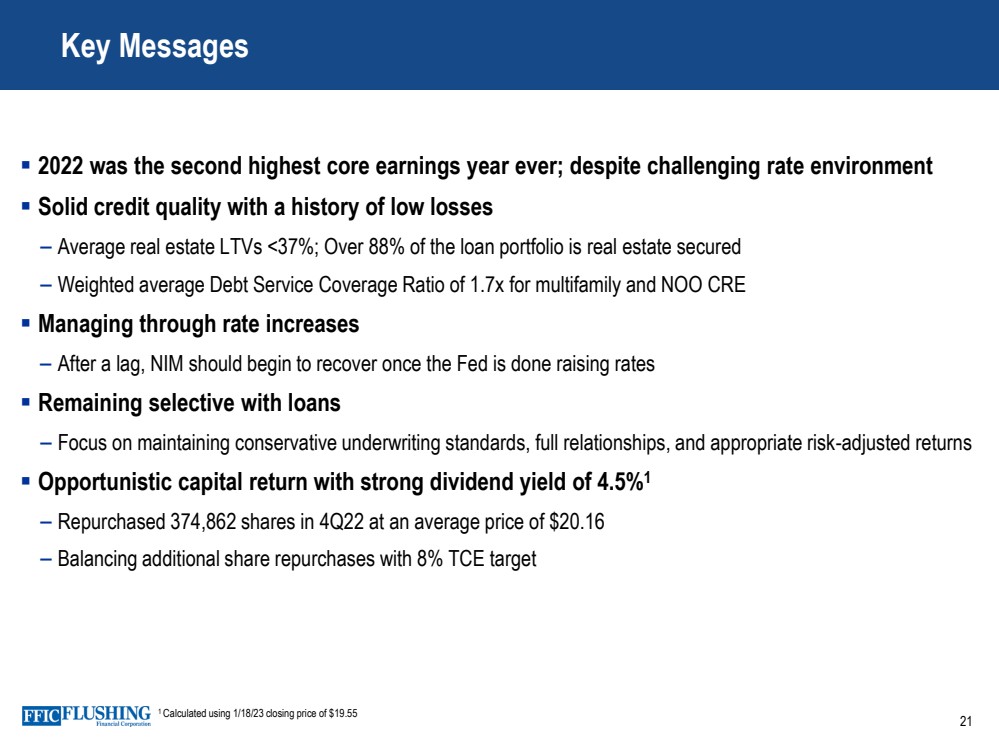
| 21 2022 was the second highest core earnings year ever; despite challenging rate environment Solid credit quality with a history of low losses – Average real estate LTVs <37%; Over 88% of the loan portfolio is real estate secured – Weighted average Debt Service Coverage Ratio of 1.7x for multifamily and NOO CRE Managing through rate increases – After a lag, NIM should begin to recover once the Fed is done raising rates Remaining selective with loans – Focus on maintaining conservative underwriting standards, full relationships, and appropriate risk - adjusted returns Opportunistic capital return with strong dividend yield of 4.5% 1 – Repurchased 374,862 shares in 4Q22 at an average price of $20.16 – Balancing additional share repurchases with 8% TCE target Key Messages 1 Calculated using 1/18/23 closing price of $19.55 |
| Appendix 22 |

| Reconciliation of GAAP Earnings and Core Earnings 23 Non - cash Fair Value Adjustments to GAAP Earnings The variance in GAAP and core earnings is partly driven by the impact of non - cash net gains and losses from fair value adjustments .. These fair value adjustments relate primarily to borrowing carried at fair value under the fair value option and swaps designated to protect against rising rates .. As the swaps get closer to maturity, the volatility in fair value adjustments will dissipate .. In a rising interest rate environment or a steepening of the yield curve, the loss position would experience an improvement .. In a declining interest rate environment, the movement in the curve exaggerates our mark - to - market loss position .. Core Net Income, Core Diluted EPS, Core ROAE, Core ROAA, Pre - provision, Pre - tax Net Revenue, Core Net Interest Income FTE, Core Net Interest Margin FTE, Core Interest Income and Yield on Total Loans, Core Noninterest Income, Core Noninterest Expense and Tangible Book Value per common share are each non - GAAP measures used in this presentation .. A reconciliation to the most directly comparable GAAP financial measures appears below in tabular form .. The Company believes that these measures are useful for both investors and management to understand the effects of certain interest and noninterest items and provide an alternative view of the Company's performance over time and in comparison to the Company's competitors .. These measures should not be viewed as a substitute for net income .. The Company believes that tangible book value per common share is useful for both investors and management as these are measures commonly used by financial institutions, regulators and investors to measure the capital adequacy of financial institutions .. The Company believes these measures facilitate comparison of the quality and composition of the Company's capital over time and in comparison to its competitors .. These measures should not be viewed as a substitute for total shareholders' equity .. These non - GAAP measures have inherent limitations, are not required to be uniformly applied and are not audited .. They should not be considered in isolation or as a substitute for analysis of results reported under GAAP .. These non - GAAP measures may not be comparable to similarly titled measures reported by other companies .. |
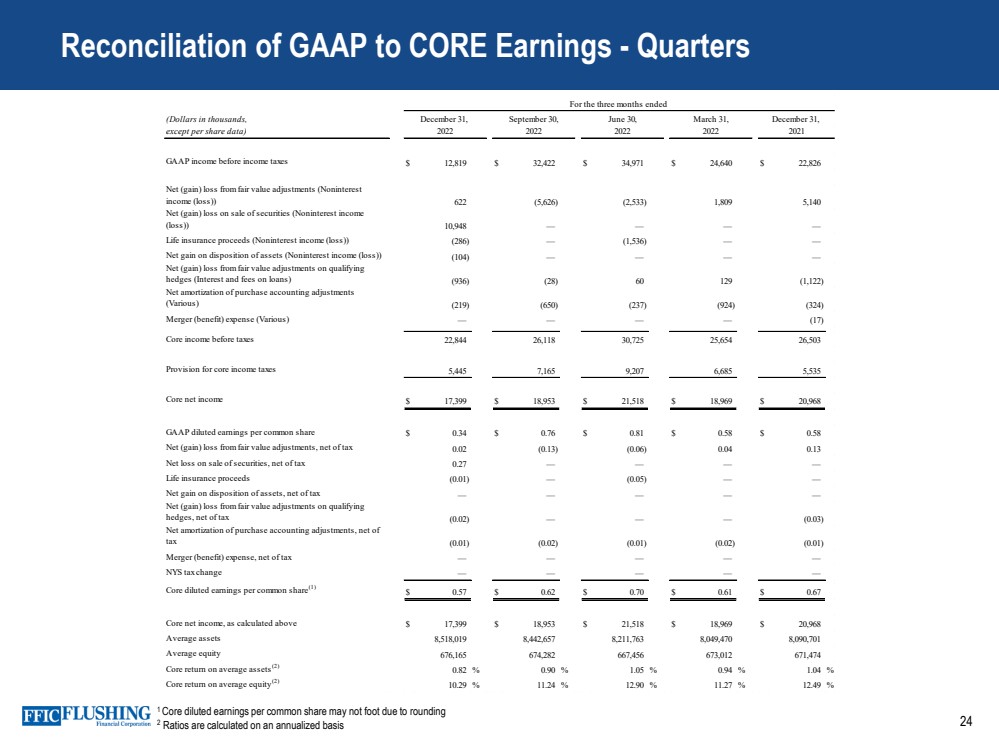
| 24 1 Core diluted earnings per common share may not foot due to rounding 2 Ratios are calculated on an annualized basis Reconciliation of GAAP to CORE Earnings - Quarters (Dollars in thousands, except per share data) GAAP income before income taxes $ 12,819 $ 32,422 $ 34,971 $ 24,640 $ 22,826 Net (gain) loss from fair value adjustments (Noninterest income (loss)) 622 (5,626) (2,533) 1,809 5,140 Net (gain) loss on sale of securities (Noninterest income (loss)) 10,948 — — — — Life insurance proceeds (Noninterest income (loss)) (286) — (1,536) — — Net gain on disposition of assets (Noninterest income (loss)) (104) — — — — Net (gain) loss from fair value adjustments on qualifying hedges (Interest and fees on loans) (936) (28) 60 129 (1,122) Net amortization of purchase accounting adjustments (Various) (219) (650) (237) (924) (324) Merger (benefit) expense (Various) — — — — (17) Core income before taxes 22,844 26,118 30,725 25,654 26,503 Provision for core income taxes 5,445 7,165 9,207 6,685 5,535 Core net income $ 17,399 $ 18,953 $ 21,518 $ 18,969 $ 20,968 GAAP diluted earnings per common share $ 0.34 $ 0.76 $ 0.81 $ 0.58 $ 0.58 Net (gain) loss from fair value adjustments, net of tax 0.02 (0.13) (0.06) 0.04 0.13 Net loss on sale of securities, net of tax 0.27 — — — — Life insurance proceeds (0.01) — (0.05) — — Net gain on disposition of assets, net of tax — — — — — Net (gain) loss from fair value adjustments on qualifying hedges, net of tax (0.02) — — — (0.03) Net amortization of purchase accounting adjustments, net of tax (0.01) (0.02) (0.01) (0.02) (0.01) Merger (benefit) expense, net of tax — — — — — NYS tax change — — — — — Core diluted earnings per common share (1) $ 0.57 $ 0.62 $ 0.70 $ 0.61 $ 0.67 Core net income, as calculated above $ 17,399 $ 18,953 $ 21,518 $ 18,969 $ 20,968 Average assets 8,518,019 8,442,657 8,211,763 8,049,470 8,090,701 Average equity 676,165 674,282 667,456 673,012 671,474 Core return on average assets (2) 0.82 % 0.90 % 1.05 % 0.94 % 1.04 % Core return on average equity (2) 10.29 % 11.24 % 12.90 % 11.27 % 12.49 % For the three months ended June 30, March 31, 2022 2021 December 31, 2022 December 31, September 30, 2022 2022 |
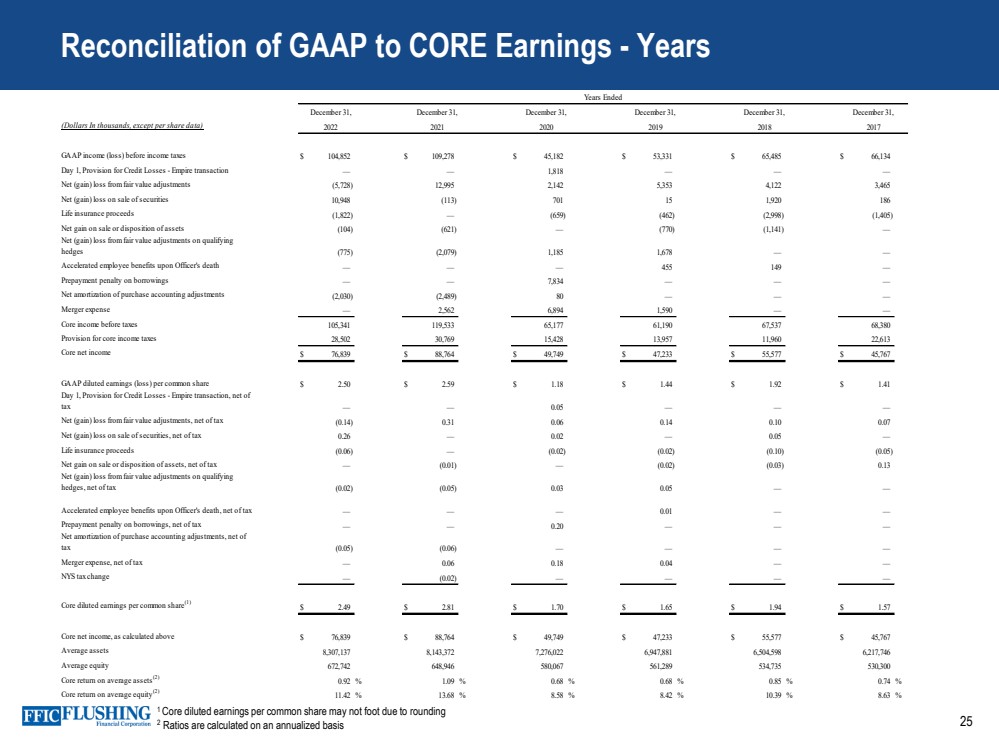
| 25 Reconciliation of GAAP to CORE Earnings - Years (Dollars In thousands, except per share data) GAAP income (loss) before income taxes $ 104,852 $ 109,278 $ 45,182 $ 53,331 $ 65,485 $ 66,134 Day 1, Provision for Credit Losses - Empire transaction — — 1,818 — — — Net (gain) loss from fair value adjustments (5,728) 12,995 2,142 5,353 4,122 3,465 Net (gain) loss on sale of securities 10,948 (113) 701 15 1,920 186 Life insurance proceeds (1,822) — (659) (462) (2,998) (1,405) Net gain on sale or disposition of assets (104) (621) — (770) (1,141) — Net (gain) loss from fair value adjustments on qualifying hedges (775) (2,079) 1,185 1,678 — — Accelerated employee benefits upon Officer's death — — — 455 149 — Prepayment penalty on borrowings — — 7,834 — — — Net amortization of purchase accounting adjustments (2,030) (2,489) 80 — — — Merger expense — 2,562 6,894 1,590 — — Core income before taxes 105,341 119,533 65,177 61,190 67,537 68,380 Provision for core income taxes 28,502 30,769 15,428 13,957 11,960 22,613 Core net income $ 76,839 $ 88,764 $ 49,749 $ 47,233 $ 55,577 $ 45,767 GAAP diluted earnings (loss) per common share $ 2.50 $ 2.59 $ 1.18 $ 1.44 $ 1.92 $ 1.41 Day 1, Provision for Credit Losses - Empire transaction, net of tax — — 0.05 — — — Net (gain) loss from fair value adjustments, net of tax (0.14) 0.31 0.06 0.14 0.10 0.07 Net (gain) loss on sale of securities, net of tax 0.26 — 0.02 — 0.05 — Life insurance proceeds (0.06) — (0.02) (0.02) (0.10) (0.05) Net gain on sale or disposition of assets, net of tax — (0.01) — (0.02) (0.03) 0.13 Net (gain) loss from fair value adjustments on qualifying hedges, net of tax (0.02) (0.05) 0.03 0.05 — — Accelerated employee benefits upon Officer's death, net of tax — — — 0.01 — — Prepayment penalty on borrowings, net of tax — — 0.20 — — — Net amortization of purchase accounting adjustments, net of tax (0.05) (0.06) — — — — Merger expense, net of tax — 0.06 0.18 0.04 — — NYS tax change — (0.02) — — — — Core diluted earnings per common share (1) $ 2.49 $ 2.81 $ 1.70 $ 1.65 $ 1.94 $ 1.57 Core net income, as calculated above $ 76,839 $ 88,764 $ 49,749 $ 47,233 $ 55,577 $ 45,767 Average assets 8,307,137 8,143,372 7,276,022 6,947,881 6,504,598 6,217,746 Average equity 672,742 648,946 580,067 561,289 534,735 530,300 Core return on average assets (2) 0.92 % 1.09 % 0.68 % 0.68 % 0.85 % 0.74 % Core return on average equity (2) 11.42 % 13.68 % 8.58 % 8.42 % 10.39 % 8.63 % Years Ended December 31, 2019 December 31, 2022 December 31, 2021 December 31, 2020 2018 December 31, December 31, 2017 1 Core diluted earnings per common share may not foot due to rounding 2 Ratios are calculated on an annualized basis |
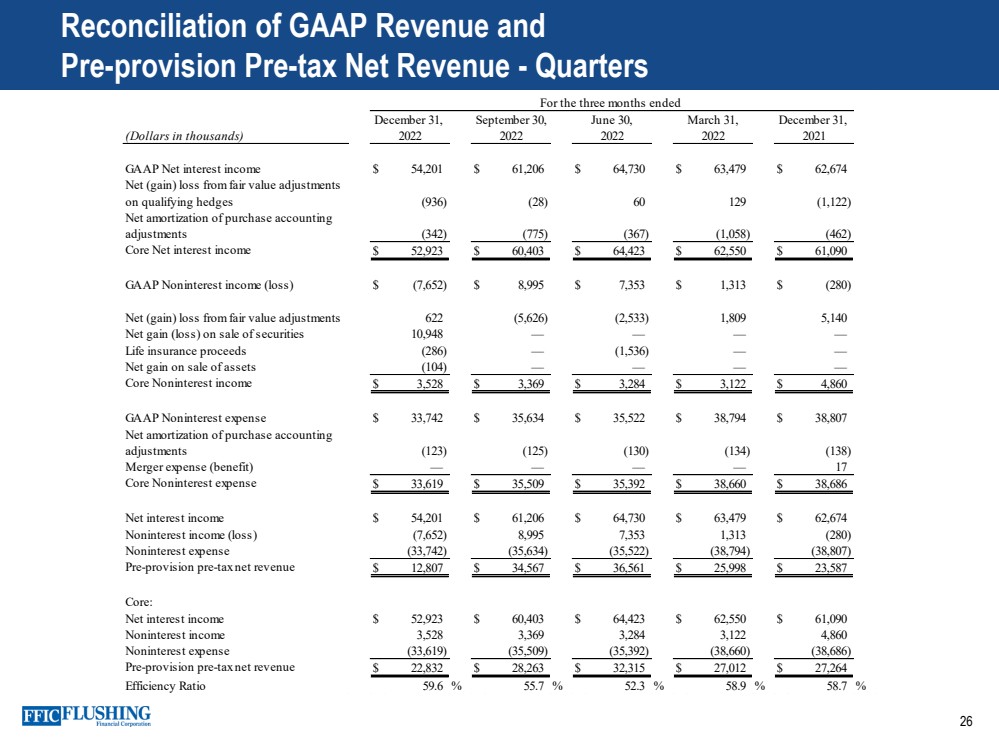
| 26 Reconciliation of GAAP Revenue and Pre - provision Pre - tax Net Revenue - Quarters (Dollars in thousands) GAAP Net interest income $ 54,201 $ 61,206 $ 64,730 $ 63,479 $ 62,674 Net (gain) loss from fair value adjustments on qualifying hedges (936) (28) 60 129 (1,122) Net amortization of purchase accounting adjustments (342) (775) (367) (1,058) (462) Core Net interest income $ 52,923 $ 60,403 $ 64,423 $ 62,550 $ 61,090 GAAP Noninterest income (loss) $ (7,652) $ 8,995 $ 7,353 $ 1,313 $ (280) Net (gain) loss from fair value adjustments 622 (5,626) (2,533) 1,809 5,140 Net gain (loss) on sale of securities 10,948 — — — — Life insurance proceeds (286) — (1,536) — — Net gain on sale of assets (104) — — — — Core Noninterest income $ 3,528 $ 3,369 $ 3,284 $ 3,122 $ 4,860 GAAP Noninterest expense $ 33,742 $ 35,634 $ 35,522 $ 38,794 $ 38,807 Net amortization of purchase accounting adjustments (123) (125) (130) (134) (138) Merger expense (benefit) — — — — 17 Core Noninterest expense $ 33,619 $ 35,509 $ 35,392 $ 38,660 $ 38,686 Net interest income $ 54,201 $ 61,206 $ 64,730 $ 63,479 $ 62,674 Noninterest income (loss) (7,652) 8,995 7,353 1,313 (280) Noninterest expense (33,742) (35,634) (35,522) (38,794) (38,807) Pre-provision pre-tax net revenue $ 12,807 $ 34,567 $ 36,561 $ 25,998 $ 23,587 Core: Net interest income $ 52,923 $ 60,403 $ 64,423 $ 62,550 $ 61,090 Noninterest income 3,528 3,369 3,284 3,122 4,860 Noninterest expense (33,619) (35,509) (35,392) (38,660) (38,686) Pre-provision pre-tax net revenue $ 22,832 $ 28,263 $ 32,315 $ 27,012 $ 27,264 Efficiency Ratio 59.6 % 55.7 % 52.3 % 58.9 % 58.7 % For the three months ended December 31, September 30, June 30, March 31, December 31, 2022 2022 2022 2022 2021 |
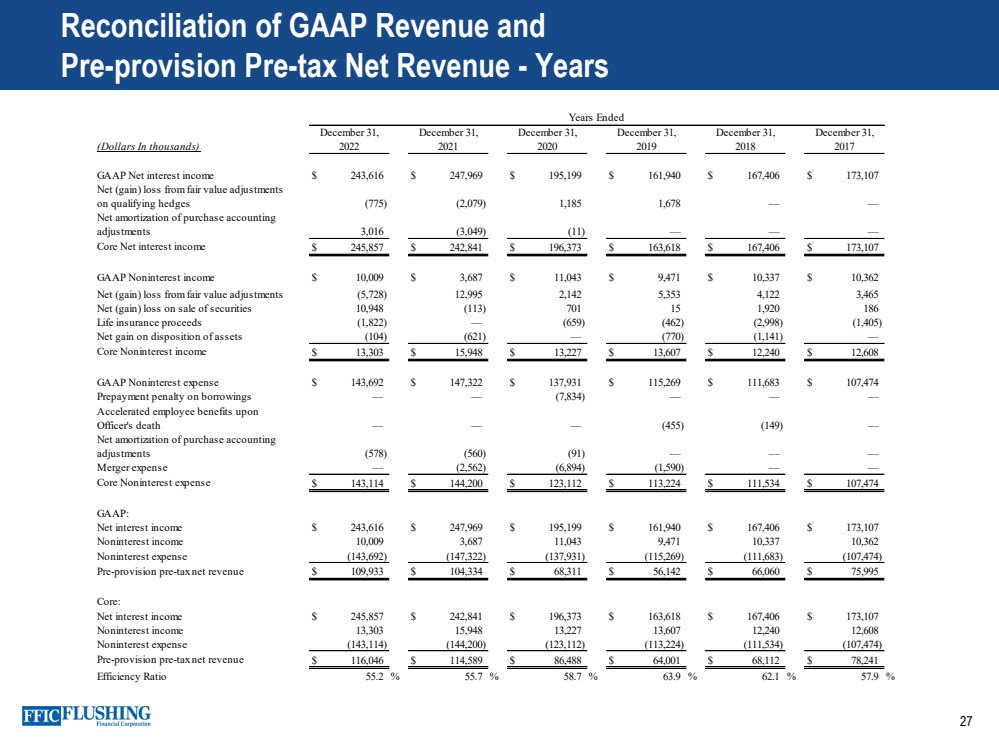
| 27 Reconciliation of GAAP Revenue and Pre - provision Pre - tax Net Revenue - Years (Dollars In thousands) GAAP Net interest income $ 243,616 $ 247,969 $ 195,199 $ 161,940 $ 167,406 $ 173,107 Net (gain) loss from fair value adjustments on qualifying hedges (775) (2,079) 1,185 1,678 — — Net amortization of purchase accounting adjustments 3,016 (3,049) (11) — — — Core Net interest income $ 245,857 $ 242,841 $ 196,373 $ 163,618 $ 167,406 $ 173,107 GAAP Noninterest income $ 10,009 $ 3,687 $ 11,043 $ 9,471 $ 10,337 $ 10,362 Net (gain) loss from fair value adjustments (5,728) 12,995 2,142 5,353 4,122 3,465 Net (gain) loss on sale of securities 10,948 (113) 701 15 1,920 186 Life insurance proceeds (1,822) — (659) (462) (2,998) (1,405) Net gain on disposition of assets (104) (621) — (770) (1,141) — Core Noninterest income $ 13,303 $ 15,948 $ 13,227 $ 13,607 $ 12,240 $ 12,608 GAAP Noninterest expense $ 143,692 $ 147,322 $ 137,931 $ 115,269 $ 111,683 $ 107,474 Prepayment penalty on borrowings — — (7,834) — — — Accelerated employee benefits upon Officer's death — — — (455) (149) — Net amortization of purchase accounting adjustments (578) (560) (91) — — — Merger expense — (2,562) (6,894) (1,590) — — Core Noninterest expense $ 143,114 $ 144,200 $ 123,112 $ 113,224 $ 111,534 $ 107,474 GAAP: Net interest income $ 243,616 $ 247,969 $ 195,199 $ 161,940 $ 167,406 $ 173,107 Noninterest income 10,009 3,687 11,043 9,471 10,337 10,362 Noninterest expense (143,692) (147,322) (137,931) (115,269) (111,683) (107,474) Pre-provision pre-tax net revenue $ 109,933 $ 104,334 $ 68,311 $ 56,142 $ 66,060 $ 75,995 Core: Net interest income $ 245,857 $ 242,841 $ 196,373 $ 163,618 $ 167,406 $ 173,107 Noninterest income 13,303 15,948 13,227 13,607 12,240 12,608 Noninterest expense (143,114) (144,200) (123,112) (113,224) (111,534) (107,474) Pre-provision pre-tax net revenue $ 116,046 $ 114,589 $ 86,488 $ 64,001 $ 68,112 $ 78,241 Efficiency Ratio 55.2 % 55.7 % 58.7 % 63.9 % 62.1 % 57.9 % December 31, 2017 Years Ended December 31, 2019 December 31, 2022 December 31, 2021 December 31, 2020 December 31, 2018 |
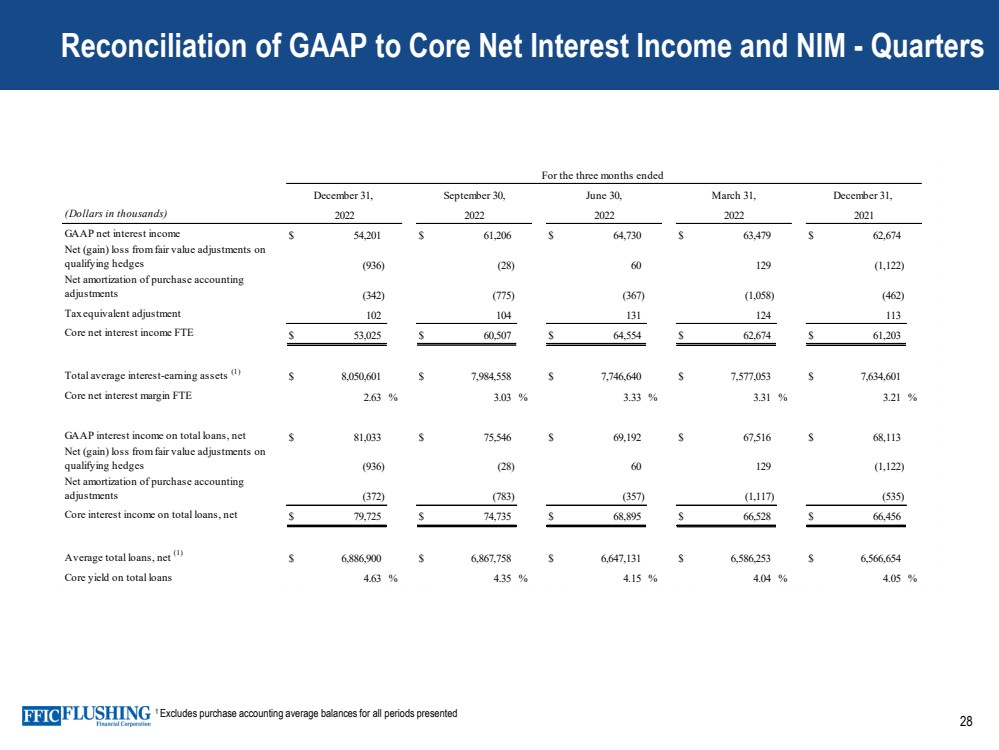
| 28 1 Excludes purchase accounting average balances for all periods presented Reconciliation of GAAP to Core Net Interest Income and NIM - Quarters (Dollars in thousands) GAAP net interest income $ 54,201 $ 61,206 $ 64,730 $ 63,479 $ 62,674 Net (gain) loss from fair value adjustments on qualifying hedges (936) (28) 60 129 (1,122) Net amortization of purchase accounting adjustments (342) (775) (367) (1,058) (462) Tax equivalent adjustment 102 104 131 124 113 Core net interest income FTE $ 53,025 $ 60,507 $ 64,554 $ 62,674 $ 61,203 Total average interest-earning assets (1) $ 8,050,601 $ 7,984,558 $ 7,746,640 $ 7,577,053 $ 7,634,601 Core net interest margin FTE 2.63 % 3.03 % 3.33 % 3.31 % 3.21 % GAAP interest income on total loans, net $ 81,033 $ 75,546 $ 69,192 $ 67,516 $ 68,113 Net (gain) loss from fair value adjustments on qualifying hedges (936) (28) 60 129 (1,122) Net amortization of purchase accounting adjustments (372) (783) (357) (1,117) (535) Core interest income on total loans, net $ 79,725 $ 74,735 $ 68,895 $ 66,528 $ 66,456 Average total loans, net (1) $ 6,886,900 $ 6,867,758 $ 6,647,131 $ 6,586,253 $ 6,566,654 Core yield on total loans 4.63 % 4.35 % 4.15 % 4.04 % 4.05 % For the three months ended December 31, September 30, June 30, March 31, December 31, 2022 2022 2022 2022 2021 |
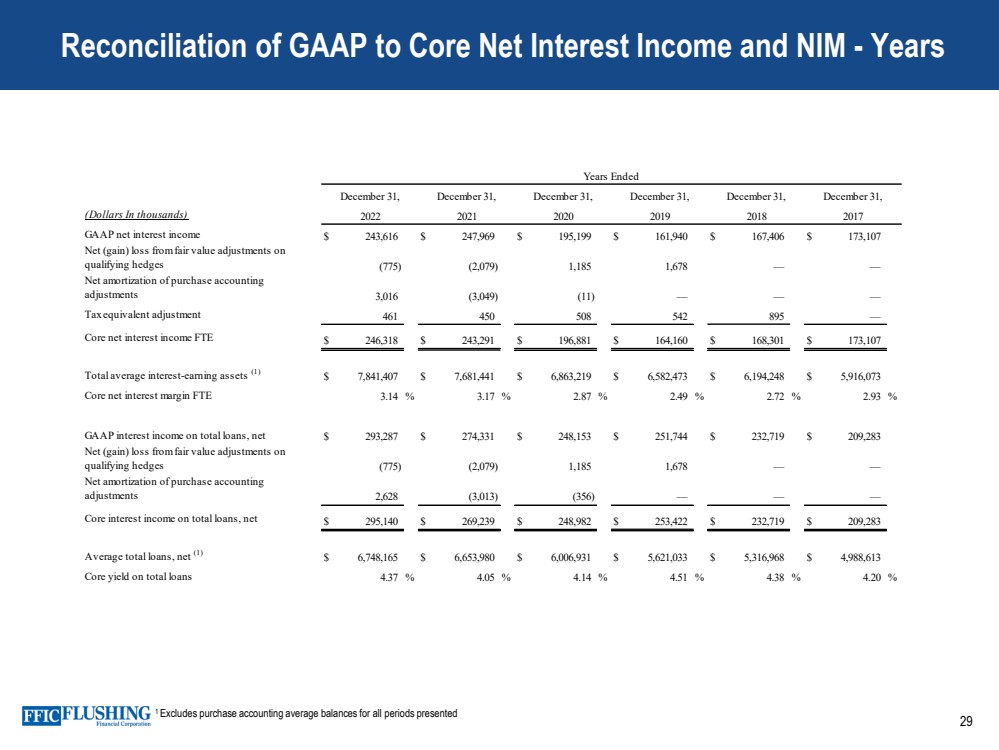
| 29 1 Excludes purchase accounting average balances for all periods presented Reconciliation of GAAP to Core Net Interest Income and NIM - Years (Dollars In thousands) GAAP net interest income $ 243,616 $ 247,969 $ 195,199 $ 161,940 $ 167,406 $ 173,107 Net (gain) loss from fair value adjustments on qualifying hedges (775) (2,079) 1,185 1,678 — — Net amortization of purchase accounting adjustments 3,016 (3,049) (11) — — — Tax equivalent adjustment 461 450 508 542 895 — Core net interest income FTE $ 246,318 $ 243,291 $ 196,881 $ 164,160 $ 168,301 $ 173,107 Total average interest-earning assets (1) $ 7,841,407 $ 7,681,441 $ 6,863,219 $ 6,582,473 $ 6,194,248 $ 5,916,073 Core net interest margin FTE 3.14 % 3.17 % 2.87 % 2.49 % 2.72 % 2.93 % GAAP interest income on total loans, net $ 293,287 $ 274,331 $ 248,153 $ 251,744 $ 232,719 $ 209,283 Net (gain) loss from fair value adjustments on qualifying hedges (775) (2,079) 1,185 1,678 — — Net amortization of purchase accounting adjustments 2,628 (3,013) (356) — — — Core interest income on total loans, net $ 295,140 $ 269,239 $ 248,982 $ 253,422 $ 232,719 $ 209,283 Average total loans, net (1) $ 6,748,165 $ 6,653,980 $ 6,006,931 $ 5,621,033 $ 5,316,968 $ 4,988,613 Core yield on total loans 4.37 % 4.05 % 4.14 % 4.51 % 4.38 % 4.20 % 2018 December 31, December 31, 2019 December 31, 2022 December 31, 2021 December 31, 2020 December 31, 2017 Years Ended |
| 30 Contact Details Susan K. Cullen SEVP, CFO & Treasurer Phone: (718) 961 - 5400 Email: scullen@flushingbank.com Al Savastano, CFA Director of Investor Relations Phone: (516) 820 - 1146 Email: asavastano@flushingbank.com |

|