Exhibit 99.3
Management’s Discussion and Analysis
This management’s discussion and analysis (“MD&A”) of operations and financial condition for the year ended October 31, 2022, dated December 6, 2022, should be read in conjunction with VersaBank’s Audited Consolidated Financial Statements for the year ended October 31, 2022, which have been prepared in accordance with International Financial Reporting Standards (“IFRS”) and is available on VersaBank’s website at www.versabank.com, SEDAR at www.sedar.com and EDGAR at www.sec.gov/edgar.shtml. All currency amounts in this document are in Canadian dollars unless otherwise indicated.
|
Cautionary Note Regarding Forward-Looking Statements |
2 |
|
About VersaBank |
3 |
|
Strategy |
3 |
|
Overview of Performance |
4 |
|
Selected Financial Highlights |
8 |
|
Business Outlook |
9 |
|
Financial Review - Earnings |
13 |
|
Financial Review - Balance Sheet |
17 |
|
Off-Balance Sheet Arrangements |
30 |
|
Related Party Transactions |
31 |
|
Results of Operating Segments |
32 |
|
Capital Management and Capital Resources |
33 |
|
Summary of Quarterly Results |
38 |
|
Fourth Quarter Review |
39 |
|
Critical Accounting Policies and Estimates |
40 |
|
Enterprise Risk Management |
47 |
|
Non-GAAP and Other Financial Measures |
59 |
Cautionary Note Regarding Forward-Looking Statements
VersaBank’s public communications often include written or oral forward-looking statements. Statements of this type are included in this document, and may be included in other filings and with Canadian securities regulators or the US Securities and Exchange Commission, or in other communications. All such statements are made pursuant to the “safe harbor” provisions of, and are intended to be forward-looking statements under, the United States Private Securities Litigation Reform Act of 1995 and any applicable Canadian securities legislation. The statements in this management’s discussion and analysis that relate to the future are forward-looking statements. By their very nature, forward-looking statements involve inherent risks and uncertainties, both general and specific, many of which are out of VersaBank’s control. Risks exist that predictions, forecasts, projections and other forward-looking statements will not be achieved. Readers are cautioned not to place undue reliance on these forward-looking statements as a number of important factors could cause actual results to differ materially from the plans, objectives, expectations, estimates and intentions expressed in such forward-looking statements. These factors include, but are not limited to, the strength of the Canadian and US economy in general and the strength of the local economies within Canada and the US in which VersaBank conducts operations; the effects of changes in monetary and fiscal policy, including changes in interest rate policies of the Bank of Canada and the US Federal Reserve; global commodity prices; the effects of competition in the markets in which VersaBank operates; inflation; capital market fluctuations; the timely development and introduction of new products in receptive markets; the impact of changes in the laws and regulations pertaining to financial services; changes in tax laws; technological changes; unexpected judicial or regulatory proceedings; unexpected changes in consumer spending and savings habits; the impact of wars or conflicts including the crisis in Ukraine and the impact of the crisis on global supply chains; the impact of new variants of COVID-19; and VersaBank’s anticipation of and success in managing the risks implicated by the foregoing.
The foregoing list of important factors is not exhaustive. When relying on forward-looking statements to make decisions, investors and others should carefully consider the foregoing factors and other uncertainties and potential events. The forward-looking information contained in the management’s discussion and analysis is presented to assist VersaBank shareholders and others in understanding VersaBank’s financial position and may not be appropriate for any other purposes. Except as required by securities law, VersaBank does not undertake to update any forward-looking statement that is contained in this management’s discussion and analysis or made from time to time by VersaBank or on its behalf.
About VersaBank
VersaBank (the “Bank”) adopted an electronic branchless model in 1993, becoming the world’s first branchless financial institution and obtains its deposits and the majority of its loans and leases digitally. It holds a Canadian Schedule 1 chartered bank licence and is regulated by the Office of the Superintendent of Financial Institutions (“OSFI”). In addition to its core Digital Banking operations, VersaBank has established cybersecurity services and banking and financial technology development operations through its wholly owned subsidiary, DRT Cyber Inc. (“DRTC”). VersaBank’s Common Shares trade on the Toronto Stock Exchange and Nasdaq under the symbol VBNK. Its Series 1 Preferred Shares trade on the Toronto Stock Exchange under the symbol VBNK.PR.A.
VersaBank is focused on increasing earnings by concentrating on underserved markets that support more attractive pricing for its products, leveraging existing distribution channels to deliver its financial products to these chosen markets and expanding its diverse deposit gathering network that provides efficient access to a range of low-cost deposit sources in order to maintain a low cost of funds.
The underlying drivers of VersaBank’s performance trends for the current and comparative periods are set out in the following sections of this MD&A.
Strategy
VersaBank’s strategy is to utilize proprietary software and established non-branch financial product distribution channels to deliver innovative commercial and consumer lending and deposit products to select clients operating in underserved markets in Canada and the United States (“US”). VersaBank is also leveraging its proprietary technology in cybersecurity and innovative solutions that address the growing volume of cyber threats challenging financial institutions, multi-national corporations and government entities on a daily basis.
Overview of Performance
* This is a non-GAAP measure. See definition in “Non-GAAP and Other Financial Measures”.
FY 2022 vs FY 2021
 |
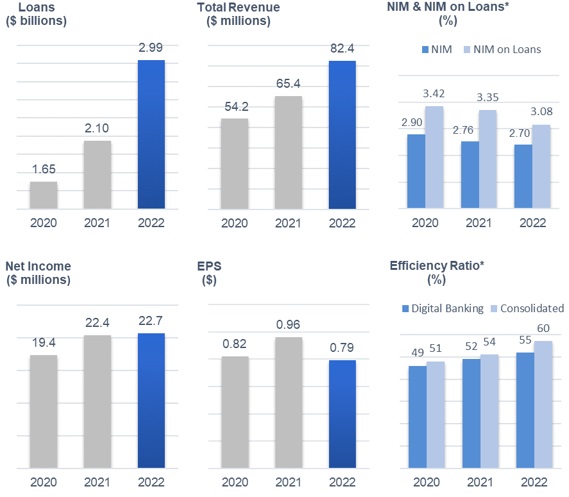
Loans increased 42% to $2.99 billion, driven primarily by outsized growth in the Bank’s Point-of-Sale (“POS”) loan and lease receivable portfolio, which increased 74%; |
|
Total revenue increased 26% to $82.4 million, composed of net interest income of $76.7 million and non-interest income of $5.7 million, the latter derived primarily from the Bank’s technology and cybersecurity business, attributable specifically to the operations of Digital Boundary Group (“DBG”), which generated services revenue and gross profit of $9.8 million and $5.6 million, respectively, (an increase of 14% and 8%, respectively), (See Acquisition of DBG in the Financial Review – Balance Sheet); |
|
Net interest margin (“NIM”) decreased 6 bps to 2.70% and NIM on loans decreased 27 bps to 3.08% as a function primarily of higher cost of funds attributable to changes in the Bank’s funding mix, offset substantially by higher yields earned on the Bank’s lending portfolio and securities purchased in the current year; |
|
Provision for credit losses (“PCL”) and the resulting PCL ratio were $451,000 and 0.02%, respectively, compared with a recovery of credit losses and resulting PCL ratio of $438,000 and -0.02%, respectively, last year. The recovery recorded last year was attributable primarily to changes in the Bank’s lending asset portfolio mix, a partial recovery of a previously impaired asset in the amount of $116,000 and changes in the forward-looking information used in the Bank’s credit risk models in the period. The current year over year trend was due primarily to lending asset growth and changes in the forward-looking information used by the Bank in its credit risk models; |
|
Net income increased 1% to a record of $22.7 million, driven by higher revenue, which was substantially offset by higher non-interest expense attributable to $5.2 million in transitory investments in several business development initiatives, including the planned acquisition of a US national bank, development and initial launch of the US Receivable Purchase Program (“RPP”), and the ongoing development of the Canadian-dollar version of VersaBank’s Digital Deposit Receipts. These transitory investments are expected to be substantially completed in the first quarter of fiscal 2023 and expected to contribute to revenue and net income growth beginning in 2023. Higher non-interest expense was also the result of higher salary and benefits expense due to higher staffing levels to support expanded revenue-generating business activity across the Bank and higher costs associated with employee retention amidst the current challenging labour market. In addition, net income was dampened by temporarily elevated corporate income taxes resulting in the Bank’s tax provision increasing incrementally by approximately $1.1 million, which was attributable to a higher effective income tax rate, which management anticipates will be reduced in the coming fiscal year; |
|
Earnings per share (“EPS”) decreased 18% to $0.79, primarily due to the impact of the issuance of 6.3 million common shares concurrent with the Bank’s listing on Nasdaq in September 2021. EPS was also impacted by higher non-interest expense of $0.16 (on an after tax basis) related to transitory investment in multiple business development initiatives described above and the higher effective tax rate of $0.04 (on an after tax basis); and, |
|
Efficiency ratio for Digital Banking operations (excluding DRTC) increased 6% to 55% and was elevated as a function primarily of VersaBank’s investments in the business development initiatives described above. Efficiency ratio for Digital Banking operations adjusted for the Bank’s investments in the business development initiatives described above was 49% (see definition in “Non-GAAP and Other Financial Measures”). |
Items of note
FY 2022
|
On August 5, 2022, the Bank received approval from the Toronto Stock Exchange (“TSX”) to proceed with a Normal Course Issuer Bid (“NCIB”) for its common shares. On September 21, 2022, the Bank received approval from the Nasdaq to proceed with a NCIB for its common shares. Pursuant to the NCIB, VersaBank may purchase for cancellation up to 1,700,000 of its common shares representing approximately 9.54% of its public float. VersaBank’s directors and management believe that the market price of VersaBank’s common shares does not reflect the value of the business and the future prospects of same, and further, reflects a material discount to book value and as such the purchase of common shares for cancellation at such time is a prudent corporate measure and represents an attractive investment for the Bank. The Bank had repurchased 195,300 shares under the NCIB as at October 31, 2022; |
|
On June 14, 2022, the Bank signed a definitive agreement to acquire Minnesota-based Stearns Bank Holdingford, N.A. (“SBH”), a privately held, wholly-owned subsidiary of Stearns Financial Services Inc. (“SFSI”) based in St. Cloud, Minnesota, for an estimated US $13.5 million (CA $18.4 million), subject to adjustment at closing. SBH is a fully operational OCC (Office of the Comptroller of the Currency)-chartered national bank, focused on small business lending, which is expected to add approximately US $60 million in total assets to VersaBank’s balance sheet. The acquisition is intended to provide VersaBank with access to US denominated deposits to expand the growth of its RPP business, which VersaBank launched in the US early in the second quarter of fiscal 2022. Subject to customary closing conditions, including regulatory approval by both the OCC and OSFI, the transaction is anticipated to close in early calendar 2023; |
|
|
On May 9, 2022, the Bank announced the appointment of Rick Jankura to the Bank’s Board of Directors. Mr. Jankura brings to the VersaBank board more than four decades of experience as a finance and accounting executive with a broad range of senior management and board of director roles with both private and public companies in a diverse range of industries, including financial services, manufacturing, services and software; |
|
On March 31, 2022, VersaBank announced that it had entered into an agreement with its first RPP partner in the US, a large, North American, commercial transportation financing business focused on independent owner/operators; and, |
|
On March 28, 2022, VersaBank announced the successful completion of the independent third-party System and Organization Controls (“SOC2”) – Type I audit of its VersaVault®, VersaBank’s proprietary security technology for blockchain-based assets, which underpins VersaBank’s revolutionary Digital Deposit Receipts. |
FY 2021
| |
On September 21, 2021 the Bank completed a treasury offering of 5,500,000 common shares at a price of USD $10.00 per share, the equivalent of CAD $12.68 per share, for gross proceeds of USD $55.0 million and on September 29, 2021, the underwriters of the aforementioned offering exercised their full over-allotment option to purchase an additional 825,000 shares (15% of the 5,500,000 common shares issued via the base offering referenced above) at a price of USD $10.00 per share, or CAD $12.74 per share, for gross proceeds of USD $8.3 million, collectively (“the Common Share Offering”). Total net cash proceeds from the Common Share Offering was CAD $73.2 million. However, the Bank’s share capital increased by CAD $75.1 million as a function of the Common Share Offering and tax effected issue costs of $5.4 million. The Bank listed on the Nasdaq under the symbol VBNK concurrent with the Common Share Offering on September 21, 2021; |
|
On April 30, 2021, the Bank completed a private placement with US institutional investors of non-viability contingent capital (“NVCC”) compliant fixed to floating rate subordinated notes payable (“the Notes”), in the principal amount of USD $75.0 million, equivalent to CAD $92.1 million as at April 30, 2021. Interest will be paid on the Notes semi-annually in arrears on May 1 and November 1 of each year, commencing on November 1, 2021, at a fixed rate of 5.00% per year, until May 1, 2026. Thereafter, if not redeemed by VersaBank, the Notes will have a floating interest rate payable at the 3-month Bankers’ Acceptance Rate plus 361 basis points, payable quarterly in arrears, on February 1, May 1, August 1 and November 1 of each year, commencing August 1, 2026, until maturity in May 2031. Egan-Jones Ratings Company assigned the Notes and the Bank an “A-” and “A” rating respectively, at the time of the private placement; |
|
On April 30, 2021, the Bank redeemed all of its outstanding Non-Cumulative Series 3 preferred shares (NVCC) using cash on hand. The amount paid on redemption for each share was $10.00, and in aggregate $16.8 million; |
|
On January 4, 2021, the Bank announced the appointment of Peter Irwin to the Bank’s Board of Directors, filling the vacant position left by the sudden passing of Colin E. Litton in December 2020. Mr. Irwin brings to the VersaBank Board more than 30 years of leadership experience in the Canadian financial services industry. His extensive background includes investment banking, capital markets, corporate development, merchant banking and private equity; and, |
|
On November 30, 2020, the Bank’s wholly owned subsidiary DRTC acquired 100% of the shares of 2021945 Ontario Inc., operating as Digital Boundary Group (“DBG”), in exchange for $8.5 million in cash and a deferred payment obligation of $1.4 million, for total consideration of $9.9 million. DBG is an information technology (IT) security assurance services firm with offices in London, Ontario and Dallas, Texas. DBG provides corporate and government clients with a suite of IT security assurance services, that range from external network, web and mobile application penetration testing through to physical social engineering engagements along with supervisory control and data acquisition (SCADA) system assessments, as well as various aspects of IT security training. |
Selected Financial Highlights
|
(unaudited) |
||||||||||||
|
October 31 |
October 31 |
October 31 |
||||||||||
|
($CDN thousands except per share amounts) |
2022 |
2021 |
2020 |
|||||||||
|
Results of operations |
||||||||||||
|
Interest income |
$ | 126,817 | $ | 89,488 | $ | 86,094 | ||||||
|
Net interest income |
76,666 | 60,157 | 54,125 | |||||||||
|
Non-interest income |
5,726 | 5,200 | 60 | |||||||||
|
Total revenue |
82,392 | 65,357 | 54,185 | |||||||||
|
Provision for (recovery of) credit losses |
451 | (438 | ) | (344 | ) | |||||||
|
Non-interest expenses |
49,393 | 35,006 | 27,777 | |||||||||
|
Digital banking |
42,392 | 31,046 | 26,758 | |||||||||
|
DRTC |
7,166 | 4,111 | 1,019 | |||||||||
|
Net income |
22,658 | 22,380 | 19,405 | |||||||||
|
Income per common share: |
||||||||||||
|
Basic |
$ | 0.79 | $ | 0.96 | $ | 0.82 | ||||||
|
Diluted |
$ | 0.79 | $ | 0.96 | $ | 0.82 | ||||||
|
Dividends paid on preferred shares |
$ | 988 | $ | 1,578 | $ | 2,168 | ||||||
|
Dividends paid on common shares |
$ | 2,741 | $ | 2,268 | $ | 2,112 | ||||||
|
Yield* |
4.47 | % | 4.11 | % | 4.62 | % | ||||||
|
Cost of funds* |
1.77 | % | 1.35 | % | 1.71 | % | ||||||
|
Net interest margin* |
2.70 | % | 2.76 | % | 2.90 | % | ||||||
|
Net interest margin on loans* |
3.08 | % | 3.35 | % | 3.42 | % | ||||||
|
Return on average common equity* |
6.61 | % | 8.45 | % | 7.89 | % | ||||||
|
Book value per common share* |
$ | 12.37 | $ | 11.61 | $ | 10.70 | ||||||
|
Efficiency ratio* |
60 | % | 54 | % | 51 | % | ||||||
|
Efficiency ratio - Digital banking* |
55 | % | 52 | % | 49 | % | ||||||
|
Return on average total assets* |
0.76 | % | 0.95 | % | 0.92 | % | ||||||
|
Gross impaired loans to total loans* |
0.01 | % | 0.00 | % | 0.00 | % | ||||||
|
Provision for (recovery of) credit losses as a % of average loans* |
0.02 | % | (0.02% | ) | (0.02% | ) | ||||||
|
as at |
||||||||||||
|
Balance Sheet Summary |
||||||||||||
|
Cash |
$ | 88,581 | $ | 271,523 | $ | 257,644 | ||||||
|
Securities |
141,564 | - | - | |||||||||
|
Loans, net of allowance for credit losses |
2,992,678 | 2,103,050 | 1,654,910 | |||||||||
|
Average loans* |
2,547,864 | 1,878,980 | 1,624,599 | |||||||||
|
Total assets |
3,265,998 | 2,415,086 | 1,943,885 | |||||||||
|
Deposits |
2,657,540 | 1,853,204 | 1,567,570 | |||||||||
|
Subordinated notes payable |
104,951 | 95,272 | 4,889 | |||||||||
|
Shareholders' equity |
350,675 | 332,106 | 255,288 | |||||||||
|
Capital ratios** |
||||||||||||
|
Risk-weighted assets |
$ | 2,714,902 | $ | 2,013,544 | $ | 1,580,939 | ||||||
|
Common Equity Tier 1 capital |
325,657 | 305,708 | 219,359 | |||||||||
|
Total regulatory capital |
448,575 | 418,718 | 255,471 | |||||||||
|
Common Equity Tier 1 (CET1) capital ratio |
12.00 | % | 15.18 | % | 13.88 | % | ||||||
|
Tier 1 capital ratio |
12.50 | % | 15.86 | % | 15.73 | % | ||||||
|
Total capital ratio |
16.52 | % | 20.80 | % | 16.16 | % | ||||||
|
Leverage ratio |
9.84 | % | 12.60 | % | 12.19 | % | ||||||
|
* See definition in "Non-GAAP and Other Financial Measures". |
|
** Capital management and leverage measures are in accordance with OSFI's Capital Adequacy Requirements |
|
and Basel III Accord. |
Business Outlook
VersaBank is active in underserved banking markets in Canada and the US that support more attractive pricing for its lending products, and further, continues to develop and expand its diverse deposit gathering network that provides efficient access to a range of low-cost deposit sources. In addition, VersaBank remains highly committed to, and focused on further developing and enhancing its technology advantage, a key component of its value proposition that not only provides efficient access to VersaBank’s chosen underserved lending and deposit markets, but also delivers superior financial products and better customer service to its clients.
Management continues to monitor the geo-political, economic and financial market risk precipitated by the conflict in Ukraine and its potential impact on VersaBank’s business. At this time, management has not identified any material direct or indirect risk exposure to VersaBank resulting from the conflict and will continue to assess available information and evaluate the situation as it evolves.
While VersaBank does not provide guidance on specific performance metrics, the commentary provided below discusses aspects of VersaBank’s business and certain expected trends related to same that, in management’s view, could potentially impact future performance.
Lending Assets
|
Canadian Point-of-Sale Financing: Consumer spending and business investment in Canada are expected to slow over the remainder of calendar 2022 and into 2023 as a function primarily of rising interest rates combined with persistent inflation. Notwithstanding the above, management anticipates that consumers will continue to spend, albeit at a tempered rate relative to 2022 in the various sectors to which the Bank provides POS financing supported to some extent by residual savings accumulated over the course of the pandemic. This consumer behaviour, combined with the anticipated addition of new origination partners in Canada, is expected to contribute to continued strong growth in the Bank’s POS Financing portfolio in fiscal 2023 that is more consistent with pre-fiscal 2022 levels, however, lower than the outsized growth experienced in fiscal 2022; |
|
US Receivable Purchase Program: Despite elevated inflation, higher gas prices and supply chain disruptions in the US, continued momentum in the job market and higher wages are expected to mitigate material declines in consumer spending, which in turn will support stable demand for durable goods and agricultural products which is expected to continue to stimulate transportation equipment purchases. Additionally, despite a cooling of the residential home market in the US, overall construction activity is expected to continue to expand modestly in the coming year, including residential homes, rental apartments, commercial properties, and public infrastructure which is anticipated to support demand for construction equipment in the near term. Moreover, despite higher borrowing costs and inflation, pent-up demand is anticipated to be sufficient to support manufacturers continuing to invest in process and equipment productivity initiatives in order to fulfil the current pipeline of orders in several end-use markets, including industrial machinery, materials handling equipment, and construction equipment. Management is of the view that the anticipated US macroeconomic and industry trends set out above will be supportive of healthy balance sheet growth in the US over the course of fiscal 2023 via the Bank’s RPP, which will be focused on the provision of commercial equipment financing over the course of the same period. The Bank’s RPP launched in a limited manner in the second quarter of fiscal 2022 with a large, North American, commercial transportation financing business focused on independent owner/operators; and, |
| |
Commercial Real Estate: Management anticipates modest growth in the commercial mortgage sector specifically related to financing for residential housing properties over the course of fiscal 2023. Notwithstanding the highly effective risk mitigation strategies that are employed in managing this portfolio, including working with well-established, well-capitalized partners and maintaining modest loan-to-value ratios on individual transactions, management has taken a cautionary stance with respect to the CRE portfolio due to the anticipation of volatility in CRE asset valuations in a rising interest rate environment and the potential impact of same on borrowers’ ability to service debt, as well as due to concerns related to inflation and higher input costs, which continue to have the potential to drive higher construction costs. Additionally, management anticipates more meaningful participation in the B-20 compliant conventional, uninsured mortgage financing space, however, does not expect this lending activity to impact the Bank’s balance sheet until early fiscal 2023. |
Credit Quality
|
VersaBank lends to underserved markets that support more attractive pricing for its lending products but typically exhibit a lower-than-average risk profile generally as a function of the lower inherent risk associated with the underlying collateral assets and/or the structure of VersaBank’s offered financing arrangements; |
|
As at October 31, 2022, the Bank held one impaired loan totalling $279,000, which was subsequently fully repaid on November 1, 2022, and no delinquent loans on the balance sheet. The Bank continues to closely monitor its lending portfolio and origination partners, as well as the underlying borrowers, to ensure that management has good visibility on any credit trends that could provide an early warning indication of the emergence of any elevated risk in the lending portfolio; |
|
Available forward-looking macroeconomic and industry data are biased towards the negative. As a result, management anticipates that credit risk in its portfolio may increase modestly over the course of fiscal 2023 as a function primarily of continued, anticipated tightening of monetary policy in both Canada and the US and the ability of consumers and businesses to service debt at higher interest rates, the impact of elevated inflation and the effectiveness of strong labour markets and higher wages on mitigating same as well as geo-political risk derived from the continued crisis in Ukraine and the residual impact of the crisis on global supply chains. Notwithstanding the above, management also expects that the lower risk profile of VersaBank’s lending portfolio, which is a function of VersaBank’s prudent underwriting practices, structured lending products and focus on underserved financing markets within which it has a wealth of experience, will mitigate any escalation in forward credit risk in Bank’s lending portfolio; and, |
|
VersaBank has sourced credit risk modeling systems and forecast macroeconomic scenario data from Moody’s Analytics, a third-party service provider, for the purpose of computing forward-looking credit risk parameters under multiple macroeconomic scenarios that consider both market-wide and idiosyncratic factors and influences. These credit risk modeling systems are used in conjunction with VersaBank’s internally developed expected credit loss (“ECL”) models. Given that the Bank has experienced very limited historical losses and, therefore, does not have available statistically significant loss data inventory for use in developing internal, forward looking expected credit loss trends, the use of unbiased, third party forward-looking credit risk parameter modeling systems is particularly important for the Bank in the context of the estimation of expected credit losses. As discussed, management notes moderately deteriorating trends in the macroeconomic data currently being used as forward-looking information in VersaBank’s credit risk models and, depending on the growth trajectory and composition of the lending portfolio, these trends could result in higher ECL amounts and the Bank recognizing higher provisions for credit losses in the coming quarters. |
Funding and Liquidity
|
Management expects that commercial deposit volumes raised via VersaBank’s Trustee Integrated Banking (“TIB”) program will grow moderately over the course of fiscal 2023 as a function of an increase in the volume of consumer and commercial bankruptcy and proposal restructuring proceedings over the same timeframe, attributable primarily to a more challenging current and forecasted economic environment. Further, VersaBank continues to grow and expand its well-established, diverse deposit broker network through which it sources personal deposits, consisting primarily of guaranteed investment certificates; and, |
|
Management anticipates that liquidity levels will remain reasonably consistent over the course of fiscal 2023 as VersaBank continues to fund anticipated balance sheet growth across each of its lines of business. Further, management will continue to deploy cash into low risk, liquid securities with the objective of earning a more favourable yield on its available liquidity. |
Earnings and Capital
|
Earnings growth in fiscal 2023 is expected to be a function primarily of anticipated organic balance sheet growth from Digital Banking operations, specifically attributable to the Bank’s POS Financing and RPP businesses in Canada and the US, respectively, as well as incremental earnings contributions from DRTC, offset partially by elevated non-interest expenses early in the 2023 fiscal period attributable to costs related to transitory investment in the Bank’s business development initiatives, including the acquisition and integration of a US national bank, and the ongoing development of the Canadian-dollar version of VersaBank’s Digital Deposit Receipts, which are expected to be substantially completed in the first quarter of fiscal 2023. Additionally, management expects to incur higher costs associated with the recruitment and retention of staff in what remains a highly competitive labour market; |
|
Net interest income growth for fiscal 2023 is expected to be a function primarily of growth in VersaBank’s POS and RPP businesses in Canada and the US, respectively, disciplined liquidity management and the expectation that growth in the TIB program and further expansion of its diverse deposit broker network will have a favourable impact on VersaBank’s cost of funds; |
| |
Non-interest income growth for fiscal 2023 is expected to be a function primarily of DRTC growing revenue from its suite of cybersecurity services; |
| |
VersaBank’s capital ratios remain comfortably in excess of regulatory minimums. Management is of the view that VersaBank’s current capital levels are sufficient to accommodate balance sheet growth contemplated for fiscal 2023. Management will continue to closely monitor the capital markets to identify opportunities for VersaBank to raise additional regulatory capital on attractive terms in order to position VersaBank to support a potentially more robust growth profile in the future; |
|
Management does not anticipate increasing VersaBank’s dividend rate during fiscal 2023 to ensure that it continues to have adequate regulatory capital available to support contemplated balance sheet growth, as well as specific business development initiatives for earnings growth currently contemplated over the same timeframe and remain in compliance with its established regulatory capital ratio targets and thresholds; and, |
|
During the fourth quarter of fiscal 2022, VersaBank received approval from the TSX and Nasdaq to proceed with a NCIB for its common shares through which the Bank may purchase for cancellation up to 1,700,000 of its common shares, representing approximately 9.54% of its public float. If fully executed, the impact of the NCIB will not have a material impact on the Bank’s regulatory capital levels and ratios. The Bank had repurchased 195,300 shares under the NCIB as at October 31, 2022. |
There is potential that VersaBank may not realize or achieve the anticipated performance trends set out above as a function of a number of factors and variables including, but not limited to, the strength of the Canadian and US economies in general and the strength of the local economies in which VersaBank conducts operations; the effects of changes in monetary and fiscal policy, including changes in the interest rate policies of the Bank of Canada and the US Federal Reserve; global commodity prices; the effects of competition in the markets in which VersaBank operates; inflation; capital market fluctuations; the timely development and introduction of new products in receptive markets; the ability of VersaBank to grow its business and execute its strategy in the US market; the impact of changes in the laws and regulations regulating financial services; the impact of wars or conflicts including the crisis in Ukraine; and the impact of new variants of COVID-19 on the economy. Please see “Cautionary Note Regarding Forward-Looking Statements” on page 2 of this MD&A.
Financial Review - Earnings
Total Revenue
Total revenue, consisting of net interest income and non-interest income, increased 26% to $82.4 million compared to last year.
|
(thousands of Canadian dollars) |
||||||||||||
|
October 31 |
October 31 |
|||||||||||
|
For the year ended: |
2022 |
2021 |
Change |
|||||||||
|
Interest income |
||||||||||||
|
Point-of-sale loans and leases |
$ | 78,231 | $ | 48,215 | 62 | % | ||||||
|
Commercial real estate mortgages |
43,571 | 37,950 | 15 | % | ||||||||
|
Commercial real estate loans |
730 | 1,384 | (47 | %) | ||||||||
|
Public sector and other financing |
658 | 506 | 30 | % | ||||||||
|
Other |
3,627 | 1,433 | 153 | % | ||||||||
|
Interest income |
$ | 126,817 | $ | 89,488 | 42 | % | ||||||
|
Interest expense |
||||||||||||
|
Deposit and other |
$ | 44,600 | $ | 26,446 | 69 | % | ||||||
|
Subordinated notes |
5,551 | 2,885 | 92 | % | ||||||||
|
Interest expense |
$ | 50,151 | $ | 29,331 | 71 | % | ||||||
|
Net interest income |
$ | 76,666 | $ | 60,157 | 27 | % | ||||||
|
Non-interest income |
$ | 5,726 | $ | 5,200 | 10 | % | ||||||
|
Total revenue |
$ | 82,392 | $ | 65,357 | 26 | % | ||||||
Net Interest Income
FY 2022 vs FY 2021
Net interest income increased 27% to $76.7 million as a function primarily of:
|
Higher interest income earned on strong lending asset growth, attributable primarily to growth in the Bank’s POS Financing business; |
|
Higher yields earned on floating rate lending assets attributable to rising interest rates; and, |
|
Redeployment of available cash into higher yielding, low risk securities. |
Offset partially by:
|
Higher interest expense attributable to a shift in mix to higher personal deposit balances and rising interest rates; and, |
|
Higher interest expense attributable to the Notes issued in April 2021. |
Net Interest Margin
|
(thousands of Canadian dollars) |
||||||||||||
|
October 31 |
October 31 |
|||||||||||
|
For the year ended: |
2022 |
2021 |
Change |
|||||||||
|
Interest income |
$ | 126,817 | $ | 89,488 | 42 | % | ||||||
|
Interest expense |
50,151 | 29,331 | 71 | % | ||||||||
|
Net interest income |
76,666 | 60,157 | 27 | % | ||||||||
|
Average assets |
$ | 2,840,542 | $ | 2,179,486 | 30 | % | ||||||
|
Yield* |
4.47 | % | 4.11 | % | 9 | % | ||||||
|
Cost of funds* |
1.77 | % | 1.35 | % | 31 | % | ||||||
|
Net interest margin* |
2.70 | % | 2.76 | % | (2% | ) | ||||||
|
Average gross loans |
$ | 2,538,094 | $ | 1,873,227 | 35 | % | ||||||
|
Net interest margin on loans* |
3.08 | % | 3.35 | % | (8% | ) | ||||||
|
* See definition in "Non-GAAP and Other Financial Measures" section below. |
FY 2022 vs FY 2021
Net interest margin decreased 6 bps to 2.70% due primarily to:
|
Higher cost of funds attributable to a shift in the Bank’s funding mix and rising interest rates; |
|
A full year of interest expense attributable to the Notes issued in April 2021; and, |
|
The Bank successfully executing on its strategy to grow its POS Financing portfolio. |
Offset partially by:
|
Higher yields earned on the Bank’s lending portfolio, generally as a function of rising interest rates over the reporting period; |
|
Management adjusting the Bank’s liquidity management strategy to optimize average liquid/total asset ratios; and, |
|
Redeployment of available cash into higher yielding, low-risk securities. |
Non-Interest Income
Non-interest income is comprised of the consolidated gross profit generated by DRTC’s cybersecurity services business, or more specifically the gross profit of DBG as well as income derived from miscellaneous transaction fees not directly attributable to lending assets.
Non-interest income for the year ended October 31, 2022 was $5.7 million compared with $5.2 million a year ago and was comprised substantially of the consolidated gross profit of DBG of $5.6 million realized on service revenues of $9.8 million which were up 8% and 14% year over year respectively. The year over year trend was a function primarily of higher client engagement at DBG and the comparative period including only eleven months of operations due to the timing of the acquisition of DBG on November 30, 2020.
Provision for Credit Losses
|
(thousands of Canadian dollars) |
||||||||
|
October 31 |
October 31 |
|||||||
|
For the year ended: |
2022 |
2021 |
||||||
|
Provision for (recovery of) credit losses by lending asset: |
||||||||
|
Point-of-sale loans and leases |
$ | 270 | $ | 60 | ||||
|
Commercial real estate mortgages |
173 | (252 | ) | |||||
|
Commercial real estate loans |
9 | (92 | ) | |||||
|
Public sector and other financing |
(1 | ) | (154 | ) | ||||
|
Total provision for (recovery of) credit losses |
$ | 451 | $ | (438 | ) | |||
FY 2022 vs FY 2021
Provision for credit losses and the resulting PCL ratio were $451,000 and 0.02%, respectively, compared with a recovery of credit losses and PCL ratio of $438,000 and -0.02%, respectively, last year. The recovery recorded last year was attributable primarily to changes in the Bank’s lending asset portfolio mix, a partial recovery of a previously impaired asset in the amount of $116,000 and changes in the forward-looking information used in the Bank’s credit risk models in the period. The current year over year trend was a function primarily of:
|
Higher lending asset balances in the current period; and, |
|
Changes in the forward-looking information used by the Bank in its credit risk models in the current period. |
Non-Interest Expenses
|
(thousands of Canadian dollars) |
||||||||||||
|
October 31 |
October 31 |
|||||||||||
|
For the year ended: |
2022 |
2021 |
Change |
|||||||||
|
Salaries and benefits |
$ | 26,796 | $ | 20,243 | 32 | % | ||||||
|
General and administrative |
18,732 | 11,110 | 69 | % | ||||||||
|
Premises and equipment |
3,865 | 3,653 | 6 | % | ||||||||
|
Total non-interest expenses |
$ | 49,393 | $ | 35,006 | 41 | % | ||||||
|
Efficiency Ratio* |
59.95 | % | 53.56 | % | 12 | % | ||||||
|
* See definition in "Non-GAAP and Other Financial Measures". |
FY 2022 vs FY 2021
Non-interest expenses were up 41% to $49.4 million as a function primarily of:
|
Costs related to transitory investment in certain business development initiatives including, but not limited to, the planned acquisition of a US national bank, the development and initial launch of the US RPP, which will be offered broadly through the Bank’s US subsidiary on closing, and the ongoing development of the Canadian-dollar version of VersaBank’s Digital Deposit Receipts totaling $5.2 million, ($0.16 per share on an after tax basis). Investments associated with the acquisition and integration of the operations of the US national bank, including development of the RPP, are anticipated to be substantially completed by the end of the first quarter of fiscal 2023; |
|
Higher insurance premiums attributable to VersaBank’s listing on the Nasdaq in September 2021, which will reduce by 56% in 2023 as a result of management establishing the same comprehensive coverage through a new relationship with a financial institution-focused US insurance broker; |
|
Higher salary and benefits expense attributable to higher staffing levels to support expanded revenue-generating business activity across VersaBank and higher costs associated with employee retention totaling $2.6 million; and, |
|
Higher office and facility related costs attributable to the implementation of VersaBank’s return-to-work strategy. |
Tax Provision
The Bank’s effective tax rate for the current year was approximately 30% compared with approximately 27% in the prior year. The incremental increase in the Bank’s effective tax rate in the current year was attributable primarily to higher non-deductible expenses associated with employee stock options, which were issued as part of the Bank’s employee retention program early in the current year, and unrecognized non-capital losses, as well as temporary, incremental tax associated with initial limited launch of the Bank’s RPP in the US ahead of the planned acquisition of a US national bank. Provision for income taxes for fiscal 2022 was $9.9 million compared with $8.4 million last year. Management anticipates that the effective tax rate experienced in the current year will be reduced in fiscal 2023.
Comprehensive Income
Comprehensive income is comprised of net income for the period and other comprehensive income which consists of unrealized gains and losses on fair value through other comprehensive income associated with the foreign exchange gain or loss on translation of foreign operations. Comprehensive income for the year was $22.8 million compared to $22.4 million last year.
Financial Review – Balance Sheet
|
(thousands of Canadian dollars) |
||||||||||||
|
October 31 |
October 31 |
|||||||||||
|
2022 |
2021 |
Change |
||||||||||
|
Total assets |
$ | 3,265,998 | $ | 2,415,086 | 35 | % | ||||||
|
Cash and securities |
230,145 | 271,523 | (15 | %) | ||||||||
|
Loans, net of allowance for credit losses |
2,992,678 | 2,103,050 | 42 | % | ||||||||
|
Deposits |
2,657,540 | 1,853,204 | 43 | % | ||||||||
Total Assets
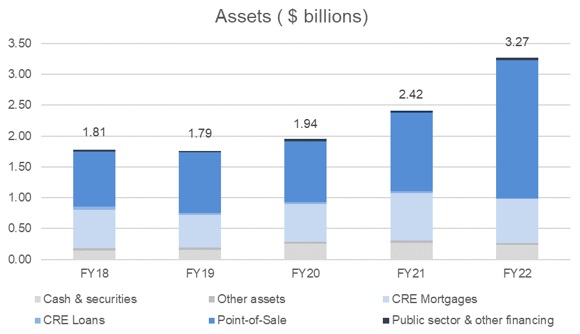
Total assets were up 35% to $3.27 billion at October 31, 2022 attributable primarily to strong growth in the Bank’s POS Financing portfolio, which was up 74% year over year offset partially by a modest decline in the Bank’s Commercial Real Estate portfolio.
Cash and securities
Cash and securities, which are held primarily for liquidity purposes, at October 31, 2022 was $230.1 million, or 7% of total assets, compared with $271.5 million, or 11% of total assets a year ago. The year over year decrease was a function primarily of the deployment of cash into higher yielding lending assets over the course of the 2022 fiscal year.
As at October 31, 2022, the Bank held securities totalling $141.6 million (2021 - $nil), comprised of a series of Government of Canada Treasury Bills and a US Government Treasury Bill. The series of Government of Canada Treasury Bills were purchased for $116.5 million with a face value totaling $117.5 million, resulting in a weighted average yield of 3.10% on the instruments, and with maturities ranging from November 8, 2022 to May 25, 2023. The US Government Treasury Bill was purchased for USD $17.99 million ($24.5 million) with a face value of USD $18.0 million ($24.6 million), resulting in a yield of 2.64% and maturing on November 8, 2022.
Loans
|
(thousands of Canadian dollars) |
||||||||||||
|
October 31 |
October 31 |
|||||||||||
|
2022 |
2021 |
Change |
||||||||||
|
Point-of-sale loans and leases |
$ | 2,220,894 | $ | 1,279,576 | 74 | % | ||||||
|
Commercial real estate mortgages |
710,369 | 757,576 | (6 | %) | ||||||||
|
Commercial real estate loans |
13,165 | 26,569 | (50 | %) | ||||||||
|
Public sector and other financing |
35,452 | 32,587 | 9 | % | ||||||||
| $ | 2,979,880 | $ | 2,096,308 | 42 | % | |||||||
VersaBank organizes its lending portfolio into the following four broad asset categories: Point-of-Sale Loans & Leases, Commercial Real Estate Mortgages, Commercial Real Estate Loans, and Public Sector and Other Financing. These categories have been established in VersaBank’s proprietary, internally developed asset management system and have been designed to catalogue individual lending assets as a function primarily of their key risk drivers, the nature of the underlying collateral, and the applicable market segment.
The Point-of-Sale Loans and Leases (“POS Financing”) asset category is composed of Point-of-Sale Loan and Lease Receivables acquired from VersaBank’s broad network of origination and servicing partners as well as Warehouse Loans that provide bridge financing to VersaBank’s origination and servicing partners for the purpose of accumulating and seasoning practical volumes of individual loans and leases prior to VersaBank purchasing the cashflow receivables derived from same.
The Commercial Real Estate Mortgages (“CRE Mortgages”) asset category is comprised of Commercial and Residential Construction Mortgages, Commercial Term Mortgages, Commercial Insured Mortgages and Land Mortgages. While all of these loans would be considered commercial loans or business-to-business loans, the underlying credit risk exposure is diversified across both the commercial and retail market segments, and further, the portfolio benefits from diversity in its underlying security in the form of a broad range of collateral properties.
The Commercial Real Estate Loans (“CRE Loans”) asset category is comprised primarily of Condominium Corporation Financing loans.
The Public Sector and Other Financing (“PSOF”) asset category is comprised primarily of Public Sector Loans and Leases, a small balance of Corporate Loans and Leases and Single Family Residential Conventional and Insured Mortgages. VersaBank has de-emphasized Corporate lending and continues to monitor the public sector space in anticipation of more robust demand for Federal, Provincial and Municipal infrastructure and other project financings.
FY 2022 vs FY 2021
Loans increased 42% to $2.99 billion as a function primarily of:
|
|
Higher POS Financing balances, which increased 74% year over year as a function primarily of continued strong demand for home finance, and home improvement/HVAC receivable financing. |
Offset partially by:
|
Lower CRE balances attributable primarily to scheduled repayments and a more conservative loan origination strategy in light of the evolving, challenging macroeconomic environment. |
Residential Mortgage Exposures
In accordance with the Office of the Superintendent of Financial Institutions (“OSFI”) Guideline B-20 – Residential Mortgage Underwriting Practices and Procedures, additional information is provided regarding the Bank’s residential mortgage exposure. For the purposes of the Guideline, a residential mortgage is defined as a loan to an individual that is secured by residential property (one-to-four-unit dwellings) and includes home equity lines of credit (“HELOCs”). This differs from the classification of residential mortgages used by the Bank which also includes multi-family residential mortgages.
Under OSFI’s definition, the Bank’s exposure to residential mortgages at October 31, 2022, was $4.0 million compared to $2.7 million a year ago. The Bank did not have any HELOCs outstanding at October 31, 2022, or a year ago.
Credit Quality and Allowance for Credit Losses
As discussed previously, at October 31, 2022, the Bank had one impaired loan on its balance sheet totalling $279,000 (October 31, 2021 - $nil). The impaired loan was fully repaid on November 1, 2022. Despite this impeccable credit performance we continue to monitor our lending assets, as well as the underlying borrowers and our origination partners closely to ensure that we have good visibility on any credit trends that could provide an early warning indication of the emergence of any elevated risk in our lending portfolio.
Allowance for Credit Losses
The Bank must maintain an allowance for expected credit losses or ECL allowance that is adequate, in management’s opinion, to absorb all credit related losses in the Bank’s lending and treasury portfolios. Under IFRS 9 the Bank’s ECL allowance is estimated using the expected credit loss methodology and is comprised of expected credit losses recognized on both performing loans, and non-performing, or impaired loans even if no actual loss event has occurred.
|
(thousands of Canadian dollars) |
||||||||||||
|
October 31 |
October 31 |
|||||||||||
|
2022 |
2021 |
Change |
||||||||||
|
ECL allowance by lending asset: |
||||||||||||
|
Point-of-sale loans and leases |
$ | 545 | $ | 275 | 98 | % | ||||||
|
Commercial real estate mortgages |
1,287 | 1,114 | 16 | % | ||||||||
|
Commercial real estate loans |
54 | 45 | 20 | % | ||||||||
|
Public sector and other financing |
18 | 19 | (5 | %) | ||||||||
|
Total ECL allowance |
$ | 1,904 | $ | 1,453 | 31 | % | ||||||
|
(thousands of Canadian dollars) |
||||||||||||
|
October 31 |
October 31 |
|||||||||||
|
2022 |
2021 |
Change |
||||||||||
|
ECL allowance by stage: |
||||||||||||
|
ECL allowance stage 1 |
$ | 1,766 | $ | 1,316 | 34 | % | ||||||
|
ECL allowance stage 2 |
138 | 137 | 1 | % | ||||||||
|
ECL allowance stage 3 |
- | - | ||||||||||
|
Total ECL allowance |
$ | 1,904 | $ | 1,453 | 31 | % | ||||||
The Bank’s ECL allowance at October 31, 2022 was $1.9 million compared to $1.5 million a year ago. The year over year trend was a function primarily of:
|
Higher lending asset balances; and, |
|
Changes in the forward-looking information used by VersaBank in its credit risk models. |
Offset partially by:
|
Changes in VersaBank’s lending asset portfolio mix. |
The Bank’s gross impaired loans at October 31, 2022 were $279,000 (October 31, 2021 – $nil).
Assessment of significant increase in credit risk (“SICR”)
At each reporting date, the Bank assesses whether or not there has been a SICR for loans since initial recognition by comparing, at the reporting date, the risk of default occurring over the remaining expected life against the risk of default at initial recognition.
SICR is a function of the loan’s internal risk rating assignment, internal watchlist status, loan review status and delinquency status which are updated as necessary in response to changes including, but not limited to, changes in macroeconomic and/or market conditions, changes in a borrower’s credit risk profile, and changes in the strength of the underlying security, including guarantor status, if a guarantor exists.
Quantitative models may not always be able to capture all reasonable and supportable information that may indicate a SICR. As a result, qualitative factors may be considered to supplement such a gap. Examples include changes in adjudication criteria for a particular group of borrowers or asset categories or changes in portfolio composition as well as changes in Canadian and US macroeconomic trends attributable to changes in monetary policy, inflation, employment rates, consumer behaviour and geo-political risks.
Expected credit loss model – Estimation of expected credit losses
Expected credit losses are an estimate of a loan’s expected cash shortfalls discounted at the effective interest rate, where a cash shortfall is the difference between the contractual cash flows that are due to the Bank and the cash flows that the Bank actually expects to receive.
Forward-Looking Information
The Bank incorporates the impact of future economic conditions, or more specifically forward-looking information into the estimation of expected credit losses at the credit risk parameter level. This is accomplished via the credit risk parameter models and proxy datasets that the Bank utilizes to develop probability of default, (“PD”) and loss given default, (“LGD”) term structure forecasts for its loans. The Bank has sourced credit risk modeling systems and forecast macroeconomic scenario data from Moody’s Analytics, a third party service provider for the purpose of computing forward-looking credit risk parameters under multiple macroeconomic scenarios that consider both market-wide and idiosyncratic factors and influences. These systems are used in conjunction with the Bank’s internally developed ECL models. Given that the Bank has experienced very limited historical losses and, therefore, does not have available statistically significant loss data inventory for use in developing internal, forward looking expected credit loss trends, the use of unbiased, third party forward-looking credit risk parameter modeling systems is particularly important for the Bank in the context of the estimation of expected credit losses.
The Bank utilizes macroeconomic indicator data derived from multiple macroeconomic scenarios in order to mitigate volatility in the estimation of expected credit losses, as well as to satisfy the IFRS 9 requirement that future economic conditions are to be based on an unbiased, probability-weighted assessment of possible future outcomes. More specifically, the macroeconomic indicators set out in the macroeconomic scenarios are used as inputs for the credit risk parameter models utilized by the Bank to sensitize the individual PD and LGD term structure forecasts to the respective macroeconomic trajectory set out in each of the scenarios (see Expected Credit Loss Sensitivity below). Currently the Bank utilizes upside, downside and baseline forecast macroeconomic scenarios, and assigns discrete weights to each for use in the estimation of its reported ECL. The Bank has also applied expert credit judgement, where appropriate, to reflect, amongst other items, uncertainty in the Canadian and US macroeconomic environments.
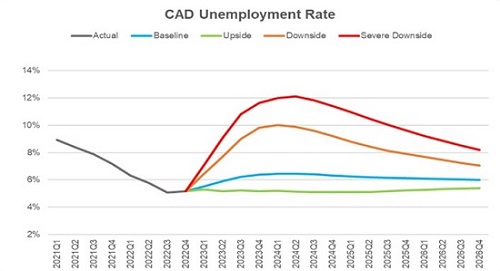
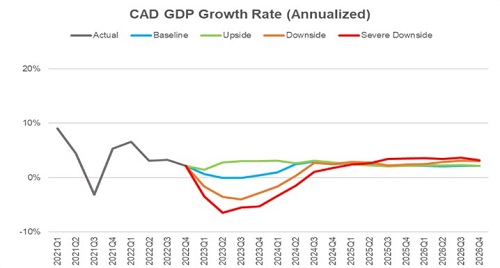
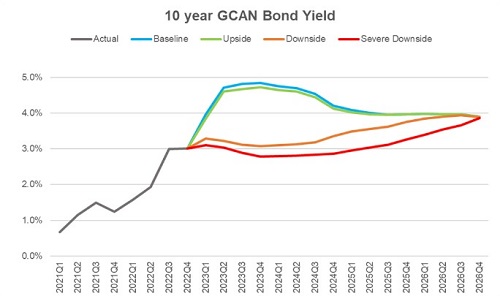
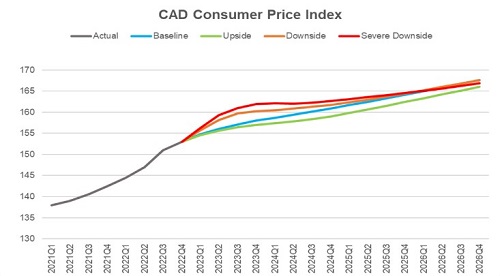
The macroeconomic indicator data utilized by the Bank for the purpose of sensitizing PD and LGD term structure data to forward economic conditions include, but are not limited to: GDP, the national unemployment rate, long term interest rates, the consumer price index, the S&P/TSX Index and the price of oil. These specific macroeconomic indicators were selected in an attempt to ensure that the spectrum of fundamental macroeconomic influences on the key drivers of the credit risk profile of the Bank’s balance sheet, including: corporate, consumer and real estate market dynamics; corporate, consumer and SME borrower performance; geography; as well as collateral value volatility, are appropriately captured and incorporated into the Bank’s forward macroeconomic sensitivity analysis.
Key assumptions driving the base case macroeconomic forecast trends this quarter include: the Bank of Canada, (“BoC”) continuing to tighten monetary policy with the overnight rate reaching 4.5% in early 2023; consumer spending declines and business investment slows as a function primarily of higher rates and persistent inflation; inflation beings to decelerate consistently in early 2023, in line with the anticipated end of the current monetary policy tightening cycle; the housing market continues to cool attributable to higher interest rates which dampen demand, causing home values to continue to decline; a mild technical recession emerges along with rising unemployment in early 2023 as consumption slows and firms dial back their growth plans; public health restrictions do not return even as new COVID-19 case counts occasionally spike through the winter; and, supply-chain stress continues to ease as global vaccination rates improve and good demand softens.
Management developed ECL estimates using credit risk parameter term structure forecasts sensitized to individual baseline, upside and downside forecast macroeconomic scenarios, each weighted at 100%, and subsequently computed the variance of each to VersaBank’s reported ECL as at October 31, 2022 in order to assess the alignment of VersaBank’s reported ECL with VersaBank’s credit risk profile, and further, to assess the scope, depth and ultimate effectiveness of the credit risk mitigation strategies that VersaBank has applied to its lending portfolios (see Expected Credit Loss Sensitivity below).
A summary of the key forecast macroeconomic indicator data trends utilized by VersaBank for the purpose of sensitizing lending asset credit risk parameter term structure forecasts to forward looking information, which in turn are used in the estimation of VersaBank’s reported ECL, as well as in the assessment of same are presented in the charts below.
 |
 |
 |
 |
Expected Credit Loss Sensitivity:
The following table presents the sensitivity of the Bank’s estimated ECL to a range of individual forecast macroeconomic scenarios, that in isolation may not reflect the Bank’s actual expected ECL exposure, as well as the variance of each to the Bank’s reported ECL as at October 31, 2022:
| (thousands of Canadian dollars) | ||||||||||||||||
| Reported | 100% | 100% | 100% | |||||||||||||
| ECL | ||||||||||||||||
| Upside | Baseline | Downside | ||||||||||||||
| Allowance for expected credit losses | $ | 1,904 | $ | 1,350 | $ | 1,786 | $ | 2,474 | ||||||||
| Variance from reported ECL | (554 | ) | (118 | ) | 570 | |||||||||||
| Variance from reported ECL (%) | (29 | %) | (6 | %) | 30 | % | ||||||||||
Management is of the view that forward industry and macroeconomic trends will be biased slightly to the downside as a function of management’s expectation that higher interest rates will continue to pressure consumer and corporate balance sheets in the medium term and supply chain disruptions, albeit diminished will persist into 2023 precipitating continued, elevated inflation levels despite anticipated monetary policy trends. As a result management anticipates that VersaBank’s estimated ECL amounts will exhibit some volatility over the course of fiscal 2023 which may result in the Bank recognizing higher provisions for credit losses in the coming quarters.
Considering the analysis set out above and based on management’s review of the loan and credit data comprising VersaBank’s lending portfolio, combined with management’s interpretation of the available forecast macroeconomic and industry data, management is of the view that its reported ECL allowance represents a reasonable proxy for potential, future losses.
Deposits
VersaBank has established three core funding channels, those being personal deposits, commercial deposits, and cash reserves retained from VersaBank’s POS Financing origination partners that are classified as other liabilities, which are discussed in the Other Assets and Liabilities section below.
|
(thousands of Canadian dollars) |
||||||||||||
|
October 31 |
October 31 |
|||||||||||
|
2022 |
2021 |
Change |
||||||||||
|
Commercial deposits |
$ | 598,413 | $ | 606,143 | (1 | %) | ||||||
|
Personal deposits |
2,059,127 | 1,247,061 | 65 | % | ||||||||
|
Total deposits |
$ | 2,657,540 | $ | 1,853,204 | 43 | % | ||||||
Personal deposits, consisting principally of guaranteed investment certificates, are sourced primarily through a well-established and well-diversified deposit broker network that the Bank continues to grow and expand across Canada.
Commercial deposits are sourced primarily via specialized operating accounts made available to insolvency professionals (“Trustees”) in the Canadian insolvency industry. The Bank developed customized banking software for use by Trustees that integrates banking services with the market-leading software platform used in the administration of consumer bankruptcy and proposal restructuring proceedings.
FY 2022 vs FY 2021
Deposits increased 43% to $2.7 billion as a function primarily of:
|
|
Higher personal deposits attributable to VersaBank increasing activity in its broker market network to fund balance sheet growth. |
Offset partially by:
|
|
Modestly lower commercial deposits attributable to withdrawals made by Trustees to fund normal course disbursements associated with insolvency restructurings. |
Notwithstanding the year over year commercial deposit trend management expects commercial deposit volumes to grow measurably over the course of fiscal 2023 as a function of an anticipated increase in the volume of consumer bankruptcy and proposal restructuring proceedings over the same timeframe, attributable primarily to a more challenging current and forecasted economic environment.
The table below presents a summary of the Bank’s deposit portfolio by maturity, excluding accrued interest at October 31, 2022 as well as for 2021:
|
2022 |
||||||||||||||||||||||||
|
Within 3 |
3 months to |
1 year to |
2 years to |
Over |
||||||||||||||||||||
|
(thousands of Canadian dollars) |
months |
1 year |
2 years |
5 years |
5 years |
Total |
||||||||||||||||||
|
Commercial deposits |
$ | 598,413 | $ | - | $ | - | $ | - | $ | - | $ | 598,413 | ||||||||||||
|
Personal deposits |
184,686 | 904,664 | 529,806 | 412,739 | 331 | 2,032,226 | ||||||||||||||||||
| $ | 783,099 | $ | 904,664 | $ | 529,806 | $ | 412,739 | $ | 331 | $ | 2,630,639 | |||||||||||||
|
2021 |
||||||||||||||||||||||||
|
Within 3 |
3 months to |
1 year to |
2 years to |
Over |
||||||||||||||||||||
|
(thousands of Canadian dollars) |
months |
1 year |
2 years |
5 years |
5 years |
Total |
||||||||||||||||||
|
Commercial deposits |
$ | 606,143 | $ | - | $ | - | $ | - | $ | - | $ | 606,143 | ||||||||||||
|
Personal deposits |
150,323 | 399,376 | 272,782 | 411,649 | - | 1,234,130 | ||||||||||||||||||
| $ | 756,466 | $ | 399,376 | $ | 272,782 | $ | 411,649 | $ | - | $ | 1,840,273 | |||||||||||||
Subordinated Notes Payable
|
(thousands of Canadian dollars) |
||||||||
|
October 31 |
October 31 |
|||||||
|
2022 |
2021 |
|||||||
|
Ten year term, unsecured, non-viability contingent capital compliant, subordinated notes payable, principal amount of $5.0 million, effective interest rate of 10.41%, maturing March 2029. |
$ | 4,908 | $ | 4,898 | ||||
|
Ten year term, unsecured, non-viability contingent capital compliant, subordinated notes payable, principal amount of USD $75.0 million, effective interest rate of 5.38%, maturing May 2031. |
100,043 | 90,374 | ||||||
| $ | 104,951 | $ | 95,272 | |||||
Subordinated notes payable, net of issue costs, were $105.0 million at October 31, 2022, compared to $95.3 million a year ago. The year over year trends was a function primarily of changes in the USD/CAD foreign exchange spot rate.
On April 30, 2021, the Bank completed a private placement with US institutional investors of NVCC compliant fixed to floating rate subordinated notes payable in the principal amount of USD $75.0 million, equivalent to CAD $92.1 million as at April 30, 2021. Interest will be paid on the Notes semi-annually in arrears on May 1 and November 1 of each year, commencing on November 1, 2021, at a fixed rate of 5.00% per year, until May 1, 2026. Thereafter, if not redeemed by the Bank, the Notes will have a floating interest rate payable at the 3-month Bankers’ Acceptance Rate plus 361 basis points, payable quarterly in arrears, on February 1, May 1, August 1 and November 1 of each year, commencing August 1, 2026, until the maturity date. The Notes will mature on May 1, 2031, unless earlier repurchased or redeemed in accordance with their terms. On or after May 1, 2026, the Bank may, at its option, with the prior approval of the Superintendent of Financial Institutions (Canada), redeem the Notes, in whole at any time or in part from time to time on not less than 30 nor more than 60 days’ prior notice, at a redemption price which is equal to par, plus accrued and unpaid interest. Issue costs associated with the Notes were approximately CAD $2.6 million.. Egan-Jones Ratings Company assigned the Notes and the Bank an “A-” and “A” rating respectively, at the time of the private placement.
$500,000 of the Bank’s $5.0 million subordinated notes payable, issued in March 2019, are held by a related party (see note 19 to the Consolidated Financial Statements for additional information on related party transactions and balances).
Other Assets and Liabilities
Other Assets
|
(thousands of Canadian dollars) |
||||||||||||
|
October 31 |
October 31 |
|||||||||||
|
2022 |
2021 |
Change |
||||||||||
|
Accounts receivable |
$ | 3,774 | $ | 2,643 | 43 | % | ||||||
|
Prepaid expenses and other |
16,391 | 12,699 | 29 | % | ||||||||
|
Property and equipment |
6,868 | 7,075 | (3 | %) | ||||||||
|
Right-of-use assets |
4,122 | 4,817 | (14 | %) | ||||||||
|
Deferred income tax asset |
2,128 | 2,931 | (27 | %) | ||||||||
|
Investment |
953 | 953 | 0 | % | ||||||||
|
Goodwill |
5,754 | 5,754 | 0 | % | ||||||||
|
Intangible assets |
3,185 | 3,641 | (13 | %) | ||||||||
|
Total other assets |
$ | 43,175 | $ | 40,513 | 7 | % | ||||||
FY 2022 vs FY 2021
Other assets were up 7% to $43.2 million as a function primarily of:
|
Higher prepaid expenses and other attributable primarily to the capitalization of compensation costs and various costs relating to business development initiatives; and, |
|
Higher accounts receivable attributable primarily to the normal course timing of general corporate receivables. |
Offset partially by:
|
Lower capitalized assets due to amortization; and, |
|
Lower deferred income tax asset primarily attributable to timing differences in the recognition of certain deferred income tax amounts. |
Other Liabilities
|
(thousands of Canadian dollars) |
||||||||||||
|
October 31 |
October 31 |
|||||||||||
|
2022 |
2021 |
Change |
||||||||||
|
Accounts payable and other |
$ | 7,662 | $ | 6,893 | 11 | % | ||||||
|
Current income tax liability |
5,797 | 2,949 | 97 | % | ||||||||
|
Deferred income tax liability |
786 | 898 | (12 | %) | ||||||||
|
Lease obligations |
4,471 | 5,113 | (13 | %) | ||||||||
|
Cash collateral and amounts held in escrow |
8,006 | 7,887 | 2 | % | ||||||||
|
Cash reserves on loan and lease receivables |
126,110 | 110,764 | 14 | % | ||||||||
|
Total other liabilities |
$ | 152,832 | $ | 134,504 | 14 | % | ||||||
FY 2022 vs FY 2021
Other liabilities were up 14% to $152.8 million as a function primarily of:
|
|
VersaBank recognizing higher current income taxes payable in current fiscal year after utilizing the bulk of the Bank’s available income tax loss carryforwards in the prior fiscal year; |
|
Higher cash reserve balances attributable to higher POS Financing portfolio balances; and, |
|
General increase in accounts payable attributable to increased earning activity. |
Shareholders’ Equity
Shareholders’ equity was $350.7 million at October 31, 2022 compared to $332.1 million a year ago. The year over year trend was a function primarily of:
|
Higher retained earnings attributable to net income earned over the course of the year; and, |
|
Higher contributed surplus attributable to the fair value of the stock-based compensation. |
Offset partially by:
|
The purchase and cancellation of common shares pursuant to the Bank’s NCIB; and, |
|
Payment of dividends. |
The summary of the Banks’ issued and outstanding share capital is as follows:
| (thousands of Canadian dollars) | ||||||||||||||||
| 2022 | 2021 | |||||||||||||||
| Shares | Amount | Shares | Amount | |||||||||||||
| Common shares: | ||||||||||||||||
| Balance, beginning of the year | 27,441,082 | $ | 227,674 | 21,123,559 | $ | 152,612 | ||||||||||
| Issued during the year | - | - | 6,325,000 | 75,101 | ||||||||||||
| Cancelled during the year | (195,300 | ) | (1,692 | ) | (7,477 | ) | (39 | ) | ||||||||
| Outstanding, end of year | 27,245,782 | $ | 225,982 | 27,441,082 | $ | 227,674 | ||||||||||
| Series 1 preferred shares: | ||||||||||||||||
| Outstanding, beginning and end of year | 1,461,460 | $ | 13,647 | 1,461,460 | $ | 13,647 | ||||||||||
| Series 3 perferred shares: | ||||||||||||||||
| Balance, beginning of the year | - | $ | - | 1,681,320 | $ | 15,690 | ||||||||||
| Redemption of preferred shares | - | - | (1,681,320 | ) | (15,690 | ) | ||||||||||
| Outstanding, end of year | - | $ | - | - | $ | - | ||||||||||
| Total share capital | 0 | $ | 239,629 | 0 | $ | 241,321 | ||||||||||
On August 5, 2022, the Bank received approval from the TSX to proceed with a NCIB for its common shares. On September 21, 2022, the Bank received approval from the Nasdaq to proceed with a NCIB for its common shares. Pursuant to the NCIB, VersaBank may purchase for cancellation up to 1,700,000 of its common shares representing approximately 9.54% of its public float. VersaBank’s directors and management believe that the market price of VersaBank’s common shares does not reflect the value of the business and the future prospects of same, and further, reflects a material discount to book value and as such the purchase of common shares for cancellation at such time is a prudent corporate measure and represents an attractive investment for the Bank.
The Bank was eligible to makes purchases commencing on August 17, 2022 and will terminate on August 16, 2023, or such earlier date as VersaBank may complete its purchases pursuant to the NCIB. The purchases will be made by VersaBank through the facilities of the TSX and alternate trading systems and in accordance with the rules of the TSX or such alternate trading systems, as applicable, and the prices that VersaBank will pay for any Common Shares will be the market price of such shares at the time of acquisition. VersaBank will make no purchases of Common Shares other than open market purchases. All shares purchased under the NCIB will be cancelled.
For the year ended October 31, 2022, the Bank purchased and cancelled 195,300 Common Shares at an aggregate cost of $1.9 million, reducing the Bank’s Common Share value by $1.7 million and retained earnings by $238,000.
On October 7, 2021, the Bank cancelled, and returned to treasury, 7,477 common shares with a value of $39,000 or $5.24 per common share. The cancelled shares represent predecessor share classes which had not been deposited and exchanged for VersaBank common shares in connection with the Bank’s amalgamation with PWC Capital Inc. on January 31, 2017.
On September 21, 2021 the Bank completed a treasury offering of 5,500,000 common shares at a price of USD $10.00 per share, the equivalent of CAD $12.68 per share for gross proceeds of USD $55.0 million. On September 29, 2021, the underwriters of the aforementioned offering exercised their full over-allotment option to purchase an additional 825,000 shares (15% of the 5,500,000 common shares issued via the base offering referenced above) at a price of USD $10.00 per share, or CAD $12.74 per share for gross proceeds of USD $8.3 million. Total net cash proceeds from the Common Share Offering was CAD $73.2 million. However, the Bank’s share capital increased by CAD $75.1 million as a function of the Common Share Offering and tax effected issue costs of CAD $5.4 million. The Bank’s issue costs are subject to current and future tax deductions and as such the Bank has recognized a deferred tax asset corresponding to same.
On April 30, 2021, the Bank redeemed all of its 1,681,320 outstanding, Non-Cumulative Series 3 preferred shares (NVCC) using cash on hand. The amount paid on redemption for each share was $10.00, and in aggregate $16.8 million. The initial capitalized transaction costs of $1.1 million were applied against retained earnings.
The Bank’s book value per common share at October 31, 2022 was $12.37 compared to $11.61 a year ago. The year over year trend was a function primarily of higher retained earnings attributable to net income earned in each of the periods and the purchase and cancellation of common shares pursuant to the Bank’s NCIB, offset partially by the payment of dividends over the respective periods.
See note 12 to the Consolidated Financial Statements for additional information relating to share capital.
Stock-Based Compensation
The Bank has a stock option plan for its employees and officers. Options are granted at an exercise price set at the closing market price of the Bank’s common shares on the day preceding the date on which the option is granted and are exercisable within five years of issue. Options are usually granted with graded vesting terms. One third vests on the first anniversary of the grant date, one third vests on the second anniversary of the grant date and one third vests on the third anniversary of the grant date.
|
2022 |
2021 |
|||||||||||||||
|
Weighted |
Weighted |
|||||||||||||||
|
Number of |
average |
Number of |
average |
|||||||||||||
|
options |
exercise price |
options |
exercise price |
|||||||||||||
|
Outstanding, beginning of period |
40,000 | $ | 7.00 | 42,017 | $ | 10.73 | ||||||||||
|
Granted |
971,707 | 15.90 | - | - | ||||||||||||
|
Exercised |
- | - | - | - | ||||||||||||
|
Forfeited/cancelled |
(45,941 | ) | 15.90 | - | - | |||||||||||
|
Expired |
- | - | (2,017 | ) | 10.73 | |||||||||||
|
Outstanding, end of period |
965,766 | $ | 15.53 | 40,000 | $ | 7.00 | ||||||||||
For the year ended October 31, 2022, the Bank recognized stock-based compensation expense of $1.5 million (2021 - $nil) related to the estimated fair value of options granted. The fair value of the 971,707 stock options granted over the course of the current fiscal year and was estimated at the grant dates using the Black-Scholes valuation model and the following input assumptions: risk-free rate of 1.39%, expected option life of 3.5 years, expected volatility of 29.5%, expected annual dividends of 0.64% and a forfeiture rate of 2.0%. The fair value of each stock options granted were estimated at $3.10 per share. As at October 31, 2022, 40,000 common share stock options were fully vested and exercisable at $7.00 per share and expire in October 2023.
Updated Share Information
Subsequent to October 31, 2022, the Bank purchased and cancelled 17,600 common shares and as at December 6, 2022, the number of common shares outstanding totalled 27,228,182. There were no changes in the number of Series 1 preferred shares and common share options outstanding compared to October 31, 2022.
Off-Balance Sheet Arrangements
As at October 31, 2022, VersaBank did not have any significant off-balance sheet arrangements other than loan commitments and letters of credit attributable to normal course business activities. See note 20 to the Consolidated Financial Statements for more information.
Commitments and Contingencies
The amount of credit related commitments represents the maximum amount of additional credit that the Bank could be obliged to extend. Under certain circumstances, the Bank may cancel loan commitments at its option. Letters of credit amounts are not necessarily indicative of the associated credit risk exposure as many of these secured arrangements are contracted for a limited period of time and will expire or terminate without being drawn upon.
|
(thousands of Canadian dollars) |
2022 |
2021 |
||||||
|
Loan commitments |
$ | 382,851 | $ | 296,248 | ||||
|
Letters of credit |
60,273 | 46,462 | ||||||
| $ | 443,124 | $ | 342,710 | |||||
Contractual Obligations
At October 31, 2022 the Bank had the following scheduled principal repayments of financial liabilities.
|
2022 |
||||||||||||||||||||
|
Less than |
Over |
|||||||||||||||||||
|
(thousands of Canadian dollars) |
Total |
1 Year |
1-2 Years |
2-5 Years |
5 Years |
|||||||||||||||
|
Deposits |
$ | 2,657,540 | $ | 1,714,664 | $ | 529,806 | $ | 412,739 | $ | 331 | ||||||||||
|
Holdbacks payable on loan and lease receivables |
126,110 | 126,110 | - | - | - | |||||||||||||||
|
Subordinated notes payable |
104,951 | - | - | - | 104,951 | |||||||||||||||
|
Accounts payable |
7,662 | 7,662 | - | - | - | |||||||||||||||
|
Cash collateral and amounts held in escrow |
8,006 | 8,006 | - | - | - | |||||||||||||||
|
Current income tax liability |
5,797 | 5,797 | - | - | - | |||||||||||||||
|
Deferred income tax liability |
786 | 150 | 90 | 270 | 276 | |||||||||||||||
|
Lease obligations |
4,471 | 708 | 728 | 1,804 | 1,231 | |||||||||||||||
| $ | 2,915,323 | $ | 1,863,097 | $ | 530,624 | $ | 414,813 | $ | 106,789 | |||||||||||
Related Party Transactions
The Bank’s Board of Directors and Senior Executive Officers represent key management personnel. See note 19 to the Consolidated Financial Statements for more information on transactions entered into with, and the compensation of key management personnel.
Results of Operating Segments
|
(thousands of Canadian dollars) |
||||||||||||||||||||||||||||||||||||||||||||||||
|
for the three months ended |
October 31, 2022 |
July 31, 2022 |
October 31, 2021 |
|||||||||||||||||||||||||||||||||||||||||||||
|
Digital |
DRTC |
Eliminations/ |
Consolidated |
Digital |
DRTC |
Eliminations/ |
Consolidated |
Digital |
DRTC |
Eliminations/ |
Consolidated |
|||||||||||||||||||||||||||||||||||||
| Banking |
Adjustments |
Banking |
Adjustments |
Banking |
Adjustments |
|||||||||||||||||||||||||||||||||||||||||||
|
Net interest income |
$ | 22,477 | $ | - | $ | - | $ | 22,477 | $ | 20,062 | $ | - | $ | - | $ | 20,062 | $ | 16,146 | $ | - | $ | - | $ | 16,146 | ||||||||||||||||||||||||
|
Non-interest income |
38 | 1,778 | (41 | ) | 1,775 | 12 | 1,206 | (41 | ) | 1,177 | (46 | ) | 2,177 | (41 | ) | 2,090 | ||||||||||||||||||||||||||||||||
|
Total revenue |
22,515 | 1,778 | (41 | ) | 24,252 | 20,074 | 1,206 | (41 | ) | 21,239 | 16,100 | 2,177 | (41 | ) | 18,236 | |||||||||||||||||||||||||||||||||
|
Provision for (recovery of) credit losses |
205 | - | - | 205 | 166 | - | - | 166 | (279 | ) | - | - | (279 | ) | ||||||||||||||||||||||||||||||||||
| 22,310 | 1,778 | (41 | ) | 24,047 | 19,908 | 1,206 | (41 | ) | 21,073 | 16,379 | 2,177 | (41 | ) | 18,515 | ||||||||||||||||||||||||||||||||||
|
Non-interest expenses: |
||||||||||||||||||||||||||||||||||||||||||||||||
|
Salaries and benefits |
5,678 | 1,541 | - | 7,219 | 5,600 | 1,168 | - | 6,768 | 4,720 | 687 | - | 5,407 | ||||||||||||||||||||||||||||||||||||
|
General and administrative |
5,113 | 457 | - | 5,570 | 5,217 | 343 | (41 | ) | 5,519 | 3,704 | 311 | (41 | ) | 3,974 | ||||||||||||||||||||||||||||||||||
|
Premises and equipment |
624 | 361 | - | 985 | 610 | 319 | - | 929 | 628 | 368 | - | 996 | ||||||||||||||||||||||||||||||||||||
| 11,415 | 2,359 | - | 13,774 | 11,427 | 1,830 | (41 | ) | 13,216 | 9,052 | 1,366 | (41 | ) | 10,377 | |||||||||||||||||||||||||||||||||||
|
Income (loss) before income taxes |
10,895 | (581 | ) | (41 | ) | 10,273 | 8,481 | (624 | ) | - | 7,857 | 7,327 | 811 | - | 8,138 | |||||||||||||||||||||||||||||||||
|
Income tax provision |
3,939 | (95 | ) | - | 3,844 | 2,099 | 38 | - | 2,137 | 1,907 | 321 | - | 2,228 | |||||||||||||||||||||||||||||||||||
|
Net income (loss) |
$ | 6,956 | $ | (486 | ) | $ | (41 | ) | $ | 6,429 | $ | 6,382 | $ | (662 | ) | $ | - | $ | 5,720 | $ | 5,420 | $ | 490 | $ | - | $ | 5,910 | |||||||||||||||||||||
|
Total assets |
$ | 3,267,479 | $ | 22,345 | $ | (23,826 | ) | $ | 3,265,998 | $ | 3,076,611 | $ | 21,796 | $ | (23,064 | ) | $ | 3,075,343 | $ | 2,411,790 | $ | 22,309 | $ | (19,013 | ) | $ | 2,415,086 | |||||||||||||||||||||
|
Total liabilities |
$ | 2,912,249 | $ | 25,755 | $ | (22,681 | ) | $ | 2,915,323 | $ | 2,725,820 | $ | 24,794 | $ | (21,919 | ) | $ | 2,728,695 | $ | 2,077,643 | $ | 23,205 | $ | (17,868 | ) | $ | 2,082,980 | |||||||||||||||||||||
Digital Banking Operations
FY 2022 vs FY 2021
Digital Banking Operations net income increased 11% year over year as a function of higher revenue attributable primarily to lending asst growth offset partially by higher non-interest expense resulting substantially from investments in VersaBank’s business development initiatives including, but not limited to the acquisition of a US national bank, the development of the RPP, higher provision for credit losses and higher income taxes. Investments associated with the acquisition and integration of the operations of the US national bank, including development of the RPP are anticipated to be realized substantially by the end of the first quarter of fiscal 2023.
DRTC (Cybersecurity Services and Banking and Financial Technology Development)
FY 2022 vs FY 2021
DRTC net loss of $1.5 million in the current year compared to net income of $708,000 in the comparative period was a function primarily of higher costs related to investment in specific growth initiatives including the ongoing development of the Canadian-dollar version of VersaBank’s Digital Deposit Receipts, offset partially by higher revenue.
The segment’s non-interest income was substantially derived from the operations of DBG. DBG services revenue and gross profit were up 14% and 8% year over year to $9.8 million and $5.6 million respectively. These strong year over year trends were a function primarily of higher demand for DBG’s services resulting in higher client engagement and the comparative period including only eleven months of operations due to the timing of the acquisition of DBG on November 30, 2020.
Capital Management and Capital Resources
Capital Management
The Bank’s policy is to maintain a strong capital base so as to maintain investor, creditor and market confidence as well as to support future growth and development of the business. The impact of the level of capital on shareholders’ return is an important consideration and the Bank recognizes the need to maintain a balance between the higher returns that may be possible with greater leverage and the advantages and security afforded by a more robust capital position.
The Bank operates as a Schedule 1 bank under the Bank Act (Canada) and is regulated by the Office of the Superintendent of Financial Institutions Canada (OSFI). Capital is managed in accordance with policies and plans that are regularly reviewed and approved by the Bank’s Board of Directors. The Bank’s objective, in this context, is to maintain adequate regulatory capital for the Bank to be considered well capitalized, protect consumer deposits and provide capacity to support organic growth as well as to capitalize on strategic opportunities that do not otherwise require accessing the public capital markets, all the while providing a satisfactory return to shareholders. Regulatory capital is comprised of the qualifying amount of subordinated notes, share capital, retained earnings and net after-tax unrealized gains and losses on fair value through other comprehensive income securities. Consistent with capital adequacy guidelines issued by OSFI, the Bank has implemented an internal capital adequacy assessment process (ICAAP) with the objective of ensuring that capital levels remain adequate in relation to current and future risks.
The table below presents the Bank’s regulatory capital position, risk-weighted assets and regulatory capital and leverage ratios for the current and comparative periods.
|
(thousands of Canadian dollars) |
||||||||||||
|
October 31 |
October 31 |
|||||||||||
|
2022 |
2021 |
Change |
||||||||||
|
Common Equity Tier 1 capital |
$ | 325,657 | $ | 305,708 | 7 | % | ||||||
|
Total Tier 1 capital |
$ | 339,304 | $ | 319,355 | 6 | % | ||||||
|
Total Tier 2 capital |
$ | 109,271 | $ | 99,363 | 10 | % | ||||||
|
Total regulatory capital |
$ | 448,575 | $ | 418,718 | 7 | % | ||||||
|
Total risk-weighted assets |
$ | 2,714,902 | $ | 2,013,544 | 35 | % | ||||||
|
Capital ratios |
||||||||||||
|
CET1 capital ratio |
12.00 | % | 15.18 | % | (21 | %) | ||||||
|
Tier 1 capital ratio |
12.50 | % | 15.86 | % | (21 | %) | ||||||
|
Total capital ratio |
16.52 | % | 20.80 | % | (21 | %) | ||||||
|
Leverage ratio |
9.84 | % | 12.60 | % | (22 | %) | ||||||
OSFI requires banks to measure capital adequacy in accordance with its guidelines for determining risk-adjusted capital and risk-weighted assets including off-balance sheet credit instruments. The Bank currently uses the Standardized Approach to calculate risk-weighted assets for both credit and operational risk. Under the Standardized Approach for credit risk, each asset type is assigned a risk weight ranging between 0% and 150% to determine the risk-weighted equivalent, or risk-weighted asset amounts for use in calculating the Bank’s risk-based capital ratios. Off-balance sheet assets, such as undrawn credit commitments, are included in the calculation of risk-weighted assets, and further, both the credit risk equivalent and the risk-weighted calculations are prescribed by OSFI. The Standardized Approach, as defined by Basel III, may require the Bank to carry more capital for certain credit exposures compared to requirements under the Advanced Internal Ratings-Based (“AIRB”) methodology. As a result, regulatory capital ratios of banks that utilize the Standardized Approach may not be directly comparable with the large Canadian banks and other international banks that utilize the AIRB methodology.
As at October 31, 2022 and 2021, the Bank was in compliance with all minimum capital ratios prescribed by OSFI.
The tables below present the Bank’s risk-weighted assets as at October 31, 2022 as well as for 2021, organized by asset type and risk weight assignment respectively:
|
As at October 31, 2022 |
Notional/drawn amount by asset type |
|||||||||||||||||||||||
|
Risk |
||||||||||||||||||||||||
|
Loans |
Off -balance |
Weighted |
||||||||||||||||||||||
|
(thousands of Canadian dollars) |
Cash |
& securities |
Other |
sheet items |
Total |
Balance |
||||||||||||||||||
|
Corporate |
$ | - | $ | 957,174 | $ | - | $ | - | $ | 957,174 | $ | 931,860 | ||||||||||||
|
Sovereign |
- | 148,346 | - | - | 148,346 | 1,356 | ||||||||||||||||||
|
Bank |
88,581 | 17,692 | - | - | 106,273 | 21,255 | ||||||||||||||||||
|
Retail residential mortgages |
- | 6,378 | - | - | 6,378 | 1,403 | ||||||||||||||||||
|
Other retail |
- | 2,004,652 | - | - | 2,004,652 | 1,410,294 | ||||||||||||||||||
|
Other items |
- | - | 43,175 | 60,273 | 103,448 | 60,928 | ||||||||||||||||||
|
Undrawn commitments |
- | - | - | 382,851 | 382,851 | 161,598 | ||||||||||||||||||
|
Operational risk ¹ |
- | - | - | - | - | 126,208 | ||||||||||||||||||
|
Total |
$ | 88,581 | $ | 3,134,242 | $ | 43,175 | $ | 443,124 | $ | 3,709,122 | $ | 2,714,902 | ||||||||||||
|
As at October 31, 2021 |
Notional/drawn amount by asset type |
|||||||||||||||||||||||
|
Risk |
||||||||||||||||||||||||
|
Loans |
Off -balance |
Weighted |
||||||||||||||||||||||
|
(thousands of Canadian dollars) |
Cash |
& securities |
Other |
sheet items |
Total |
Balance |
||||||||||||||||||
|
Corporate |
$ | - | $ | 869,413 | $ | - | $ | - | $ | 869,413 | $ | 866,217 | ||||||||||||
|
Sovereign |
- | 9,213 | - | - | 9,213 | 1,843 | ||||||||||||||||||
|
Bank |
271,523 | 17,647 | - | - | 289,170 | 57,834 | ||||||||||||||||||
|
Retail residential mortgages |
- | 5,233 | - | - | 5,233 | 951 | ||||||||||||||||||
|
Other retail |
- | 1,201,544 | - | - | 1,201,544 | 820,638 | ||||||||||||||||||
|
Other items |
- | - | 40,513 | 46,462 | 86,975 | 49,865 | ||||||||||||||||||
|
Undrawn commitments |
- | - | - | 296,248 | 296,248 | 107,925 | ||||||||||||||||||
|
Operational risk ¹ |
- | - | - | - | - | 108,271 | ||||||||||||||||||
|
Total |
$ | 271,523 | $ | 2,103,050 | $ | 40,513 | $ | 342,710 | $ | 2,757,796 | $ | 2,013,544 | ||||||||||||
¹ The charge for operational risk is determined using the Basic Indicator Approach as prescribed by OSFI.
|
As at October 31, 2022 |
Notional/drawn amount by risk weight |
|||||||||||||||||||||||||||||||
|
Risk |
||||||||||||||||||||||||||||||||
|
Weighted |
||||||||||||||||||||||||||||||||
|
(thousands of Canadian dollars) |
0% |
20% |
35% |
75% |
100% |
150% |
Total |
Balance |
||||||||||||||||||||||||
|
Corporate |
$ | 25,314 | $ | - | $ | - | $ | - | $ | 931,860 | $ | - | $ | 957,174 | $ | 931,860 | ||||||||||||||||
|
Sovereign |
141,564 | 6,782 | - | - | - | - | 148,346 | 1,356 | ||||||||||||||||||||||||
|
Bank |
- | 106,273 | - | - | - | - | 106,273 | 21,255 | ||||||||||||||||||||||||
|
Retail residential mortgages |
2,367 | - | 4,011 | - | - | - | 6,378 | 1,403 | ||||||||||||||||||||||||
|
Other retail |
116,880 | 11,100 | - | 1,874,396 | 2,276 | - | 2,004,652 | 1,410,294 | ||||||||||||||||||||||||
|
Other items |
12,151 | 716 | - | - | 90,581 | - | 103,448 | 60,928 | ||||||||||||||||||||||||
|
Undrawn commitments |
- | - | - | - | 382,851 | - | 382,851 | 161,598 | ||||||||||||||||||||||||
|
Operational risk ¹ |
- | - | - | - | - | - | - | 126,208 | ||||||||||||||||||||||||
|
Total |
$ | 298,276 | $ | 124,871 | $ | 4,011 | $ | 1,874,396 | $ | 1,407,568 | $ | - | $ | 3,709,122 | $ | 2,714,902 | ||||||||||||||||
|
As at October 31, 2021 |
Notional/drawn amount by risk weight |
|||||||||||||||||||||||||||||||
|
Risk |
||||||||||||||||||||||||||||||||
|
Weighted |
||||||||||||||||||||||||||||||||
|
(thousands of Canadian dollars) |
0% |
20% |
35% |
75% |
100% |
150% |
Total |
Balance |
||||||||||||||||||||||||
|
Corporate |
$ | 3,196 | $ | - | $ | - | $ | - | $ | 866,217 | $ | - | $ | 869,413 | $ | 866,217 | ||||||||||||||||
|
Sovereign |
- | 9,213 | - | - | - | - | 9,213 | 1,843 | ||||||||||||||||||||||||
|
Bank |
- | 289,170 | - | - | - | - | 289,170 | 57,834 | ||||||||||||||||||||||||
|
Retail residential mortgages |
2,515 | - | 2,718 | - | - | - | 5,233 | 951 | ||||||||||||||||||||||||
|
Other retail |
106,787 | 1,105 | - | 1,092,942 | 710 | - | 1,201,544 | 820,638 | ||||||||||||||||||||||||
|
Other items |
11,686 | 768 | - | - | 74,521 | - | 86,975 | 49,865 | ||||||||||||||||||||||||
|
Undrawn commitments |
- | - | - | - | 296,248 | - | 296,248 | 107,925 | ||||||||||||||||||||||||
|
Operational risk ¹ |
- | - | - | - | - | - | - | 108,271 | ||||||||||||||||||||||||
|
Total |
$ | 124,184 | $ | 300,256 | $ | 2,718 | $ | 1,092,942 | $ | 1,237,696 | $ | - | $ | 2,757,796 | $ | 2,013,544 | ||||||||||||||||
|
¹ The charge for operational risk is determined using the Basic Indicator Approach as prescribed by OSFI. |
Further, OSFI requires that all Canadian banks must comply with the Basel III standards on an “all-in” basis for purposes of determining their risk-based capital ratios. Required minimum regulatory capital ratios are a 7.0% Common Equity Tier 1 (“CET1”) capital ratio, an 8.5% Tier 1 capital ratio and a 10.5% total capital ratio, all of which include a 2.5% capital conservation buffer.
As the Bank makes use of the Standardized Approach for credit risk as prescribed by OSFI, it may include eligible ECL allowance amounts in its Tier 2 capital, up to a maximum of 1.25% of its credit risk-weighted assets calculated under the Standardized Approach. Further to this, and as a result of the onset of COVID-19 in the spring of 2020 and the economic uncertainty associated with same, OSFI introduced guidance that set out transitional arrangements pertaining to the capital treatment of expected loss provisioning which allows for a portion of eligible ECL allowances to be included in CET1 capital on a transitional basis over the course of the period ranging between 2020 and 2022 inclusive. The portion of ECL allowances that is eligible for inclusion in CET1 capital is calculated as the increase in the sum of Stage 1 and Stage 2 ECL allowances estimated in the current quarter relative to the sum of Stage 1 and Stage 2 ECL allowances estimated for the baseline period, which has been designated by OSFI to be the three months ended January 31, 2020, adjusted for tax effects and multiplied by a scaling factor. The scaling factor has been set by OSFI at 70% for fiscal 2020, 50% for fiscal 2021 and 25% for fiscal 2022.
On April 30, 2021, the Bank redeemed all of its 1,681,320 outstanding, Non-Cumulative Series 3 preferred shares (NVCC) using cash on hand. The amount paid on redemption for each share was $10.00, and in aggregate $16.8 million. Transaction costs, incurred at issuance of $1.1 million were applied against retained earnings.
On April 30, 2021, the Bank completed a private placement of NVCC compliant fixed to floating rate subordinated notes in the principal amount of USD $75.0 million, equivalent to CAD $92.1 million as at April 30, 2021. Interest will be paid on the Notes semi-annually in arrears on May 1 and November 1 of each year, commencing on November 1, 2021, at a fixed rate of 5.00% per year, until May 1, 2026. Thereafter, if not redeemed by VersaBank, the Notes will have a floating interest rate payable at the 3-month Bankers’ Acceptance Rate plus 361 basis points, payable quarterly in arrears, on February 1, May 1, August 1 and November 1 of each year, commencing August 1, 2026, until the maturity date. Proceeds of the Notes are currently held in US dollar denominated cash. Upon issuance of the Notes the Bank received confirmation from OSFI that the Notes qualify as Tier 2 capital of the Bank pursuant to OSFI’s Capital Adequacy Requirements (CAR) Guideline, including the NVCC Requirements specified in section 2.2 of the CAR Guideline.
On September 21, 2021 the Bank completed a treasury offering of 5,500,000 common shares at a price of USD $10.00 per share, the equivalent of CAD $12.68 per share for gross proceeds of USD $55.0 million. On September 29, 2021, the underwriters of the aforementioned offering exercised their full over-allotment option to purchase an additional 825,000 shares (15% of the 5,500,000 common shares issued via the base offering referenced above) at a price of USD $10.00 per share, or CAD $12.74 per share for gross proceeds of USD $8.3 million. Total net cash proceeds from the Common Share Offering was CAD $73.2 million. However, the Bank’s share capital increased by CAD $75.1 million corresponding to the Common Share Offering and tax effected issue costs, which increased the Bank’s Common Equity Tier 1 capital by the same amount.
The year over year trends exhibited by the Bank’s reported regulatory capital levels, regulatory capital ratios and leverage ratios were a function of the share purchased and cancelled through the NCIB and changes to the Bank’s risk-weighted asset balances and composition.
Leverage Ratio
The leverage ratio is a supplementary measure that is prescribed under the Basel III Accord and is defined as the ratio of Tier 1 capital to total exposures. OSFI requires all financial institutions to maintain a leverage ratio of 3% or greater at all times
At October 31, 2022 the Bank exceeded all of the minimum Basel III regulatory capital requirements set out above.
Liquidity
The Consolidated Statement of Cash Flows for the year ended October 31, 2022 shows cash used in operations of $32.7 million compared to cash used in operations of $108.3 million a year ago. The current year and prior year trends were a function primarily of cash outflows to fund loans exceeding cash inflows from deposits raised and the use of existing liquidity to fund loans. Based on factors such as liquidity requirements and opportunities for investment in loans and securities, the Bank may manage the amount of deposits it raises and loans it funds in ways that result in the balances of these items giving rise to either negative or positive cash flow from operations. The Bank will continue to fund its operations and meet contractual obligations as they become due using cash on hand and by closely managing its flow of deposits.
Capital Resources
The operations of the Bank are not dependent upon significant investments in capital assets to generate revenue. Currently, the Bank does not have any commitments for capital expenditures or for significant additions to its level of capital assets.
Summary of Quarterly Results
|
(thousands of Canadian dollars |
||||||||||||||||||||||||||||||||
|
except per share amounts) |
2022 |
2021 |
||||||||||||||||||||||||||||||
|
Q4 |
Q3 |
Q2 |
Q1 |
Q4 |
Q3 |
Q2 |
Q1 |
|||||||||||||||||||||||||
|
Results of operations: |
||||||||||||||||||||||||||||||||
|
Interest income |
$ | 42,072 | $ | 34,177 | $ | 25,848 | $ | 24,720 | $ | 23,924 | $ | 22,400 | $ | 21,649 | $ | 21,515 | ||||||||||||||||
|
Yield on assets (%) |
5.26 | % | 4.70 | % | 4.15 | % | 4.06 | % | 4.04 | % | 4.02 | % | 4.24 | % | 4.28 | % | ||||||||||||||||
|
Interest expense |
19,595 | 14,115 | 8,606 | 7,835 | 7,778 | 7,858 | 6,554 | 7,141 | ||||||||||||||||||||||||
|
Cost of funds (%) |
2.45 | % | 1.94 | % | 1.38 | % | 1.29 | % | 1.31 | % | 1.41 | % | 1.28 | % | 1.42 | % | ||||||||||||||||
|
Net interest income |
22,477 | 20,062 | 17,242 | 16,885 | 16,146 | 14,542 | 15,095 | 14,374 | ||||||||||||||||||||||||
|
Net interest margin (%) |
2.81 | % | 2.76 | % | 2.77 | % | 2.77 | % | 2.73 | % | 2.61 | % | 2.96 | % | 2.86 | % | ||||||||||||||||
|
Net interest margin on loans (%) |
3.03 | % | 3.07 | % | 3.11 | % | 3.23 | % | 3.31 | % | 3.23 | % | 3.55 | % | 3.44 | % | ||||||||||||||||
|
Non-interest income |
1,775 | 1,177 | 1,393 | 1,381 | 2,090 | 1,187 | 875 | 1,048 | ||||||||||||||||||||||||
|
Total revenue |
24,252 | 21,239 | 18,635 | 18,266 | 18,236 | 15,729 | 15,970 | 15,422 | ||||||||||||||||||||||||
|
Provision for (recovery of) credit losses |
205 | 166 | 78 | 2 | (279 | ) | 96 | (312 | ) | 57 | ||||||||||||||||||||||
|
Non-interest expenses |
13,774 | 13,216 | 11,767 | 10,636 | 10,377 | 8,200 | 8,342 | 8,087 | ||||||||||||||||||||||||
|
Efficiency ratio |
57 | % | 62 | % | 63 | % | 58 | % | 57 | % | 52 | % | 52 | % | 52 | % | ||||||||||||||||
|
Efficiency ratio - Digital Banking |
51 | % | 57 | % | 58 | % | 58 | % | 56 | % | 50 | % | 49 | % | 51 | % | ||||||||||||||||
|
Tax provision |
3,844 | 2,137 | 1,847 | 2,062 | 2,228 | 1,997 | 2,196 | 1,988 | ||||||||||||||||||||||||
|
Net income |
$ | 6,429 | $ | 5,720 | $ | 4,943 | $ | 5,566 | $ | 5,910 | $ | 5,436 | $ | 5,744 | $ | 5,290 | ||||||||||||||||
|
Income per share |
||||||||||||||||||||||||||||||||
|
Basic |
$ | 0.23 | $ | 0.20 | $ | 0.17 | $ | 0.19 | $ | 0.24 | $ | 0.25 | $ | 0.25 | $ | 0.22 | ||||||||||||||||
|
Diluted |
$ | 0.23 | $ | 0.20 | $ | 0.17 | $ | 0.19 | $ | 0.24 | $ | 0.25 | $ | 0.25 | $ | 0.22 | ||||||||||||||||
|
Return on average common equity |
7.32 | % | 6.57 | % | 5.92 | % | 6.58 | % | 8.07 | % | 8.72 | % | 9.20 | % | 8.26 | % | ||||||||||||||||
|
Return on average total assets |
0.77 | % | 0.75 | % | 0.75 | % | 0.87 | % | 0.96 | % | 0.93 | % | 1.02 | % | 0.94 | % | ||||||||||||||||
|
Gross impaired loans to total loans |
0.01 | % | 0.05 | % | 0.00 | % | 0.00 | % | 0.00 | % | 0.00 | % | 0.00 | % | 0.00 | % | ||||||||||||||||
The financial results for each of the last eight quarters are summarized above. Key drivers of the quarter over quarter performance trends for the current reporting period were:
|
Lending asset growth attributable to strong growth in the POS Financing portfolio; |
|
Higher NIM attributable to management adjusting the Bank’s liquidity management strategy to optimize average liquid/total asset ratios; |
|
Higher provision for credit losses attributable primarily to lending asset growth and changes in the forward-looking information used by VersaBank in its credit risk models; and, |
|
Higher non-interest expense attributable primarily to investments in the Bank’s business development initiatives. |
Fourth Quarter Review
Net Income
Net income for the quarter was $6.4 million, or $0.23 per common share (basic and diluted), a 12% increase from $5.7 million, or $0.20 per common share (basic and diluted), for the third quarter of fiscal 2022 and a 9% increase from $5.9 million, or $0.24 per common share (basic and diluted), for the same period a year ago. The quarter over quarter and year over year trends were a function primarily of higher revenues offset partially by higher provision for credit losses, higher non-interest expenses, attributable primarily to investments in the Bank’s business development initiatives and higher income tax provisions.
Total Revenue
Total revenue for the quarter was $24.3 million, an increase of 14% from $21.2 million for the third quarter of fiscal 2022 and an increase of 33% from $18.2 million for the same period a year ago. The quarter over quarter and year over year trends were a function primarily of higher interest income attributable substantially to lending asset growth and higher non-interest income attributable to higher gross profit generated by DBG.
Net Interest Income
Net interest income for the quarter was $22.5 million, an increase of 12% from $20.1 million for the third quarter of fiscal 2022 quarter and an increase of 39% from $16.1 million for the same period a year ago. The quarter over quarter and year over year trends were a function primarily of higher interest income attributable to strong lending asset growth, higher yields earned on floating rate lending assets attributable to rising interest rates and the redeployment of available cash into higher yielding, low risk securities, offset partially by higher interest expense.
Net Interest Margin
Net interest margin or spread for the quarter was 2.81% compared with 2.76% for the third quarter of fiscal 2022 quarter and 2.73% for the same period a year ago. The quarter over quarter and year over year trends were a function primarily of higher yields earned on the Bank’s lending assets generally attributable to rising interest rates and management adjusting the Bank’s liquidity management strategy to optimize average liquid/total asset ratios offset partially by higher cost of funds attributable to changes in the Bank’s funding mix and rising interest rates over the course of fiscal 2022.
Provision for Credit Losses
VersaBank recorded a provision for credit losses and PCL ratio for the quarter of $205,000 and 0.03% respectively compared to a provision for credit losses and PCL ratio of $166,000 and 0.03% respectively last quarter and a recovery of credit losses of $279,000 and PCL ratio of -0.05% respectively for the same period a year ago. The recovery recorded last year was attributable primarily to changes in the Bank’s lending asset portfolio mix portfolio and changes in the forward-looking information used in the Bank’s credit risk models offset partially by higher lending balances. The current quarter over quarter and year over year trends were a function of higher lending asset balances and changes in the forward-looking information used by the Bank in its credit risk models offset partially by changes in the Bank’s lending asset mix.
Non-Interest Expenses
Non-interest expenses for the quarter were $13.8 million compared to $13.2 million for the third quarter of fiscal 2022 and $10.4 million for the same period a year ago. The quarter over quarter and year over year increases were a function primarily of transitory investments in several business development initiatives, including the planned acquisition of a US national bank, development and initial launch of the RPP in the US, and the ongoing development of the Canadian-dollar version of VersaBank’s Digital Deposit Receipts. Investments associated with the acquisition and integration of the operations of the US bank are anticipated to be realized substantially by the first quarter of 2023. Investments in the transitory business development initiatives noted above totaled $1.8 million, or $0.06 per share on an after tax basis for the current quarter and $2.3 million, or $0.07 per share on an after tax basis for the previous quarter. The quarter over quarter and year over year trends were also impacted by higher salary and benefits expense attributable to higher staffing levels to support expanded revenue-generating business activity across VersaBank and higher costs associated with employee retention.
Income Taxes
For the three months ended October 31, 2022, the provision for income taxes was $3.8 million compared with $2.1 million for the third quarter of fiscal 2022 and $2.2 million for the same period a year ago. The quarter over quarter and year over year trends were a function primarily of an increase in the Bank’s effective tax rate in the current year attributable primarily to higher non-deductible expenses associated with employee stock options which were issued as part of the Bank’s employee retention program early in the current year and unrecognized non-capital losses as well as temporary, incremental tax associated with the Bank’s current lending activity in the US. Management anticipates that the effective tax rate experienced in the current quarter will be reduced in fiscal 2023.
Critical Accounting Policies and Estimates
Significant accounting policies are detailed in note 3 of the Bank’s 2022 Consolidated Financial Statements. There has been no change in accounting policies nor any significant new policies adopted during the current year.
In preparing the Consolidated Financial Statements, management has exercised judgment and developed estimates in applying accounting policies and generating reported amounts of assets and liabilities at the date of the financial statements and income and expenses during the reporting periods. Areas where judgment was applied were in the assessments of impairment of financial instruments. Estimates are applied in the determination of the allowance for expected credit losses on financial assets, the purchase price allocation associated with the Bank’s acquisition of Digital Boundary Group, the impairment test applied to goodwill, and the measurement of deferred income taxes. It is reasonably possible, on the basis of existing knowledge, that actual results may vary from that expected in the measurement of these estimates. This could result in material adjustments to the carrying amounts of assets and/or liabilities affected in the future.
Estimates and their underlying assumptions are reviewed on an ongoing basis. Revisions to accounting estimates are applied prospectively once they are recognized.
The policies discussed below are considered to be particularly significant as they require management to make estimates or judgements, some of which may relate to matters that are inherently uncertain.
Financial Instruments
Classification and Measurement
Under IFRS 9, all financial assets must be classified at initial recognition as a function of the financial asset’s contractual cash flow characteristics and the business model under which the financial asset is managed. All financial assets are initially measured at fair value, and are classified and subsequently measured at amortized cost, fair value through profit or loss or fair value through other comprehensive income. Financial assets are required to be reclassified when the business model under which they are managed has changed. Any reclassifications are applied prospectively from the reclassification date. All financial liabilities are measured at amortized cost unless elected otherwise.
Debt instruments
Financial assets that are debt instruments are categorized into one of the following measurement categories:
|
|
amortized cost; |
|
fair value through other comprehensive income (“FVOCI”); |
|
fair value through profit and loss (“FVTPL”). |
The characterization of a debt instrument’s cashflows is determined through a solely payment of principal and interest (“SPPI”) test. The SPPI test is conducted to identify whether the contractual cash flows of a debt instrument are in fact solely payments of principal and interest and are consistent with a basic lending arrangement. In the context of the SPPI test, “Principal” is defined as the fair value of the debt instrument at origination or initial recognition, which may change over the life of the instrument as a function of a number of variables including principal repayments, prepayments, or amortization of a premium/discount. In the context of the SPPI test “Interest” is defined as the consideration for the time value of money and credit risk. The rationale for the SPPI test is to ensure that debt instruments that include structural features that are incongruent with a basic lending arrangement, such as conversion options, are classified as, and measured at FVTPL.
The Bank’s loans are categorized and measured as amortized cost. Debt instruments with contractual cash flows that meet the SPPI test and are managed on a hold to collect basis are measured at amortized cost. These financial instruments are recognized initially at fair value plus direct and incremental transaction costs, and are subsequently measured at amortized cost, using the effective interest rate method, net of an allowance for credit losses. The effective interest rate is the rate that discounts estimated future cashflows through the expected life of the instrument to the gross carrying amount of the instrument. Amortized cost is calculated as a function of the effective interest rate, taking into account any discount or premium on acquisition, transaction costs and fees. Amortization of these costs is included in interest income in the consolidated statement of income.
The Bank’s securities are measured at fair value and categorized as FVTPL.
Equity instruments
Equity instruments are measured at fair value and categorized as FVTPL unless an irrevocable designation is made at initial recognition to categorize as FVOCI. Gains or losses from changes in the fair value of equity financial instruments designated at FVOCI, including any related foreign exchange gains or losses, are recognized in OCI. Amounts recognized in OCI are not to be subsequently reclassed to profit or loss, with the exception of dividends. Dividends received are recorded in interest income in the consolidated statement of income. Cumulative gains or losses upon derecognition of the equity instrument will be transferred within equity from AOCI to retained earnings.
Allowance for Expected Credit Losses
The Bank must maintain an allowance for expected credit losses that is adequate, in management’s opinion, to absorb all credit related losses in the Bank’s lending and treasury portfolios. The Bank’s allowance for credit losses is estimated using the ECL methodology and is comprised of expected credit losses recognized on all financial assets that are debt instruments, classified either as amortized cost or as FVOCI, and on all loan commitments and financial guarantees that are not measured at FVTPL.
Expected credit losses represent unbiased and probability-weighted estimates that are modeled as a function of a range of possible outcomes as well as the time value of money, and reasonable and supportable information about past events, current conditions and forecasts of future economic conditions, or more specifically forward-looking information (“FLI”) (see Forward-Looking Information below).
The Bank’s ECL or impairment model estimates 12 months of expected credit losses for performing loans that have not experienced a significant increase in credit risk, (“SICR”) since initial recognition. Additionally, the ECL impairment model estimates lifetime expected credit losses on performing loans that have experienced a SICR since initial recognition. Further, individual allowances are estimated for loans that are determined to be credit impaired.
Loans or other financial instruments that have not experienced a SICR since initial recognition are designated as stage 1, while loans or financial instruments that have experienced a SICR since initial recognition are designated as stage 2, and loans or financial instruments that are determined to be credit impaired are designated as stage 3.
Assessment of significant increase in credit risk (“SICR”)
At each reporting date, the Bank assesses whether or not there has been a SICR for loans since initial recognition by comparing, at the reporting date, the risk of default occurring over the remaining expected life against the risk of default at initial recognition.
The determination of a SICR is a function of the loan’s internal risk rating assignment, internal watchlist status, loan review status and delinquency status which are updated as necessary in response to changes including, but not limited to changes in macroeconomic and/or market conditions, changes in a borrower’s credit risk profile, and changes in the strength of the underlying security, including guarantor status, if a guarantor exists.
Quantitative models may not always be able to capture all reasonable and supportable information that may indicate a SICR. As a result, qualitative factors may be considered to supplement such a gap. Examples include changes in adjudication criteria for a particular group of borrowers or asset categories or changes in portfolio composition.
With regards to delinquency and monitoring, there is a rebuttable presumption that the credit risk of a loan or other financial instrument has increased since initial recognition when contractual payments are more than 60 days delinquent. The Bank chose to use 60 days delinquency as an appropriate indicator of increased credit risk as it serves as a stable early warning indicator that the cashflows associated with the loan or other financial instrument under consideration may be in jeopardy and may not be realized by the Bank under the contractual repayment terms.
Expected credit loss model – Estimation of expected credit losses
Expected credit losses are an estimate of a loan’s expected cash shortfalls discounted at the effective interest rate, where a cash shortfall is the difference between the contractual cash flows that are due to the Bank and the cash flows that the Bank actually expects to receive. The ECL calculation is a function of the credit risk parameters; probability of default, loss given default, and exposure at default associated with each loan, sensitized to future market and macroeconomic conditions through the incorporation of FLI derived from multiple economic forecast scenarios, including baseline, upside, and downside scenarios.
For clarity:
|
|
The probability of default (“PD”) for a loan or a financial instrument is an estimate of the likelihood of default of that instrument over a given time horizon; |
|
The loss given default (“LGD”) for a loan or financial instrument is an estimate of the loss arising in the case where a default of that instrument occurs at a given time or over a given period; and, |
|
The exposure at default (“EAD”) for a loan or financial instrument is an estimate of the Bank’s exposure derived from that instrument at a future default date. |
The Bank’s ECL model develops contractual cashflow profiles for loans as a function of a number of underlying assumptions and a broad range of input variables. The expected cashflow schedules are subsequently derived from the contractual cashflow schedules, adjusted for incremental default amounts, forgone interest, and recovery amounts.
The finalized contractual and expected cashflow schedules are subsequently discounted at the effective interest rate to determine the expected cash shortfall or expected credit losses for each individual loan or financial instrument.
Individual allowances are estimated for loans and other financial instruments that are determined to be credit impaired and that have been designated as stage 3. A loan is classified as credit impaired when the Bank becomes aware that all of, or a portion of the contractual cashflows associated with the loan may be in jeopardy and as a result may not be realized by the Bank under the repayment schedule set out in the contractual terms associated with the loan.
Forward-Looking Information
The IFRS 9 standard requires consideration of past events, current market conditions and reasonable, supportable information about future economic conditions that is available without undue cost and effort in the estimation of the expected credit losses for loans. More specifically, under IFRS 9 expected credit losses represent an unbiased, probability-weighted estimate of the present value of cash shortfalls (i.e., the weighted average of credit losses, with the respective risks of a default occurring in a given time period used as the weights). Additionally, IFRS 9 stipulates that future economic conditions are to be based on an unbiased, probability-weighted assessment of possible future outcomes. The estimation and application of forward-looking information in an attempt to capture the impact of future economic conditions requires judgement.
The Bank incorporated the impact of future economic conditions, or more specifically forward-looking information into the estimation of expected credit losses at the credit risk parameter level. This is accomplished via the credit risk parameter models and proxy datasets that the Bank utilizes to develop PD and LGD term structure forecasts for its loans. The Bank has sourced credit risk modeling systems and forecast macroeconomic scenario data from Moody’s Analytics for the purpose of computing forward-looking risk parameters under multiple macroeconomic scenarios that consider both market-wide and idiosyncratic factors and influences. These systems are used in conjunction with the Bank’s internally developed ECL models. Given that the Bank has experienced very limited historical losses and, therefore, does not have available statistically significant loss data inventory for use in developing forward looking expected credit loss trends, the use of unbiased, third party forward-looking credit risk parameter modeling systems is particularly important for the Bank in the context of the estimation of expected credit losses.
The Bank utilizes macroeconomic indicator data derived from multiple macroeconomic scenarios, most often comprised of baseline, upside, and downside scenarios in order to mitigate volatility in the estimation of expected credit losses as well as to satisfy the IFRS 9 requirement that future economic conditions are to be based on an unbiased, probability-weighted assessment of possible future outcomes. More specifically, the macroeconomic indicators set out in the macroeconomic scenarios are used as inputs for the credit risk parameter models utilized by the Bank to sensitize the individual, PD and LGD term structure forecasts to the respective macroeconomic trajectory set out in each of the scenarios. The Bank has also applied expert credit judgment, where appropriate, to reflect, amongst other items, uncertainty in the Canadian and US macroeconomic environments.
The macroeconomic indicator data utilized by the Bank for the purpose of sensitizing PD and LGD term structure data to forward economic conditions include, but are not limited to: real GDP, the national unemployment rate, long term interest rates, the consumer price index, and the price of oil. These specific macroeconomic indicators were selected in an attempt to ensure that the spectrum of fundamental macroeconomic influences on the key drivers of the credit risk profile of the Bank’s balance sheet, including: corporate, consumer and real estate market dynamics; corporate, consumer and SME borrower performance; geography; as well as collateral value volatility are appropriately captured and incorporated into the Bank’s forward macroeconomic sensitivity analysis.
Business Combinations
The Bank applied IFRS 3 Business Combinations in its accounting for the acquisition of Digital Boundary Group using the acquisition method. The cost of an acquisition is measured at the fair value of the consideration, including contingent consideration if applicable, given at the acquisition date. Contingent consideration is a financial instrument and, as such, is remeasured each period thereafter with the adjustment recorded to acquisition-related fair value changes in the consolidated statements of comprehensive income. Acquisition-related costs are recognized as an expense in the income statement in the period in which they are incurred. The acquired identifiable assets, liabilities and contingent liabilities are measured at fair value at the date of acquisition. Goodwill is measured as the excess of the aggregate of the consideration transferred, including, if applicable, any amount of any non-controlling interest in the acquiree, over the net of the recognized amounts of the identifiable assets acquired and the liabilities assumed.
Goodwill and intangible assets
Goodwill is the residual amount that results when the purchase price of an acquired business exceeds the value allocated to the tangible and intangible assets, less liabilities assumed, based on their fair values. Goodwill is not amortized but rather tested for impairment annually or more frequently if events or a change in circumstances indicate that the asset might be impaired. Impairment is determined for goodwill by assessing if the carrying value of cash generating units (“CGUs”) which comprise the CGU segment, including goodwill, exceeds its recoverable amount determined as the greater of the estimated fair value less costs to sell and the value in use. Impairment losses recognized in respect of the CGUs are first allocated to the carrying value of goodwill and any excess is allocated to the carrying amount of assets in the CGUs. Any goodwill impairment is recorded in profit or loss in the reporting year in which the impairment is identified. Impairment losses on goodwill are not subsequently reversed.
Intangible assets acquired in a business acquisition are recorded at their fair value. In subsequent reporting periods, intangible assets are stated at cost less accumulated amortization and accumulated impairment losses. Amortization is recorded on a straight-line basis over the expected useful life of the intangible asset. At each reporting date, the carrying value of intangible assets are reviewed for indicators of impairment. If such an indication exists, the recoverable amount of the asset is estimated in order to determine the extent of the impairment, if any. For the purpose of impairment testing, assets that cannot be tested individually are grouped together into the smallest group of assets that generate cash flows from continuing use that are largely independent of the cash inflows of other assets or groups of assets (CGU). If the recoverable amount of an asset or CGU is estimated to be less than its carrying amount, the carrying amount is reduced to its recoverable amount and the impairment loss is recognized in profit or loss. The recoverable amount of an asset or CGU is the higher of fair value less costs to sell and value in use. In assessing value in use, the estimated future cash flows are discounted at a rate that reflects current market assessments of the time value of money and the risks specific to the assets. An impairment loss is reversed if there has been a change in the estimates used to determine the recoverable amount. When an impairment loss is subsequently reversed, the carrying amount of the asset is increased to the revised estimate of its recoverable amount so that the increased carrying amount does not exceed the carrying amount that would have been recorded had no impairment losses been recognized for the asset in prior years.
Corporate Income Taxes
Current income taxes are calculated based on taxable income at the reporting period end. Taxable income differs from accounting income because of differences in the inclusion and deductibility of certain components of income which are established by Canadian taxation authorities. Current income taxes are measured at the amount expected to be recovered or paid using statutory tax rates at the reporting period end.
The Bank follows the asset and liability method of accounting for deferred income taxes. Deferred income tax assets and liabilities arise from temporary differences between financial statement carrying values and the respective tax base of those assets and liabilities. Deferred income tax assets and liabilities are measured using enacted or substantively enacted tax rates expected to apply to taxable income in the years when temporary differences are expected to be recovered or settled.
Deferred income tax assets are recognized in the Bank’s consolidated financial statements to the extent that it is probable that the Bank will have sufficient taxable income to enable the benefit of the deferred income tax asset to be realized. Unrecognized deferred income tax assets are reassessed for recoverability at each reporting period end.
Current and deferred income taxes are recorded in income for the period, except to the extent that the tax arose from a transaction that is recorded either in Other Comprehensive Income or Equity, in which case the income tax on the transaction will also be recorded either in Other Comprehensive Income or Equity. Accordingly, current and deferred income taxes are presented in the Consolidated Financial Statements as a component of income, or as a component of Other Comprehensive Income.
Enterprise Risk Management
The Bank recognizes that risk is present in all business activities and that the successful management of risk is a critical factor in maximizing shareholder value. As such, the Bank has developed and continues to enhance an Enterprise Risk Management (“ERM”) Program to identify, evaluate, treat, mitigate, report, and monitor the risks that impact the Bank.
The Bank will maintain a robust ERM program to:
|
|
Ensure significant current and emerging risks are identified, understood and managed appropriately; |
|
Support the Board’s corporate governance needs; and, |
|
Strengthen the Bank’s risk management practices in a manner demonstrable to external stakeholders. |
The goal of risk management is not to eliminate risks but to identify and control risks within the context of the Bank’s Risk Appetite Statement. The ERM program enhances the effectiveness, efficiency and understanding of risk and risk management at an individual and enterprise level.
GUIDING PRINCIPLES OF THE BANK’S ENTERPRISE RISK MANAGEMENT PROGRAM
|
Risk management is everyone’s responsibility, from the Board of Directors to individual employees. Employees are expected to understand the risks that fall within their areas of responsibility and to manage these risks within approved risk tolerances; |
|
Risk management is a comprehensive, structured and continuous process in which risks are identified, evaluated and consciously accepted or mitigated within approved risk tolerances; |
|
Risk management is based on open communication of the best available information, both quantitative and qualitative, from a range of sources, including historical data, experience, stakeholder feedback, observation, forecasts and expert judgment; |
|
Enterprise Risk Management is integrated with Bank processes such as strategic planning, business planning, operational management, and investment decisions to ensure consistent consideration of risks in all decision-making; and, |
|
Risk owners will be identified through the risk management process and will be responsible to address and implement risk mitigation/avoidance/transfer strategies to minimize the risk impact to the Bank. |
RISK APPETITE STATEMENT
Risk appetite is the measurement of capital, liquidity, earnings and operational variability that the Bank is prepared to put at risk while in pursuit of the Bank’s strategic objectives. Risk appetite provides for a common understanding of the boundaries of acceptable and unacceptable risks recommended by management and approved by the Board, as the Bank works toward achieving its strategic objectives. The risk appetite statement includes a set of risk tolerances to communicate specific capacities for risk within each significant risk category.
Consideration will be given to all risks; however, the Bank has identified the following seven significant risk categories from which it will measure and establish tolerances in the pursuit of the Bank’s strategic objectives:
|
|
Liquidity Risk; |
|
Operational Risk; |
|
Market Risk; |
|
Credit Risk; |
|
Regulatory Risk; |
|
Strategic Risk; and, |
|
Reputational Risk. |
Liquidity Risk
Liquidity risk is the risk that the Bank is unable to meet the demand for cash to fund obligations as they come due.
Liquidity risk is managed primarily by the Treasurer, the Vice President, Deposit Services, and the Chief Financial Officer.
Treasury policies are developed and controlled by the Treasury Department as a function of the Bank’s business objectives, liquidity risk appetite, and regulatory requirements as determined by senior and executive management, and the Board of Directors.
Deposit raising activities are overseen by the Vice President, Deposit Services.
LIQUDITY RISK AND THE RISK APPETITE STATEMENT
The Bank’s risk appetite statement defines liquidity risk tolerances to which the Bank will adhere in the execution of its business objectives. Liquidity risk tolerances are administered as follows:
|
1. |
Liquidity |
The Board of Directors sets tolerances in the risk appetite statement based on the Bank’s comfort with the level of liquidity that is to be maintained in order to ensure that all funding obligations are met. These tolerances are mirrored and operationalized through Bank policies.
|
2. |
Deposit Sources |
The monitoring of deposit sources establishes Bank comfort with the origination and concentration of deposit inflows such that the Bank can monitor trends in improvements in diversifying its deposit sources.
Liquidity management is further supported by processes, which include but are not limited to:
|
|
Monitoring of liquidity levels; |
|
Monitoring of liquidity trends and key risk indicators; |
|
Scenario stress testing; |
|
Monitoring the credit profile of the liquidity portfolio; and, |
|
Monitoring deposit concentrations. |
In order to manage its liquidity needs, the Bank has a liquidity risk management program that is comprised specifically of the following policies and procedures:
|
Holding sufficient liquid assets which, based on certain stress assumptions, results in positive cumulative cash flow for a period of 61 to 90 days; |
|
Holding liquid securities at levels that represent no less than 5% of total assets. Liquid securities include: Canadian federal, provincial and municipal debt; debt of federally regulated Canadian financial institutions; widely distributed debt instruments, (all of which are to be rated investment grade); cash on deposit; and banker’s acceptances; |
|
On a daily basis, monitoring cash flow; |
|
On a weekly basis, monitoring cash flow requirements using a liquidity forecasting template under a stressed scenario; |
|
On a monthly basis, testing liquidity using three specific disruption scenarios; i) industry specific disruption scenario, ii) company specific liquidity disruption scenario, and iii) a systematic disruption scenario; and, |
|
Managing liquidity in accordance with guidelines specified by OSFI. |
Operational Risk
Operational risk is the risk of loss resulting from people, inadequate or failed internal processes and systems, or from external events. Operational risk includes legal risk but excludes strategic and reputational risk.
Operational risk differs from other banking risks in that, typically, it is not directly accepted in return for an expected reward but exists in the natural course of business activity.
The Bank recognizes that operational risk is present in all business activities and that the successful management of operational risk is a key factor in the sustained success of the Bank. Sound operational risk management is a reflection of the effectiveness of the Board and senior management in administering its portfolio of products, activities, processes and systems. As such, the Bank has developed and will continuously enhance an Operational Risk Management (“ORM”) Program to identify, evaluate, treat, mitigate, report and monitor operational risks to which the Bank is exposed.
OPERATIONAL RISK AND THE RISK APPETITE STATEMENT
The Bank has segmented operational risk into six operational risk pillars:
|
1. |
Employment Practices and Workplace Safety |
The risk resulting from the inappropriate hiring of employees, unjust compensation, or mistreatment of employees, producing consequences such as litigation or resignation. Moreover, it includes risk stemming from the enforcement of safety regulations and the inability to control the environment in working conditions, causing detrimental effects on employees’ health such as illness or accidents while working.
|
2. |
Information Technology (“IT”) and Cybersecurity |
As the Bank’s operations are largely dependent on data and information processing, much emphasis is placed on information technology security to ensure an uninterrupted, secure and undisturbed use of information and communication systems. Business disruption may occur if risks are realized such as system failures or anomalies, defects in the Bank’s computer systems or network infrastructure, or the employment of outdated or substandard technology tools.
|
3. |
Fraud and Errors |
This operational risk pillar includes three sub-groups:
|
I. |
Internal Fraud: |
Employees, by themselves or in collusion with others, intentionally violating internal policy, or laws and directly benefiting from the action to the detriment of the business and/or the client.
|
II. |
External Fraud: |
Acts undertaken by external parties intended to defraud or misappropriate financial, information or physical assets or create financial loss for the company.
|
III. |
Errors: |
Risk resulting from errors in the operational process or methodology, lack of a procedure or policy documentation, and control failures.
|
4. |
Outsourcing |
Outsourcing arrangements require careful management if they are to yield benefits. Where they are not managed adequately, the degree of operational risk faced by the Bank may increase. Outsourcing risk exists when there is a business disruption to the third parties on which the Bank depends or when inadequate controls are in place to manage material outsourcing arrangements.
|
5. |
Business Continuity: |
The risk of damage to physical assets and/or disruptive events from various accidents such as fire, natural disaster, riots, terrorism, etc. The Bank will assess the potential risk of such events occurring and maintain a recovery plan to ensure continuity of business activity.
|
6. |
Client, Product and Business Practices |
The risk resulting from business practices, the introduction of a product, and the accessing of a customer’s information that is inappropriate or non-compliant with regulations or rules, such as unauthorized transactions, unapproved dealings, money laundering activities or the misuse of confidential customer information.
Operational risk impacts can be financial loss, loss of competitive position or reputational in nature. The Bank employs the following strategies in its efforts to monitor and manage operational risk exposures to acceptable levels:
|
|
Comprehensive operational policies which provide clear direction to all areas of its business and employees and establish accountability and responsibilities to identify, assess, appropriately mitigate and control operational risk; |
|
Hiring of banking professionals with many years of related experience; |
|
Use of technology through automated systems with built in controls; |
|
Maintenance of a compliance monitoring program; and, |
|
Continual review and upgrade of systems and procedures. |
Market Risk
Market risk is the risk of a negative impact on the balance sheet and/or income statement resulting from changes or volatility in market factors such as foreign exchange risk, interest rates, or market prices. The Risk Oversight Committee is charged with recommending policies that govern market risk to its Board of Directors for approval and with reviewing the policies on an ongoing basis. Interest rate risk is the risk that a movement in interest rates could negatively impact spread, net interest income and the economic value of assets, liabilities and shareholders’ equity. The Bank manages interest rate risk by employing a number of methods including income simulation analysis and interest rate sensitivity gap and duration analysis.
Foreign exchange risk or currency risk is the risk that transacting in any currency apart from the Bank’s base currency can result in gains or losses due to currency fluctuations resulting in the possibility that a foreign denominated transaction’s value may decrease due to changes in the relative value of the currency pair. Any appreciation/depreciation in the foreign currency versus the local currency will give rise to foreign exchange risk. The Bank actively manages any material foreign exchange risk exposure derived from the Bank’s normal course business activities through, where possible, the establishment of a natural foreign currency hedge or, if necessary, through foreign exchange contracts established with high quality counterparties in order to mitigate the impact of changes in foreign exchange rates on the Bank’s financial results and position. The Bank is exposed to foreign exchange risk attributable to its US lending and treasury portfolios. However, this foreign exchange risk exposure has been mitigated to an acceptable level through a natural currency hedge facilitated by the USD denominated fixed to floating rate subordinated notes payable that were issued by the Bank in April of 2021. Market risk is managed primarily by the Treasurer and the Chief Financial Officer. Treasury policies, which set out the management of market risk and document risk limits, include the Bank’s interest rate risk management policies and securities portfolio management policies.
Treasury policies are developed, maintained, and administered by the Treasury Department as a function of the Bank’s business objectives, market risk appetite, and regulatory requirements as determined by senior and executive management, and the Board of Directors.
MARKET RISK AND THE RISK APPETITE STATEMENT
The Bank’s risk appetite statement defines market risk tolerances to which the Bank will adhere in the execution of its business objectives. Market risk tolerances are administered as follows:
|
1. |
Interest Rate Volatility: |
Interest rate risk is the risk of a negative impact on the balance sheet or income statement resulting from a change in interest rates. Tolerances are defined and used to assist in measuring the Bank’s ability and effort to manage changes to the Bank’s capital position as a result of an increase/decrease in both short-term and long-term interest rates.
|
2. |
Equity Risk: |
Equity risk is the risk of loss resulting from changes or volatility in equity or financial instrument prices. Tolerances are defined and used to assist in measuring the Bank’s ability and effort to manage changes to the Bank’s capital position as a result of changes in the value of the Bank’s treasury portfolio investments.
As stated above, the Bank’s principal market risk arises from interest rate risk as the Bank does not consistently undertake any material foreign exchange or trading activities. In addition, the Bank is subject to market price volatility with respect to available-for-sale securities due to the resulting impact on regulatory capital.
The Risk Oversight Committee of the Bank is charged with recommending policies that govern market risk to the Board of Directors for approval and with reviewing the policies on an ongoing basis. Additionally, the Bank manages interest rate risk by employing a number of methods including income simulation analysis and interest rate sensitivity gap and duration analysis. Management prepares regular reports to the Board to allow for ongoing monitoring of the Bank’s interest rate risk position. Further, the Bank’s Asset Liability Committee reviews the results of these analyses on a monthly basis and monitors compliance with limits set out in corporate policy. The Bank’s policies include the matching of its cash inflows and outflows so that:
|
ii. |
in any 12 month period, a 100 basis point change in rates across the entire yield curve would not result in a decline greater than 4% of regulatory capital on the Bank’s earnings; and, |
|
ii. |
in any 60 month period, a 100 basis point change in rates across the entire yield curve would not result in a decline greater than 6% of regulatory capital on the Bank’s equity. |
As well, the policy indicates that at no time shall the duration difference between the Bank’s assets and liabilities exceed four months. The interest rate risk position and results of the Bank’s duration analysis at October 31, 2022 as well as for 2021 are reported in the table below.
Interest Rate Position
|
(thousands of Canadian dollars) |
||||||||||||||||
|
October 31, 2022 |
October 31, 2021 |
|||||||||||||||
|
Increase 100 bps |
Decrease 100 bps |
Increase 100 bps |
Decrease 100 bps |
|||||||||||||
|
Increase (decrease): |
||||||||||||||||
|
Impact on projected net interest income during a 12 month period |
$ | 4,304 | $ | (4,261 | ) | $ | 4,147 | $ | (3,220 | ) | ||||||
|
Duration difference between assets and liabilities (months) |
1.4 | 2.3 | ||||||||||||||
As presented in the table above, the impact on net interest income during a 12 month period of a 100 basis point increase would be approximately $4.3 million, while the impact on net interest income of a 100 basis point decrease would be approximately ($4.3 million). At October 31, 2022 the duration difference between the Bank’s assets and liabilities was 1.4 months compared to 2.3 months at October 31, 2021, indicating that the Bank’s assets would reprice faster than liabilities in the event of a future change in interest rates.
The Bank uses on-balance sheet strategies to manage its interest rate risk, and as such, at October 31, 2022, the Bank did not have any outstanding contracts to hedge fair value exposure attributable to interest rate risk.
Credit Risk
Credit risk is the risk of loss associated with a borrower, guarantor or counterparty’s inability or unwillingness to fulfill its contractual obligations.
The Bank accepts certain risks in order to generate revenue. In managing these risks, the Bank has developed an enterprise-wide risk management framework designed to achieve an appropriate balance between credit risk and reward in order to maximize shareholder return.
Credit risk is managed by the Chief Credit Officer who administers the Bank’s established credit policies that set out the roles of the credit department and the lending business units related to risk management, and further, establishes risk tolerances for same in accordance with the Board-approved risk appetite statement. Credit policies exist for the credit department and for each lending business unit. Credit policies are developed, maintained, and administered by the Credit Department as a function of the Bank’s business objectives, credit risk appetite, and regulatory requirements as determined by senior management, and the Board of Directors.
To supplement the Bank’s credit policies, the individual lending business units have developed and compiled comprehensive procedures that describe the processes, systems and methods employed in the operation of their businesses while operating within the credit framework set out by the Bank’s credit policies.
CREDIT RISK AND THE RISK APPETITE STATEMENT
The Bank’s risk appetite statement defines credit risk tolerances to which the Bank will adhere in the execution of its business objectives. The risk appetite statement defines the credit risk tolerances for the entire Bank as well as for each of the following business lines that accept credit risk:
|
1. |
Commercial Lending; |
|
2. |
Point of Sale Financing; and, |
|
3. |
Treasury. |
The Bank manages its credit risk using policies that have been recommended by management to the Risk Oversight Committee, which then recommends the policies to the Board of Directors of the Bank for approval. These policies consist of approval procedures and limits on loan amounts, portfolio concentration, geographic concentration, industry concentration, asset categories, loans to any one entity and associated groups, a risk rating policy that provides for risk rating each asset in its total asset portfolio, and early recognition of problem accounts with action plans for each account. The Risk Oversight Committee of the Bank reviews these policies on an ongoing basis.
The Risk Oversight Committee of the Bank is comprised entirely of independent directors and performs the following functions related to credit risk:
|
Recommends policies governing management of credit risk to the Bank’s Board of Directors for approval and reviews credit risk policies on an ongoing basis to ensure that they are prudent and appropriate given possible changes in market conditions and corporate strategy; |
|
Reviews and concurs with credits exceeding the levels delegated to management, prior to commitment; and, |
|
|
Reviews, on a regular basis, watchlist accounts, impaired loans and accounts that have gone into arrears. |
Regulatory Risk
Regulatory risk is the risk that a regulatory agency will make changes in the current rules (or will impose new rules) that will increase the costs of operating the Bank, reduce the attractiveness of the Bank as an investment, result in financial loss, and/or change the competitive landscape. Regulatory risk also includes the risk of adverse outcomes due to non-compliance to rules, regulations, standards or other legal requirements.
The Bank has a Regulatory Compliance Management Program that includes a three lines of defence model and essentially establishes the controls and processes through which the Bank manages regulatory compliance risk. The Chief Compliance Officer is responsible for regulatory compliance oversight.
REGULATORY RISK AND THE RISK APPETITE STATEMENT
The Bank’s risk appetite statement defines regulatory risk tolerances to which the Bank will adhere in the execution of its business objectives. Regulatory risk tolerances are administered as follows:
|
1. |
Regulatory Compliance |
Bank conformance with laws, rules, and regulations and prescribed practices in all jurisdictions in which it operates.
|
2. |
Regulatory Capital |
Capital is a key regulatory requirement. The quality of capital and the leverage of the Bank’s capital is a key indicator of health by regulators.
Strategic Risk
Strategic risk is defined as the losses or forgone revenues resulting from improper or ineffective business strategies, resource allocation and/or decision-making or from an inability to adapt to changes in the business environment.
STRATEGIC RISK AND THE RISK APPETITE STATEMENT
The Bank’s risk appetite statement defines the strategic risk tolerances to which the Bank and each business unit will adhere to in the execution of their respective business objectives. Strategic risk tolerances are established as a function of the Bank’s financial performance.
Financial metrics and associated tolerances are defined for the Bank and its lending business units.
The Bank manages strategic risk through a Board approved, robust, annual business planning process which includes the development of a comprehensive business plan, operating budget, and capital plan that contemplate planning horizons ranging from twelve to sixty months. The Bank augments its annual enterprise business planning process with the development of rigorous economic forecasts, risk and operational impact assessments related to any new business initiatives being contemplated as well as through the performance of an annual Internal Capital Adequacy Assessment Process (ICAAP) for the Bank. The ICAAP is employed to determine if the Bank’s budgeted capital amounts provide adequate capital buffers against the occurrence of its identified business objective risks under both expected and stressed operating conditions.
Reputational Risk
Reputational risk is the risk that an activity undertaken by the Bank or its representatives will impair its image in the community or lower public confidence in it, resulting in the loss of business, legal action or increased regulatory oversight.
Reputational risk is the outcome of a risk occurrence; it is not a risk event in and of itself. To manage against reputational risk, the Enterprise Risk Management program focuses on the risks of the Bank through the other six pillars of risk:
|
1. |
Liquidity Risk |
|
2. |
Operational Risk |
|
3. |
Market Risk |
|
4. |
Credit Risk |
|
5. |
Regulatory Risk |
|
6. |
Strategic Risk |
The management of the risks identified in these six pillars of risk and the measurement of the Bank in achieving its objectives and remaining within the bounds of the Bank’s risk appetite statement assist the Bank in managing reputational risk.
REPUTATIONAL RISK AND THE RISK APPETITE STATEMENT
The Bank’s risk appetite statement defines the reputational risk tolerances to which the Bank will adhere to in the execution of its business objectives.
An institution’s reputation is a valuable business asset in its own right that is essential to optimizing shareholder value, and as such is constantly at risk. Reputation risk cannot be managed in isolation from other forms of risk since all risks can have an impact on reputation, which in turn can impact the Bank’s brand, earnings and capital. Credit, market, operational, regulatory, strategic and liquidity risks must all be managed effectively in order to safeguard the Bank’s reputation.
Ultimate responsibility for the Bank’s reputation lies with senior and executive management, and the Board of Directors and related committees which examine reputation risk as part of their ongoing duties. In addition, every employee and representative of the Bank has a responsibility to contribute in a positive way to the Bank’s reputation by ensuring that ethical practices are followed at all times.
FACTORS THAT MAY AFFECT FUTURE RESULTS
As noted in the section “Forward-looking Statements”, the Bank is subject to inherent risks and uncertainties which may cause its actual results to differ materially from its expectations. Some of these risks are discussed below.
Impact of COVID-19 Pandemic
The impact of COVID-19 on communities and businesses has substantially abated over the course of the last half of the calendar year. Notwithstanding the above, should these favourable trends reverse as a result of hospitalizations increasing as a function of the emergence of new variants for which the current vaccines are not effective or simply as a result of active case counts generally rising rapidly, the Canadian and US economies could be negatively impacted which has the potential to adversely affect the Bank’s revenue and earnings.
Execution of Strategic Plans
The Bank’s financial performance is influenced by its ability to execute strategic plans developed by management. If these strategic plans do not meet with success or there is a change in the Bank’s strategic plans, the Bank’s earnings could grow at a slower pace or potentially decline.
Changes in Laws and Regulations
Laws and regulations are in place to protect clients, investors and the public. Changes in laws and regulations, including how they are interpreted and enforced, could adversely affect the Bank’s earnings by allowing more competition in the marketplace and by increasing the costs of compliance. In addition, any failure to comply with laws and regulations could adversely affect the Bank’s reputation and earnings.
Changes in Accounting Standards and Accounting Policies and Estimates
The International Accounting Standards Board continues to change the financial accounting and reporting standards that govern the preparation of the Bank’s financial statements. These changes can be significant and may materially impact how the Bank records its financial position and its results of operations. Where the Bank is required to retroactively apply a new or revised standard, it may be required to restate prior period financial results.
Level of Competition
The level of competition among financial institutions is high and non-financial companies and government entities are increasingly offering services typically provided by banks. This could have an effect on the pricing of the Bank’s deposits and its lending products and together with loss of market share, could adversely affect the Bank’s earnings.
General Economic Conditions
The Bank conducts its business in various regions within Canada and the US. Factors such as financial market stability, interest rates, foreign exchange rates, changing global commodity prices, business investment, government spending and stimulation initiatives, consumer spending, geo-political risk and the rate of inflation can affect the business and economic environments in each geographic region in which the Bank operates. Therefore, the amount of business that the Bank conducts in a specific geographic region may have an effect on the Bank’s overall revenues and earnings.
Monetary Policy
Financial markets’ expectations about inflation and central bank monetary policy have an impact on the level of interest rates. Fluctuations in interest rates that result from these changes could have an impact on the regions in which the Bank operates, and further, could have an impact on the Bank’s earnings.
Reliance on Deposit Brokers
The Bank raises its deposits primarily through a network of deposit brokers across Canada, including independents as well as the investment dealer subsidiaries of the large Canadian banks. The failure by the Bank to secure sufficient deposits from its broker network could negatively impact its financial condition and operating results. The Bank mitigates this risk by establishing and maintaining good working and mutually beneficial relationships with a diverse group of deposit brokers so as not to become overly reliant on any single deposit broker.
Technology Risk
Technology risk is related to the operational performance, confidentiality, integrity and availability of information systems and infrastructure. The Bank is highly dependent upon information technology and supporting infrastructure such as data and network access. Disruptions in information technology and infrastructure, whether attributed to internal or external factors, and including potential disruptions in services provided by various third parties, could adversely affect the ability of the Bank to conduct regular business and/or to deliver products and services to its clients.
CONTROLS AND PROCEDURES
Disclosure Controls and Procedures
Disclosure controls and procedures are designed to provide reasonable assurance that all material information is gathered and reported to senior management, including the Chief Executive Officer and the Chief Financial Officer, on a timely basis so that appropriate decisions can be made regarding public disclosure.
As at October 31, 2022, an evaluation was carried out by management of the effectiveness of the Bank’s disclosure controls and procedures. Based on that evaluation, the Chief Executive Officer and Chief Financial Officer will file a certificate that the design and operating effectiveness of those disclosure controls and procedures were effective.
Internal Control over Financial Reporting
Internal control over financial reporting is designed to provide reasonable assurance regarding the reliability of financial reporting and the preparation of financial statements in accordance with International Financial Reporting Standards. Management is responsible for establishing and maintaining adequate internal control over financial reporting for the Bank.
At October 31, 2022, an evaluation was carried out by management related to the effectiveness of internal controls over financial reporting to provide reasonable assurance regarding the reliability of financial reporting and financial statement compliance with International Financial Reporting Standards. Based on that evaluation, the Chief Executive Officer and Chief Financial Officer will file a certificate that the design and operating effectiveness of internal controls over financial reporting is effective. These evaluations were conducted in accordance with the standards of the 2013 Internal Control – Integrated Framework of the Committee of Sponsoring Organizations of the Treadway Commission (COSO), and the requirements of National Instrument 52-109 Certification of Disclosure in Issuers’ Annual and Interim Filings of the Canadian Securities Administrators.
A Disclosure Committee, consisting of members of senior management, assists the Chief Executive Officer and the Chief Financial Officer in their responsibilities related to evaluating the effectiveness of the Bank’s internal control systems and processes. Management’s evaluation of controls can only provide reasonable, not absolute, assurance that all internal control issues that may result in material misstatement, if any, have been detected.
There were no changes in the Bank’s internal controls over financial reporting that occurred during the year ended October 31, 2022 that have materially affected, or are reasonably likely to materially affect, internal controls over financial reporting.
Non-GAAP and Other Financial Measures
Non-GAAP and other financial measures are not standardized financial measures under financial reporting framework used to prepare the financial statements of the Bank’s to which these measures relate. These measures may not be comparable to similar financial measures disclosed by other issuers. The Bank uses these financial measures to assess its performance and as such believes these financial measures are useful in providing readers with a better understanding of how management assesses the Bank’s performance.
Non-GAAP Measures
Return on Average Common Equity is defined as annualized net income less amounts relating to preferred share dividends, divided by average common shareholders’ equity which is average shareholders’ equity less amounts relating to preferred shares recorded in equity.
|
October 31 |
October 31 |
October 31 |
||||||||||
|
(thousands of Canadian dollars) |
2022 |
2021 |
2020 |
|||||||||
|
Return on average common equity |
||||||||||||
|
Net income |
22,658 | 22,380 | 19,405 | |||||||||
|
Preferred share dividends |
(988 | ) | (1,578 | ) | (2,168 | ) | ||||||
|
Adjusted net income |
21,670 | 20,802 | 17,237 | |||||||||
|
Average common equity |
327,744 | 246,159 | 218,388 | |||||||||
|
Return on average common equity |
6.61 | % | 8.45 | % | 7.89 | % | ||||||
Book Value per Common Share is defined as Shareholders’ Equity less amounts relating to preferred shares recorded in equity, divided by the number of common shares outstanding.
|
October 31 |
October 31 |
October 31 |
||||||||||
|
(thousands of Canadian dollars) |
2022 |
2021 |
2020 |
|||||||||
|
Book value per common share |
||||||||||||
|
Common equity |
337,029 | 318,459 | 225,950 | |||||||||
|
Shares outstanding |
27,245,782 | 27,441,082 | 21,123,559 | |||||||||
|
Book value per common share |
12.37 | 11.61 | 10.70 | |||||||||
Return on Average Total Assets is defined as annualized net income less amounts relating to preferred share dividends, divided by average total assets.
|
October 31 |
October 31 |
October 31 |
||||||||||
|
(thousands of Canadian dollars) |
2022 |
2021 |
2020 |
|||||||||
|
Return on average total assets |
||||||||||||
|
Net income |
22,658 | 22,380 | 19,405 | |||||||||
|
Preferred share dividends |
(988 | ) | (1,578 | ) | (2,168 | ) | ||||||
|
Adjusted net income |
21,670 | 20,802 | 17,237 | |||||||||
|
Average Assets |
2,840,542 | 2,179,486 | 1,864,633 | |||||||||
|
Return on average total assets |
0.76 | % | 0.95 | % | 0.92 | % | ||||||
Other Financial Measures
Yield is calculated as interest income (as presented in the Consolidated Statements of Comprehensive Income) divided by average total assets. Yield does not have a standardized meaning prescribed by IFRS and, therefore, may not be comparable to similar measures presented by other financial institutions.
Cost of Funds is calculated as interest expense (as presented in the Consolidated Statements of Comprehensive Income) divided by average total assets. Cost of funds does not have a standardized meaning prescribed by IFRS and, therefore, may not be comparable to similar measures presented by other financial institutions.
Net Interest Margin or Spread are calculated as net interest income divided by average total assets. Net interest margin or spread does not have a standardized meaning prescribed by IFRS and, therefore, may not be comparable to similar measures presented by other financial institutions.
Net Interest Margin on Loans is calculated as net interest income adjusted for the impact of cash, securities and other assets, divided by average gross loans. This metric does not have a standardized meaning prescribed by IFRS and, therefore, may not be comparable to similar measures presented by other financial institutions.
Efficiency Ratio is calculated as non-interest expenses from consolidated operations as a percentage of total revenue (as presented in the interim Consolidated Statements of Comprehensive Income). This ratio does not have a standardized meaning prescribed by IFRS and, therefore, may not be comparable to similar measures presented by other financial institutions.
Efficiency Ratio Digital Banking is calculated as non-interest expenses from the Digital Banking operations as a percentage of total revenue from the Digital Banking operations. This ratio does not have a standardized meaning prescribed by IFRS and, therefore, may not be comparable to similar measures presented by other financial institutions.
Gross Impaired Loans to Total Loans captures gross impaired loan balances as a percentage of VersaBank’s loans, net of allowance for credit losses. This percentage does not have a standardized meaning prescribed by IFRS and, therefore, may not be comparable to similar measures presented by other financial institutions.
Provision for (Recovery of) Credit Losses as a Percentage of Average Total Loans captures the provision for (recovery of) credit losses (as presented in the interim Consolidated Statements of Comprehensive Income) as a percentage of VersaBank’s average loans, net of allowance for credit losses. This percentage does not have a standardized meaning prescribed by IFRS and, therefore, may not be comparable to similar measures presented by other financial institutions.
Basel III Common Equity Tier 1, Tier 1, Total Capital Adequacy and Leverage Ratios are determined in accordance with guidelines issued by the Office of the Superintendent of Financial Institutions (Canada) (OSFI).
FOR FURTHER INFORMATION PLEASE CONTACT:
LodeRock Advisors: Lawrence Chamberlain (416) 519-4196,
lawrence.chamberlain@loderockadvisors.com
Visit our website at: www.versabank.com
Corporate Information
|
DIRECTORS
The Honourable Thomas A. Hockin, P.C., B.A, M.P.A., Ph.D., ICD.D Chairman of the Board Retired, former Executive Director of the International Monetary Fund
Gabrielle Bochynek, B.A. CHRL Principal, Human Resources and Labour Relations, The Osborne Group
Robbert-Jan Brabander, M.Sc. and B.Sc. (Economics) Managing Director of Bells & Whistles Communications, Inc.
David A. Bratton, B.A.(Hons), M.B.A., CHRL, FCMC Retired, former President of Bratton Consulting Inc.
Peter M. Irwin, B.A. (Hons.) Retired, former Managing Director, CIBC Worlds Markets Inc.
Richard H. L. Jankura, BBA (Hons), CPA, CA Retired, former Corporate Advisor and CFO of Jones Healthcare Group
Art Linton, JD Barrister & Solicitor
Susan T. McGovern, B.Sc. Former Vice-President, External Relations and Advancement Ontario Tech University
Paul G. Oliver, FCPA, FCA, ICD.D. Retired, former partner of PricewaterhouseCoopers LLP
David R. Taylor, B.Sc. (Hons), M.B.A., F.I.C.B. President & Chief Executive Officer, VersaBank |
OFFICERS AND SENIOR MANAGEMENT
David R. Taylor, B.Sc. (Hons), M.B.A., F.I.C.B. President & Chief Executive Officer
Shawn Clarke, M.Eng., P.Eng., M.B.A. Chief Financial Officer
Michael Dixon, B.Comm., M.B.A. Senior Vice President, Point-Of-Sale Financing
Scott A. Mizzen, B.A., LL.B. Senior Vice President, Commercial Lending
Nick Kristo, B.Comm., M.B.A. Chief Credit Officer
Tammie Ashton, B.A., LL.B Chief Risk Officer
Garry Clement, CAMS, CFE, CFCS, FIS, CCI Chief Anti-Money Laundering Officer
John Asma, M.B.A. Treasurer
Steve Creery, B.A. (Economics) Vice President, Credit
Brent T. Hodge, HBA, JD, CIPP/C Vice President, General Counsel & Corporate Secretary, Chief Compliance Officer
Saad Inam, B.Comm., M.B.A. Vice President, Credit
Joanne Johnston, B.Comm., CPA, CA, CIA Chief Internal Auditor
Wooi Koay, B.Comm., B.Sc. Chief Information Officer
Tel Matrundola, Hons. B.A., M.A., Ph,D. Chief Strategist, Cybersecurity
Nancy McCutcheon, HBA, MA, CPA, CGA Vice President, TIB Business Development
Andy Min, B.A., CPA, CA Vice President, Finance & Corporate Accounting
Gurpreet Sahota, CISSP, CCSP. Chief Architect, Cybersecurity
Jonathan F.P. Taylor, B.B.A., CHRL Chief Human Resources Officer
David Thoms, B.A., M.B.A. Vice President, Structured Finance
Barbara Todres, B.Comm Hons. Vice President, Deposit Services
Terri Wilson Vice President, Investment & Risk Control |
|
SOLICITORS Stikeman Elliott LLP 5300 Commerce Court West 199 Bay Street Toronto, Ontario M5L 1B9 |
AUDITORS KPMG LLP 333 Bay Street, Suite 3300 Toronto, Ontario M5H 2S5 |
|
TRANSFER AGENT |
BANK |
|
Computershare Investor Services Inc. |
Royal Bank of Canada |
|
100 University Avenue |
Main Branch, 154 1st Avenue South |
|
Toronto, Ontario M5J 2Y1 |
Saskatoon, Saskatchewan S7K 1K2 |
STOCK EXCHANGE LISTINGS
| Toronto Stock Exchange | NASDAQ |
| Trading Symbol: VBNK, VB.PR.A | Trading Symbol: VBNK |
CORPORATE OFFICES
|
Head Office |
|
Suite 2002 - 140 Fullarton Street |
|
London, Ontario N6A 5P2 |
|
Telephone: (519) 645-1919 |
|
Toll-free: (866) 979-1919 |
|
Fax: (519) 645-2060 |
|
VersaBank Innovation Centre of Excellence |
Saskatoon Office |
|
1979 Otter Place |
410 - 121 Research Drive |
|
London, Ontario N5V 0A3 |
Saskatoon, Saskatchewan S7N 1K2 |
|
Telephone: (519) 645-1919 |
Telephone: (306) 244-1868 |
|
Toll-free: (866) 979-1919 |
Toll-free: (800) 213-4282 |
|
Fax: (519) 645-2060 |
Fax: (306) 244-4649 |
INVESTOR RELATIONS
Toll Free Telephone: (800) 244-1509
Email: InvestorRelations@versabank.com
Web site: www.versabank.com
LodeRock Advisors
lawrence.chamberlain@loderockadvisors.com
Telephone: (416) 519-4196