

FY23 Q3 GENESCO Summary Results December 2, 2022 Exhibit 99.2
/t Safe Harbor Statement This presentation contains forward-looking statements, including those regarding future sales, earnings, operating income, gross margins, expenses, capital expenditures, depreciation and amortization, tax rates, stores openings and closures, ESG progress and all other statements not addressing solely historical facts or present conditions. Forward- looking statements are usually identified by or are associated with such words as “intend,” “expect,” “feel,” “believe,” “anticipate,” “optimistic” and similar terminology. Actual results could vary materially from the expectations reflected in these statements. A number of factors could cause differences. These include adjustments to projections reflected in forward-looking statements, including those resulting from the effects of COVID-19 on the Company’s business, including COVID-19 case spikes in locations in which the Company operates, additional stores closures due to COVID-19, weakness in store and shopping mall traffic, restrictions on operations imposed by government entities and/or landlords, changes in public safety and health requirements, and limitations on the Company’s ability to adequately staff and operate stores. Differences from expectations could also result from stores closures and effects on the business as a result of civil disturbances; the level and timing of promotional activity necessary to maintain inventories at appropriate levels; our ability to pass on price increases to our customers; the imposition of tariffs on product imported by the Company or its vendors as well as the ability and costs to move production of products in response to tariffs; the Company’s ability to obtain from suppliers products that are in-demand on a timely basis and effectively manage disruptions in product supply or distribution, including disruptions as a result of COVID-19 or geopolitical events; unfavorable trends in fuel costs, foreign exchange rates, foreign labor and material costs, and other factors affecting the cost of products; the effects of the British decision to exit the European Union, impacts of the Russia-Ukraine war, and other sources of market weakness in the U.K. and Republic of Ireland; the effectiveness of the Company's omnichannel initiatives; costs associated with changes in minimum wage and overtime requirements; wage pressure in the U.S. and the U.K.; weakness in the consumer economy and retail industry; competition and fashion trends in the Company's markets; risks related to the potential for terrorist events; risks related to public health and safety events; changes in buying patterns by significant wholesale customers; retained liabilities associated with divestitures of businesses including potential liabilities under leases as the prior tenant or as a guarantor; and changes in the timing of holidays or in the onset of seasonal weather affecting period-to-period sales comparisons. Additional factors that could cause differences from expectations include the ability to renew leases in existing stores and control or lower occupancy costs, and to conduct required remodeling or refurbishment on schedule and at expected expense levels; the Company’s ability to realize anticipated cost savings, including rent savings; the amount and timing of share repurchases; the Company’s ability to achieve expected digital gains and gain market share; deterioration in the performance of individual businesses or of the Company's market value relative to its book value, resulting in impairments of fixed assets, operating lease right of use assets or intangible assets or other adverse financial consequences and the timing and amount of such impairments or other consequences; unexpected changes to the market for the Company's shares or for the retail sector in general; our ability to meet our sustainability, stewardship, emission and diversity, equity and inclusion related ESG projections, goals and commitments; costs and reputational harm as a result of disruptions in the Company’s business or information technology systems either by security breaches and incidents or by potential problems associated with the implementation of new or upgraded systems; the Company’s ability to realize any anticipated tax benefits in both the amount and timeframe anticipated; and the cost and outcome of litigation, investigations and environmental matters involving the Company. Additional factors are cited in the "Risk Factors," "Legal Proceedings" and "Management's Discussion and Analysis of Financial Condition and Results of Operations" sections of, and elsewhere in, the Company’s SEC filings, copies of which may be obtained from the SEC website, www.sec.gov, or by contacting the investor relations department of Genesco via the Company’s website, www.genesco.com. Many of the factors that will determine the outcome of the subject matter of this release are beyond Genesco's ability to control or predict. Genesco undertakes no obligation to release publicly the results of any revisions to these forward-looking statements that may be made to reflect events or circumstances after the date hereof or to reflect the occurrence of unanticipated events. Forward-looking statements reflect the expectations of the Company at the time they are made. The Company disclaims any obligation to update such statements.
We report consolidated financial results in accordance with generally accepted accounting principles (“GAAP”). However, to supplement these consolidated financial results our presentation includes certain non-GAAP financial measures such as earnings and earnings per share and operating income. This supplemental information should not be considered in isolation as a substitute for related GAAP measures. We believe that disclosure of earnings and earnings per share from continuing operations and operating income adjusted for the items not reflected in the previously announced expectations will be meaningful to investors, especially in light of the impact of such items on the results. Reconciliations of the non-GAAP supplemental information to the comparable GAAP measures can be found in the Appendix. NON-GAAP Financial Measures
What We Aspire To Do Create and curate leading footwear brands that represent style, innovation and self-expression; be the destination for our consumers’ favorite fashion footwear How We Will Achieve Our Aspiration Build enduring relationships with our target customers, grounded in unparalleled consumer and market insights Excite and constantly exceed expectations by delivering distinctive experiences and products, using our deep direct-to-consumer expertise across digital and physical Our Footwear Focused Vision & Strategy
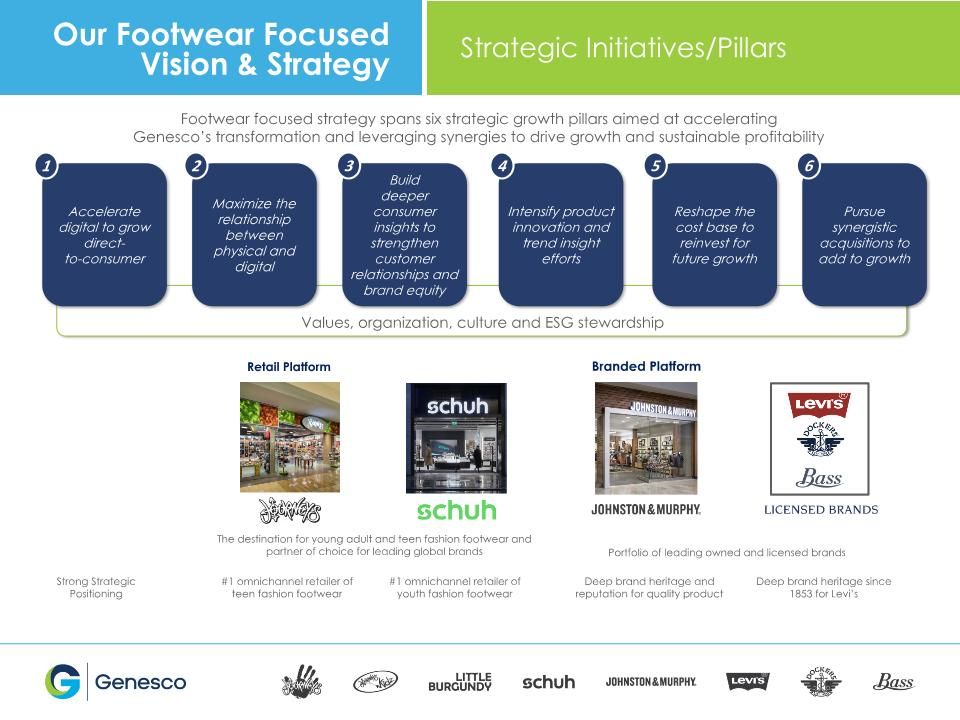
Strategic Initiatives/Pillars Our Footwear Focused Vision & Strategy Footwear focused strategy spans six strategic growth pillars aimed at accelerating Genesco’s transformation and leveraging synergies to drive growth and sustainable profitability Values, organization, culture and ESG stewardship Accelerate digital to grow direct- to-consumer Maximize the relationship between physical and digital Build deeper consumer insights to strengthen customer relationships and brand equity Intensify product innovation and trend insight efforts Reshape the cost base to reinvest for future growth Pursue synergistic acquisitions to add to growth 1 2 3 4 5 6 Retail Platform Branded Platform The destination for young adult and teen fashion footwear and partner of choice for leading global brands Portfolio of leading owned and licensed brands Strong Strategic Positioning #1 omnichannel retailer of teen fashion footwear #1 omnichannel retailer of youth fashion footwear Deep brand heritage and reputation for quality product Deep brand heritage since 1853 for Levi’s
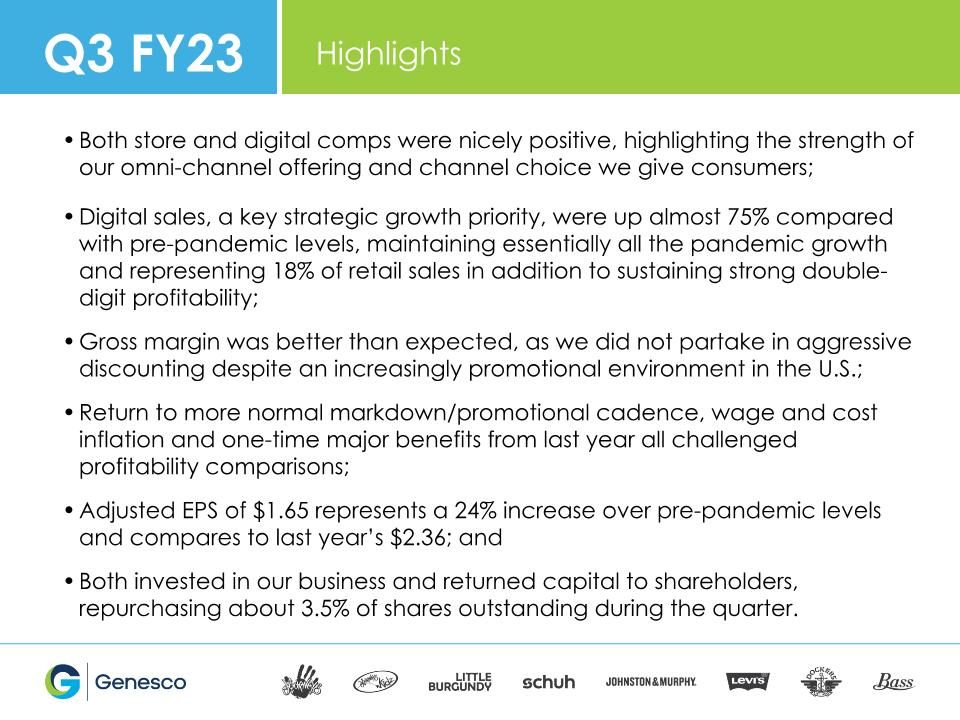
Q3 FY23 Highlights Both store and digital comps were nicely positive, highlighting the strength of our omni-channel offering and channel choice we give consumers; Digital sales, a key strategic growth priority, were up almost 75% compared with pre-pandemic levels, maintaining essentially all the pandemic growth and representing 18% of retail sales in addition to sustaining strong double-digit profitability; Gross margin was better than expected, as we did not partake in aggressive discounting despite an increasingly promotional environment in the U.S.; Return to more normal markdown/promotional cadence, wage and cost inflation and one-time major benefits from last year all challenged profitability comparisons; Adjusted EPS of $1.65 represents a 24% increase over pre-pandemic levels and compares to last year’s $2.36; and Both invested in our business and returned capital to shareholders, repurchasing about 3.5% of shares outstanding during the quarter.
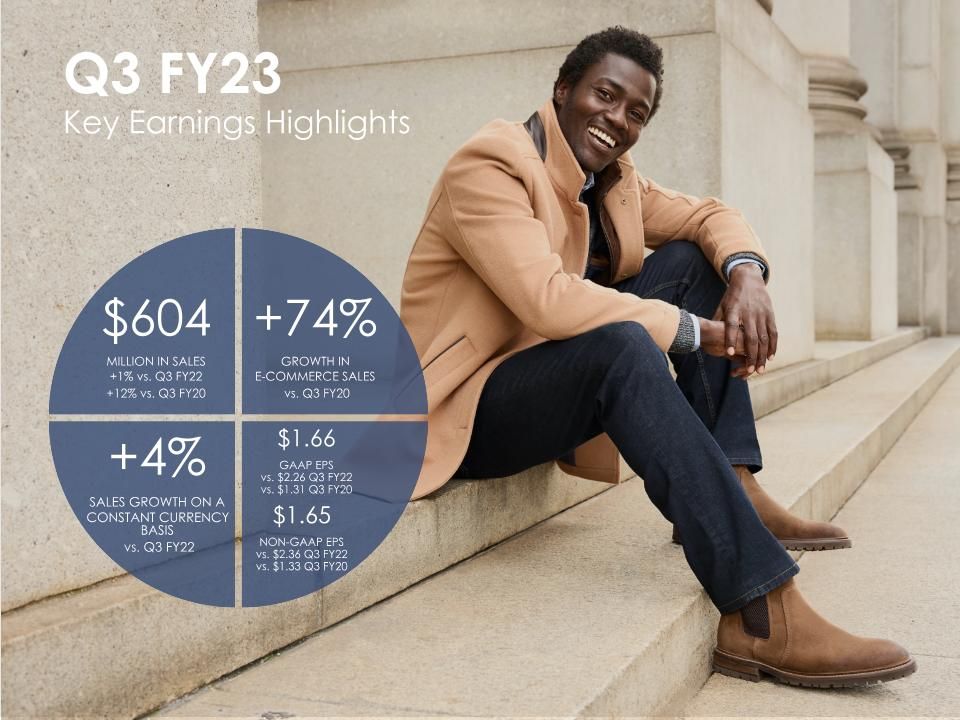
$604 MILLION IN SALES +1% vs. Q3 FY22 +12% vs. Q3 FY20 $1.66 GAAP EPS vs. $2.26 Q3 FY22 vs. $1.31 Q3 FY20 +4% SALES GROWTH ON A CONSTANT CURRENCY BASIS vs. Q3 FY22 Q3 FY23 Key Earnings Highlights +74% GROWTH IN E-COMMERCE SALES vs. Q3 FY20 $1.65 NON-GAAP EPS vs. $2.36 Q3 FY22 vs. $1.33 Q3 FY20
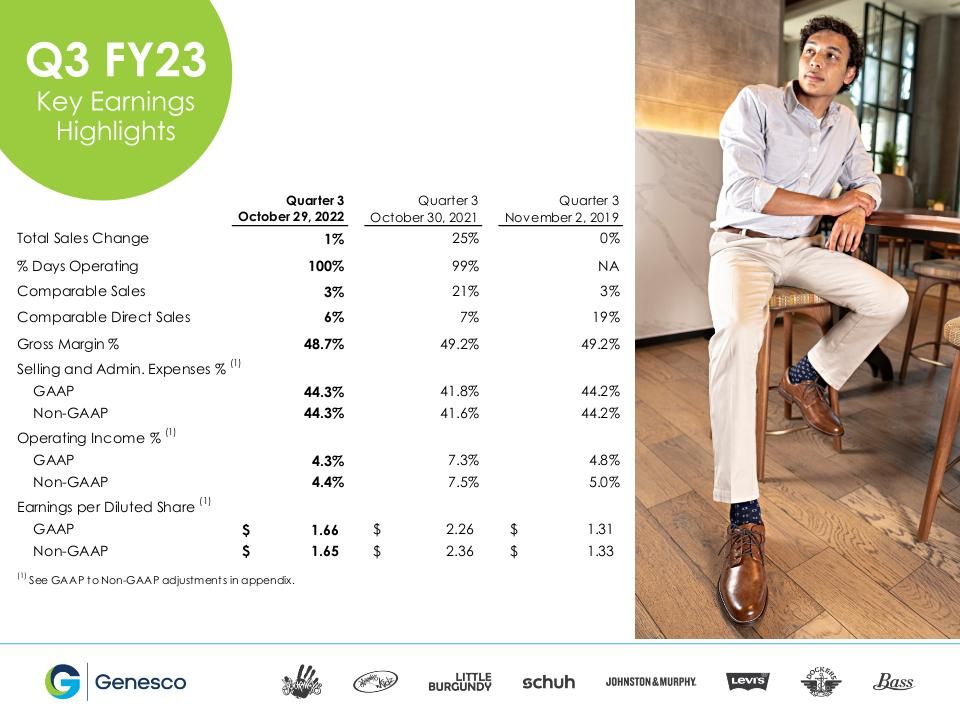
Q3 FY23 Key Earnings Highlights
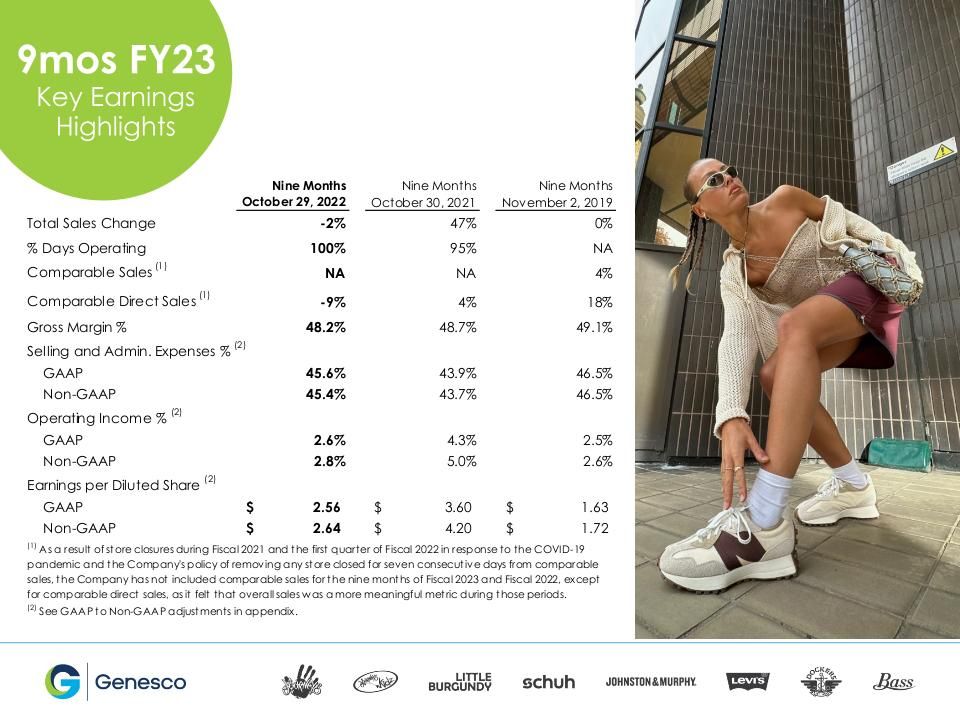
9mos FY23 Key Earnings Highlights
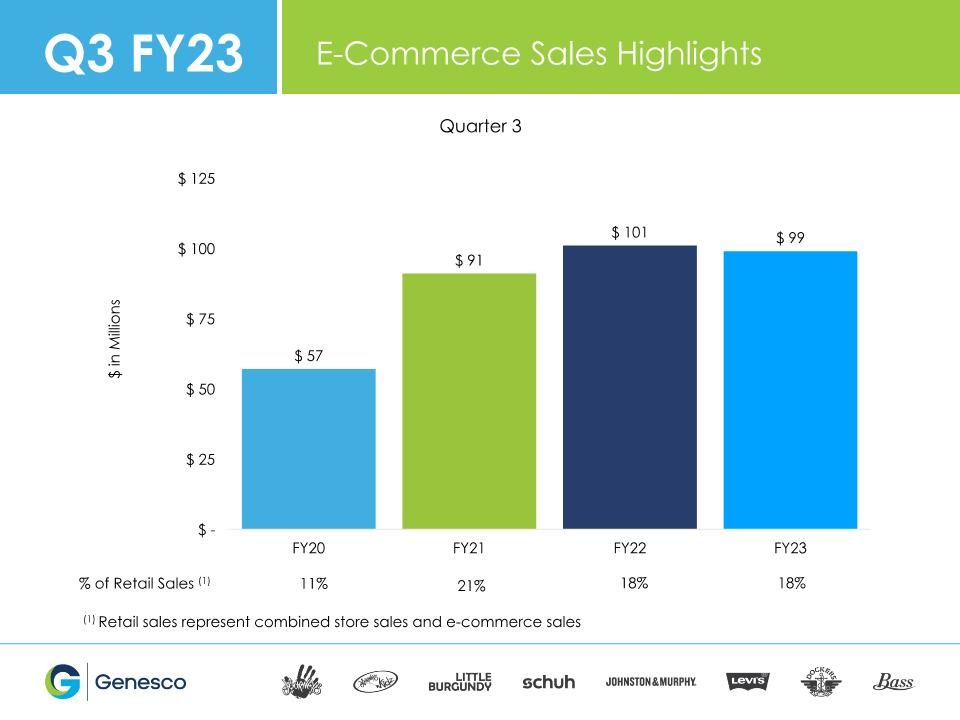
Q3 FY23 E-Commerce Sales Highlights % of Retail Sales (1) 11% 21% 18% 18% (1) Retail sales represent combined store sales and e-commerce sales
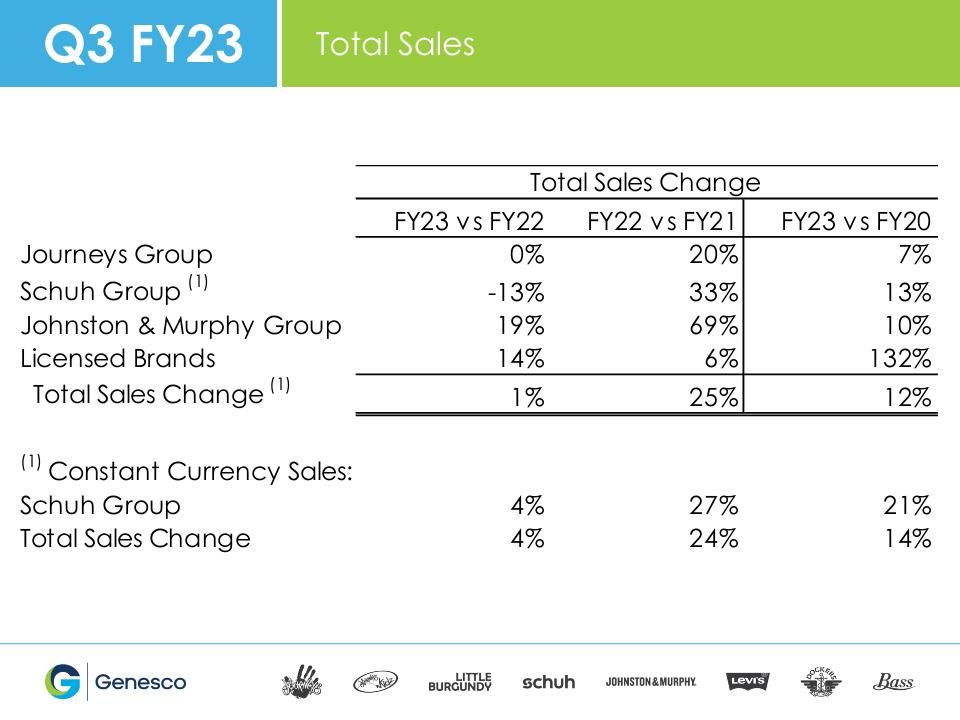
Q3 FY23 Total Sales
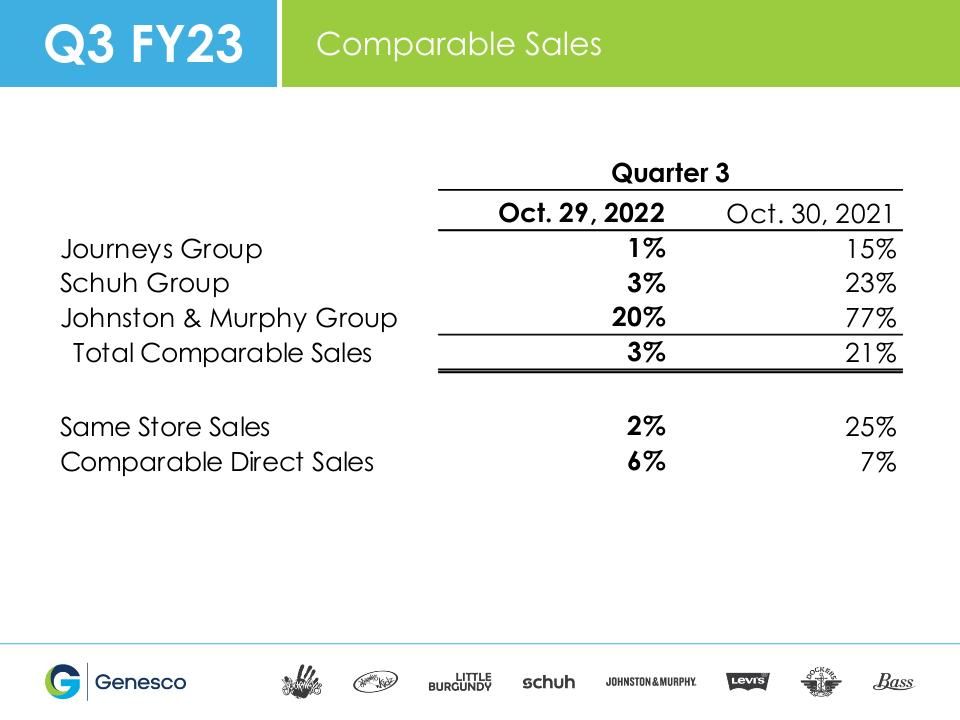
Q3 FY23 Comparable Sales
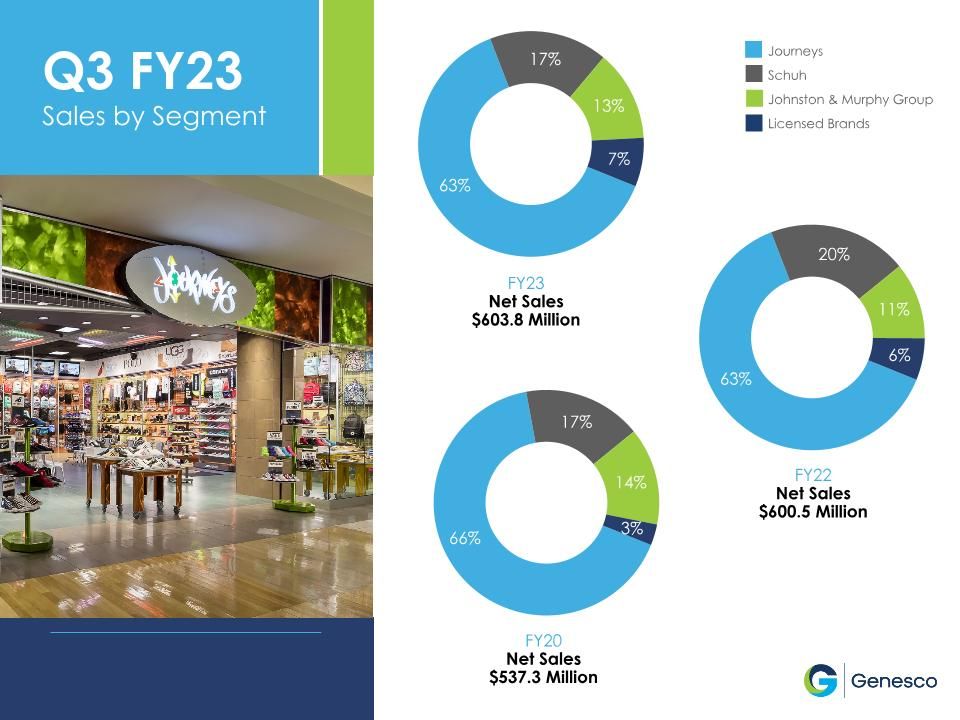
Q3 FY23 Sales by Segment FY20 Net Sales $537.3 Million FY23 Net Sales $603.8 Million FY22 Net Sales $600.5 Million Journeys Schuh Johnston & Murphy Group Licensed Brands
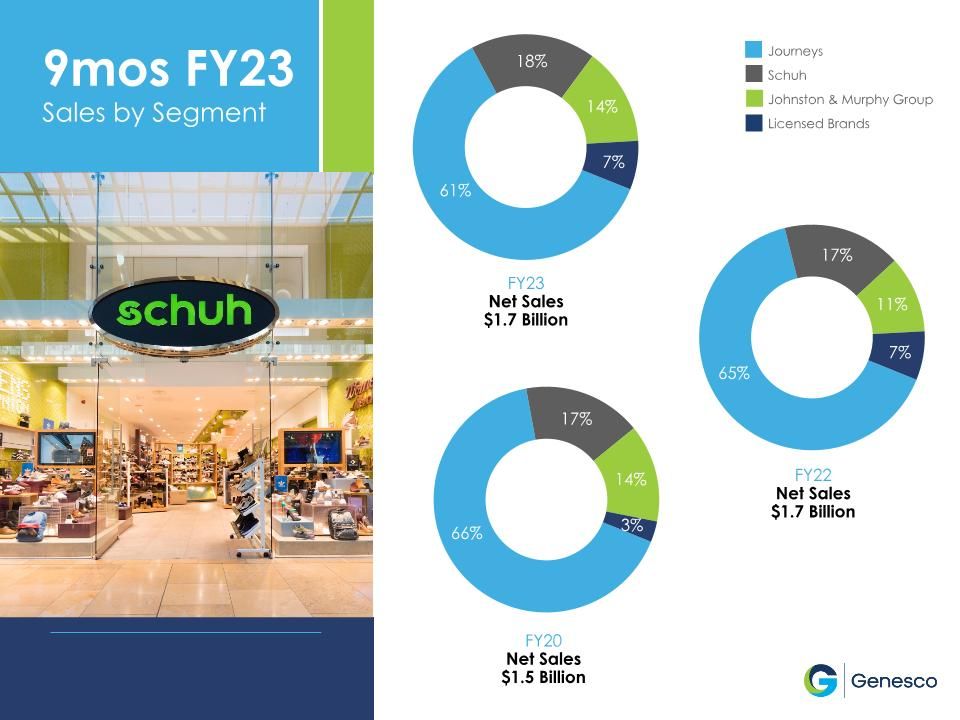
FY20 Net Sales $1.5 Billion FY23 Net Sales $1.7 Billion FY22 Net Sales $1.7 Billion Journeys Schuh Johnston & Murphy Group Licensed Brands 9mos FY23 Sales by Segment
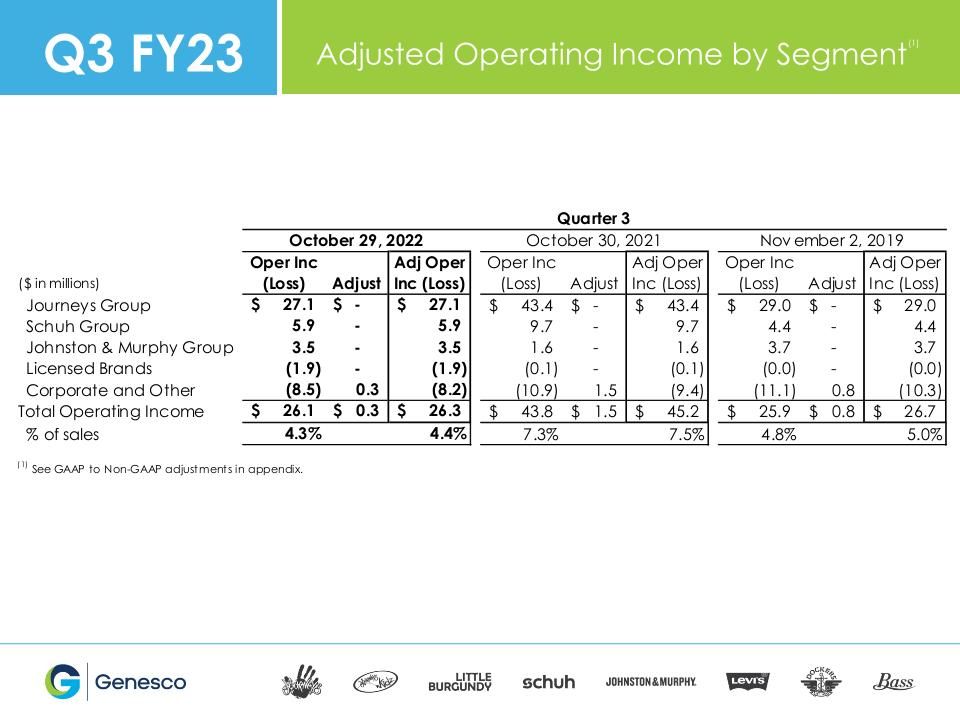
(1) Q3 FY23 Adjusted Operating Income by Segment
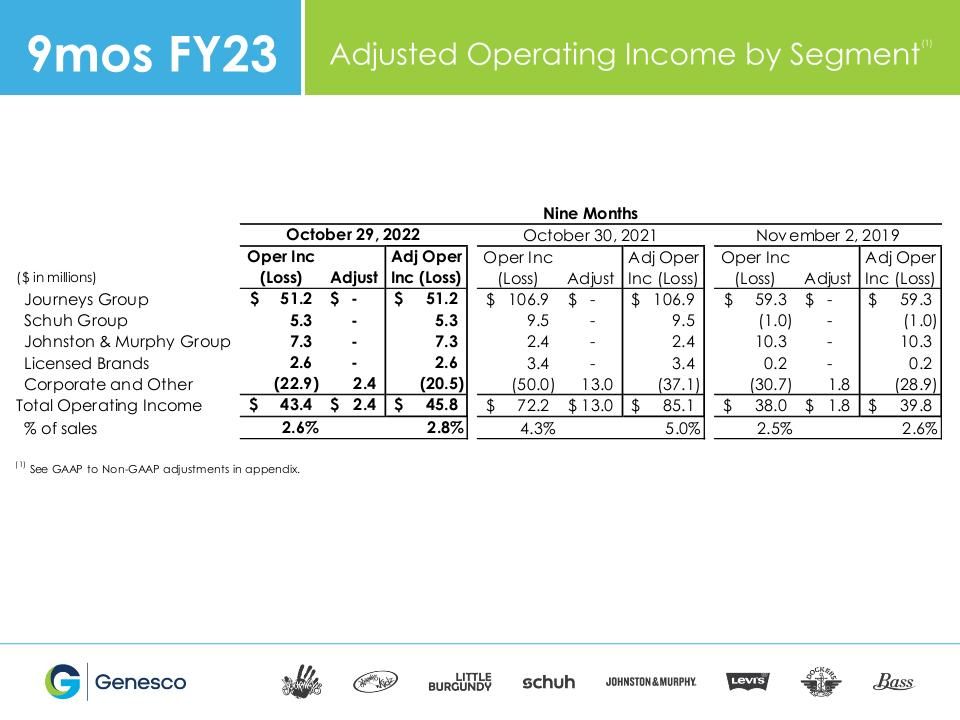
(1) 9mos FY23 Adjusted Operating Income by Segment
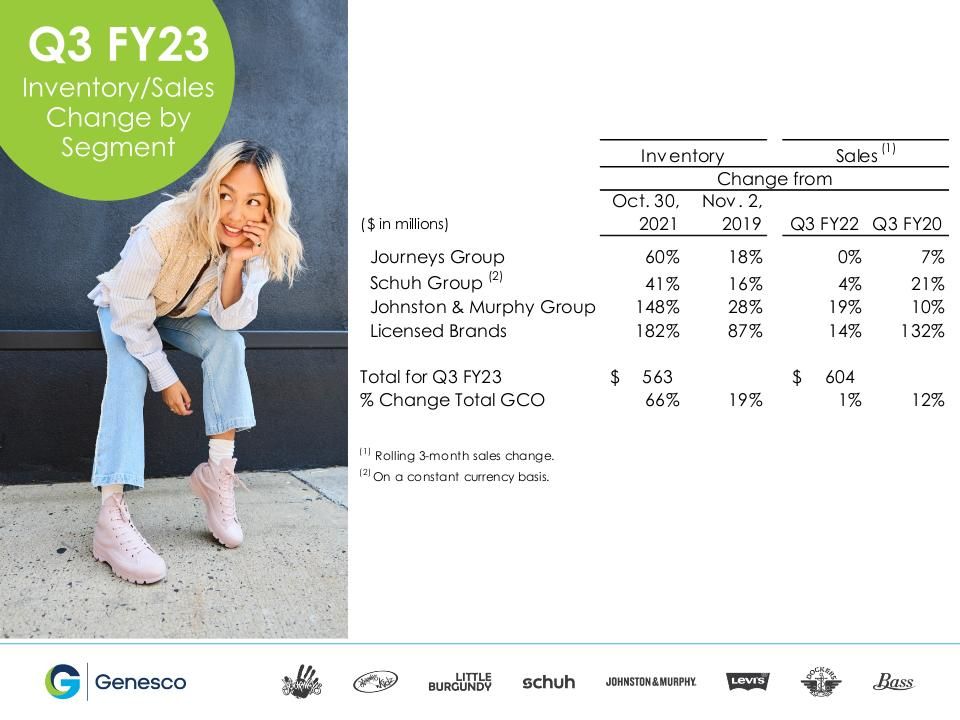
Q3 FY23 Inventory/Sales Change by Segment
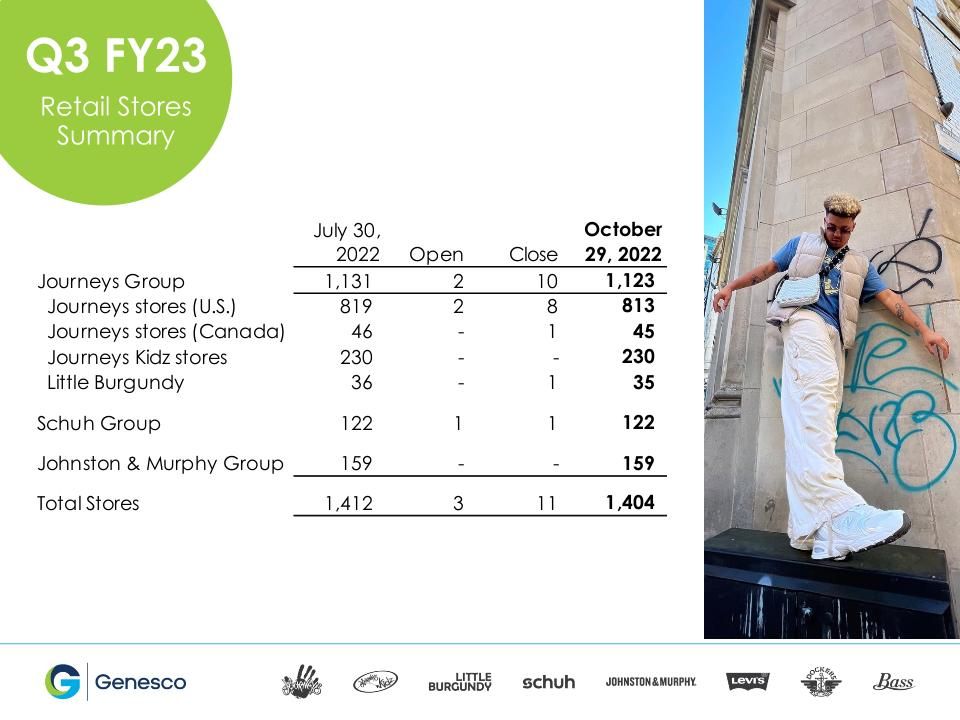
Q3 FY23 Retail Stores Summary
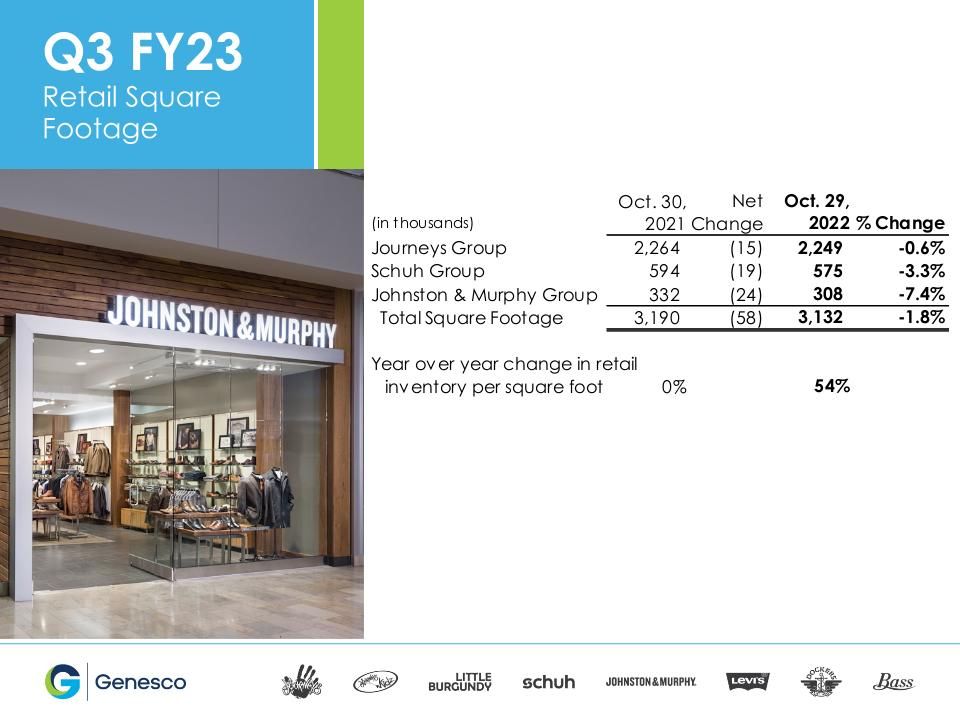
For Q3 FY23 Retail Square Footage
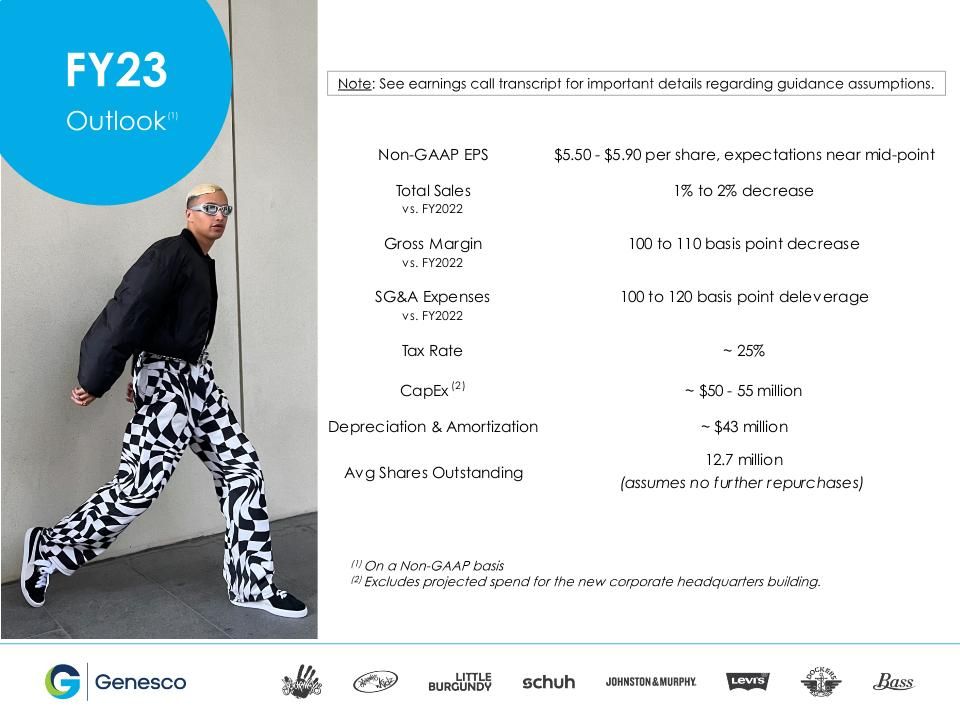
FY23 Outlook (1) Note: See earnings call transcript for important details regarding guidance assumptions. (1) On a Non-GAAP basis (2) Excludes projected spend for the new corporate headquarters building.
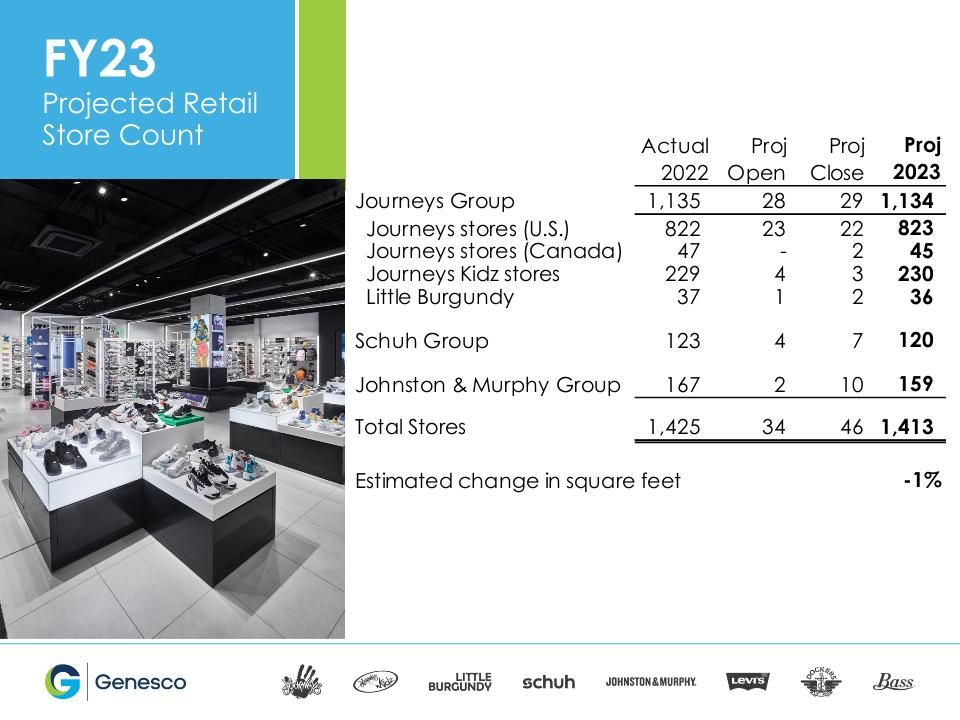
FY23 Projected Retail Store Count
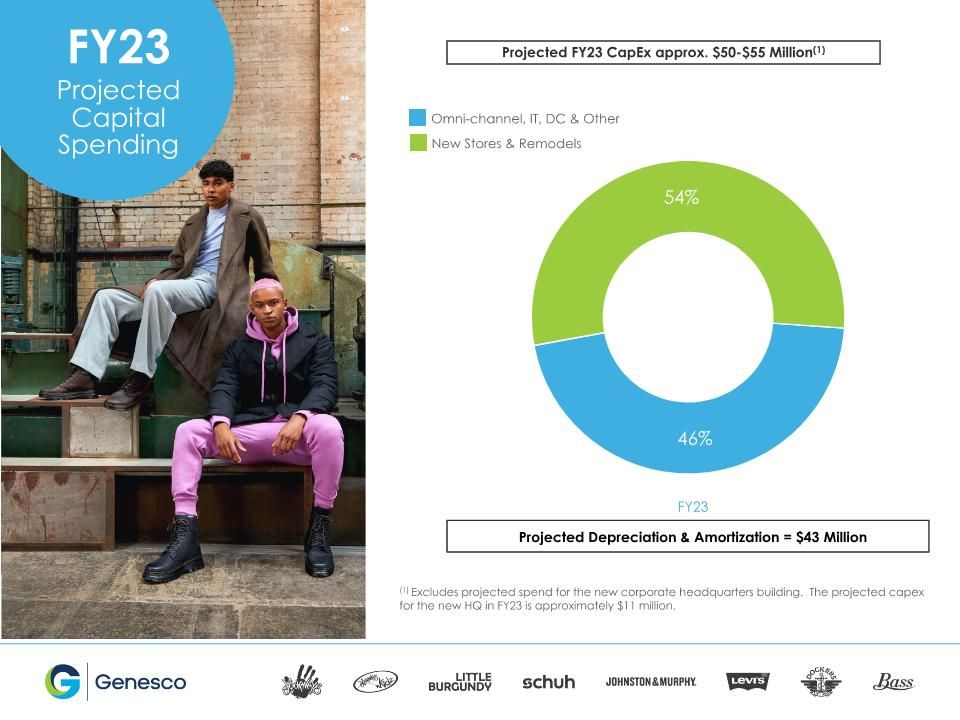
Omni-channel, IT, DC & Other New Stores & Remodels Projected FY23 CapEx approx. $50-$55 Million(1) FY23 Projected Depreciation & Amortization = $43 Million (1) Excludes projected spend for the new corporate headquarters building. The projected capex for the new HQ in FY23 is approximately $11 million. FY23 Projected Capital Spending

Appendix
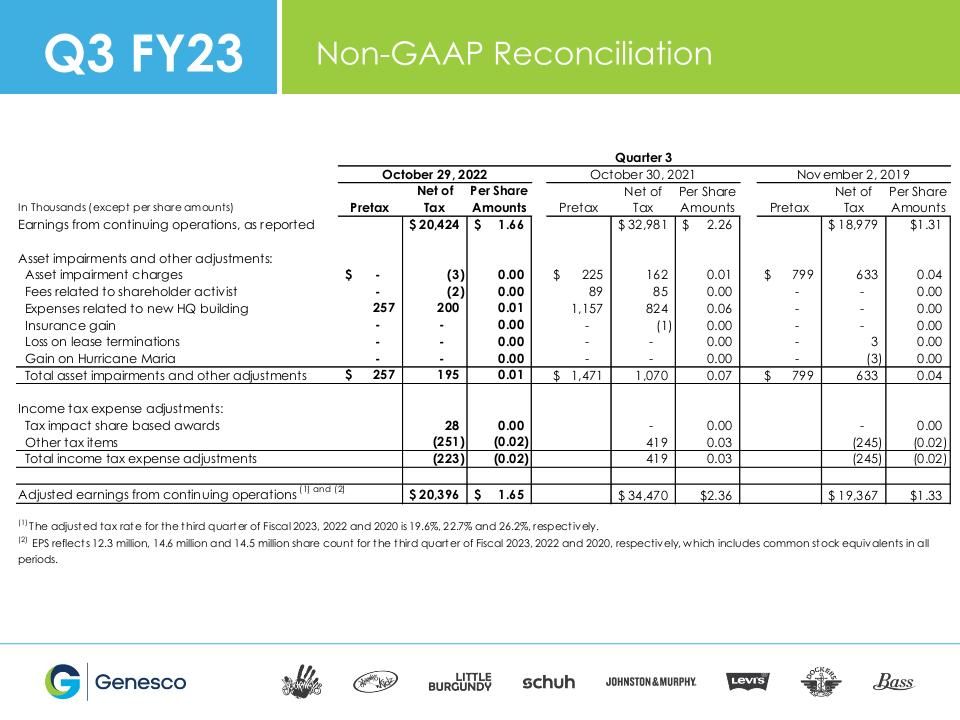
Q3 FY23 Non-GAAP Reconciliation
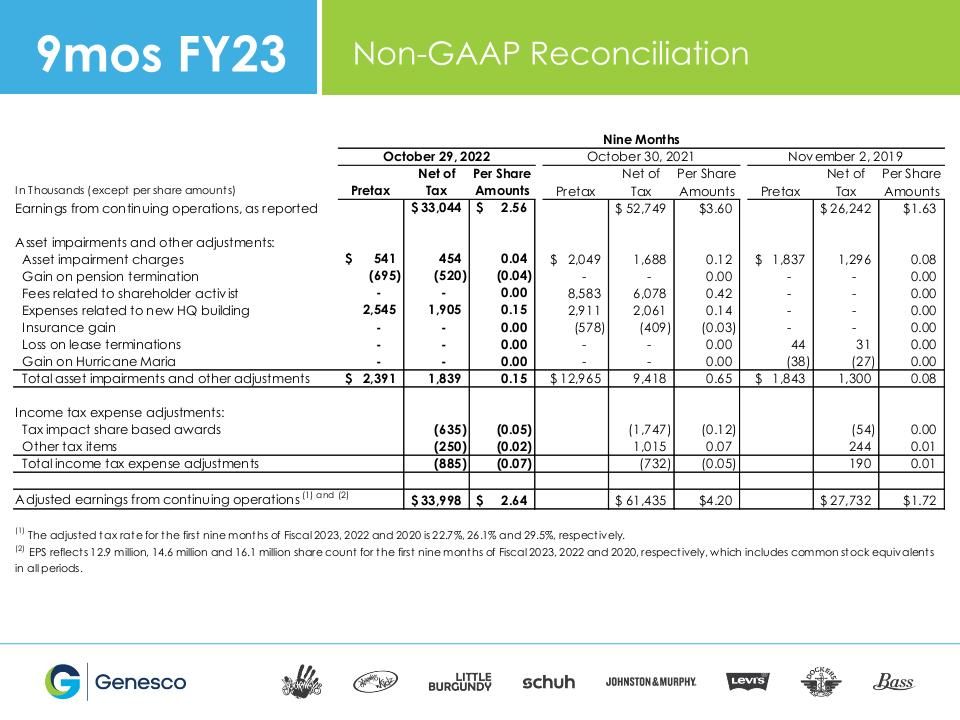
9mos FY23 Non-GAAP Reconciliation
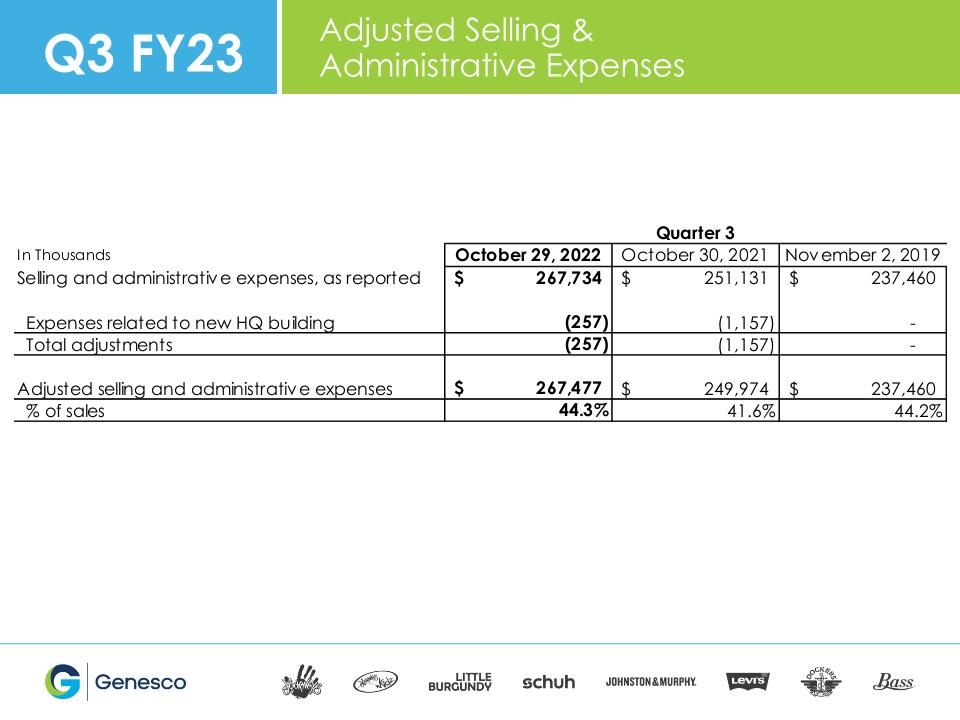
Q3 FY23 Adjusted Selling & Administrative Expenses
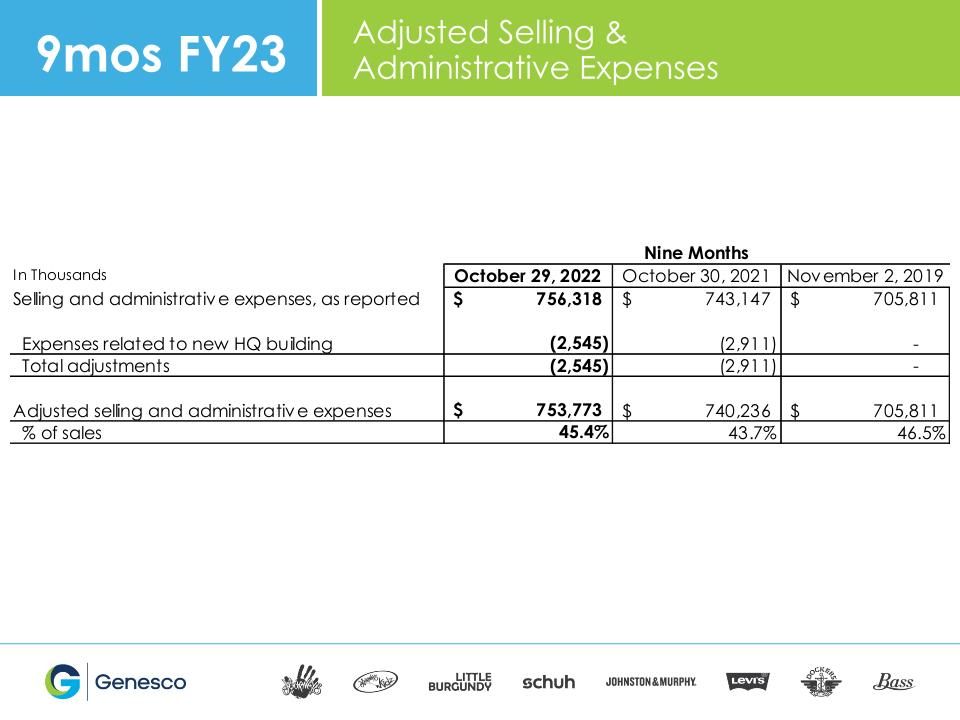
9mos FY23 Adjusted Selling & Administrative Expenses

FY23 Q3 GENESCO Summary Results December 2, 2022