The fund’s investment objective is to provide you with long-term growth of capital.
This table describes the fees and expenses that you may pay if you buy, hold and sell shares of the fund. You may pay other fees, such as brokerage commissions and other fees to financial intermediaries, which are not reflected in the tables and examples below. For example, in addition to the fees and expenses described below, you may also be required to pay brokerage commissions on purchases and sales of Class F-2, F-3, 529-F-2 or 529-F-3 shares of the fund. You may qualify for sales charge discounts if you and your family invest, or agree to invest in the future, at least $25,000 in American Funds. More information about these and other discounts is available from your financial professional, in the “Sales charge reductions and waivers” sections on page 31 of the prospectus and on page 71 of the fund’s statement of additional information, and in the sales charge waiver appendix to the prospectus.
Shareholder Fees - NEW PERSPECTIVE FUND |
Class A |
Class 529-A |
Class C |
Class 529-C |
Class 529-E |
Class T |
Class 529-T |
Class F-1 |
Class F-2 |
Class F-3 |
Class 529-F-1 |
Class 529-F-2 |
Class 529-F-3 |
Class R-1 |
Class R-2 |
Class R-3 |
Class R-4 |
Class R-5 |
Class R-6 |
Class R-2E |
Class R-5E |
||
|---|---|---|---|---|---|---|---|---|---|---|---|---|---|---|---|---|---|---|---|---|---|---|---|
| Maximum sales charge (load) imposed on purchases (as a percentage of offering price) | 5.75% | 3.50% | none | none | none | 2.50% | 2.50% | none | none | none | none | none | none | none | none | none | none | none | none | none | none | ||
| Maximum deferred sales charge (load) (as a percentage of the amount redeemed) | 1.00% | [1] | 1.00% | [1] | 1.00% | 1.00% | none | none | none | none | none | none | none | none | none | none | none | none | none | none | none | none | none |
| Maximum sales charge (load) imposed on reinvested dividends | none | none | none | none | none | none | none | none | none | none | none | none | none | none | none | none | none | none | none | none | none | ||
| Redemption or exchange fees | none | none | none | none | none | none | none | none | none | none | none | none | none | none | none | none | none | none | none | none | none | ||
| [1] | A contingent deferred sales charge of 1.00% applies on certain redemptions made within 18 months following purchases of $1 million or more made without an initial sales charge. Contingent deferred sales charge is calculated based on the lesser of the offering price and market value of shares being sold. |
Annual Fund Operating Expenses - NEW PERSPECTIVE FUND |
Class A |
Class C |
Class T |
Class F-1 |
Class F-2 |
Class F-3 |
Class 529-A |
Class 529-C |
Class 529-E |
Class 529-T |
Class 529-F-1 |
Class 529-F-2 |
Class 529-F-3 |
Class R-1 |
Class R-2 |
Class R-2E |
Class R-3 |
Class R-4 |
Class R-5E |
Class R-5 |
Class R-6 |
|---|---|---|---|---|---|---|---|---|---|---|---|---|---|---|---|---|---|---|---|---|---|
| Management fees | 0.37% | 0.37% | 0.37% | 0.37% | 0.37% | 0.37% | 0.37% | 0.37% | 0.37% | 0.37% | 0.37% | 0.37% | 0.37% | 0.37% | 0.37% | 0.37% | 0.37% | 0.37% | 0.37% | 0.37% | 0.37% |
| Distribution and/or service (12b-1) fees | 0.24% | 1.00% | 0.25% | 0.25% | none | none | 0.23% | 1.00% | 0.50% | 0.25% | 0.25% | none | none | 1.00% | 0.75% | 0.60% | 0.50% | 0.25% | none | none | none |
| Other expenses | 0.11% | 0.10% | 0.11% | 0.16% | 0.15% | 0.04% | 0.16% | 0.16% | 0.13% | 0.16% | 0.23% | 0.14% | 0.10% | 0.13% | 0.39% | 0.24% | 0.19% | 0.14% | 0.20% | 0.09% | 0.04% |
| Total annual fund operating expenses | 0.72% | 1.47% | 0.73% | 0.78% | 0.52% | 0.41% | 0.76% | 1.53% | 1.00% | 0.78% | 0.85% | 0.51% | 0.47% | 1.50% | 1.51% | 1.21% | 1.06% | 0.76% | 0.57% | 0.46% | 0.41% |
This example is intended to help you compare the cost of investing in the fund with the cost of investing in other mutual funds.
The example assumes that you invest $10,000 in the fund for the time periods indicated and then redeem all of your shares at the end of those periods. The example also assumes that your investment has a 5% return each year and that the fund’s operating expenses remain the same. You may be required to pay brokerage commissions on your purchases and sales of Class F-2, F-3, 529-F-2 or 529-F-3 shares of the fund, which are not reflected in the example.
Expense Example - NEW PERSPECTIVE FUND - USD ($) |
Class A |
Class C |
Class T |
Class F-1 |
Class F-2 |
Class F-3 |
Class 529-A |
Class 529-C |
Class 529-E |
Class 529-T |
Class 529-F-1 |
Class 529-F-2 |
Class 529-F-3 |
Class R-1 |
Class R-2 |
Class R-2E |
Class R-3 |
Class R-4 |
Class R-5E |
Class R-5 |
Class R-6 |
|---|---|---|---|---|---|---|---|---|---|---|---|---|---|---|---|---|---|---|---|---|---|
| 1 year | $ 644 | $ 250 | $ 323 | $ 80 | $ 53 | $ 42 | $ 425 | $ 256 | $ 102 | $ 328 | $ 87 | $ 52 | $ 48 | $ 153 | $ 154 | $ 123 | $ 108 | $ 78 | $ 58 | $ 47 | $ 42 |
| 3 years | 792 | 465 | 478 | 249 | 167 | 132 | 584 | 483 | 318 | 493 | 271 | 164 | 151 | 474 | 477 | 384 | 337 | 243 | 183 | 148 | 132 |
| 5 years | 953 | 803 | 646 | 433 | 291 | 230 | 758 | 834 | 552 | 672 | 471 | 285 | 263 | 818 | 824 | 665 | 585 | 422 | 318 | 258 | 230 |
| 10 years | $ 1,418 | $ 1,554 | $ 1,134 | $ 966 | $ 653 | $ 518 | $ 1,259 | $ 1,335 | $ 1,225 | $ 1,192 | $ 1,049 | $ 640 | $ 591 | $ 1,791 | $ 1,802 | $ 1,466 | $ 1,294 | $ 942 | $ 714 | $ 579 | $ 518 |
Expense Example No Redemption - NEW PERSPECTIVE FUND - USD ($) |
Class C |
Class 529-C |
|---|---|---|
| 1 year | $ 150 | $ 156 |
| 3 years | 465 | 483 |
| 5 years | 803 | 834 |
| 10 years | $ 1,554 | $ 1,335 |
The fund pays transaction costs, such as commissions, when it buys and sells securities (or “turns over” its portfolio). A higher portfolio turnover rate may indicate higher transaction costs and may result in higher taxes when fund shares are held in a taxable account. These costs, which are not reflected in annual fund operating expenses or in the example, affect the fund’s investment results. During the most recent fiscal year, the fund’s portfolio turnover rate was 21% of the average value of its portfolio.
The fund seeks to take advantage of investment opportunities generated by changes in international trade patterns and economic and political relationships by investing in common stocks of companies located around the world.
In pursuing its investment objective, the fund invests primarily in common stocks that the investment adviser believes have the potential for growth.
The investment adviser uses a system of multiple portfolio managers in managing the fund’s assets. Under this approach, the portfolio of the fund is divided into segments managed by individual managers.
The fund relies on the professional judgment of its investment adviser to make decisions about the fund’s portfolio investments. The basic investment philosophy of the investment adviser is to seek to invest in attractively valued companies that, in its opinion, represent good, long-term investment opportunities. Securities may be sold when the investment adviser believes that they no longer represent relatively attractive investment opportunities.
This section describes the principal risks associated with investing in the fund. You may lose money by investing in the fund. The likelihood of loss may be greater if you invest for a shorter period of time. Investors in the fund should have a long-term perspective and be able to tolerate potentially sharp declines in value.
Market conditions — The prices of, and the income generated by, the securities held by the fund may decline – sometimes rapidly or unpredictably – due to various factors, including events or conditions affecting the general economy or particular industries or companies; overall market changes; local, regional or global political, social or economic instability; governmental, governmental agency or central bank responses to economic conditions; and currency exchange rate, interest rate and commodity price fluctuations.
Economies and financial markets throughout the world are highly interconnected. Economic, financial or political events, trading and tariff arrangements, wars, terrorism, cybersecurity events, natural disasters, public health emergencies (such as the spread of infectious disease) and other circumstances in one country or region, including actions taken by governmental or quasi-governmental authorities in response to any of the foregoing, could have impacts on global economies or markets. As a result, whether or not the fund invests in securities of issuers located in or with significant exposure to the countries affected, the value and liquidity of the fund’s investments may be negatively affected by developments in other countries and regions.
Issuer risks — The prices of, and the income generated by, securities held by the fund may decline in response to various factors directly related to the issuers of such securities, including reduced demand for an issuer’s goods or services, poor management performance, major litigation, investigations or other controversies related to the issuer, changes in financial condition or credit rating, changes in government regulations affecting the issuer or its competitive environment and strategic initiatives such as mergers, acquisitions or dispositions and the market response to any such initiatives.
Investing in growth-oriented stocks — Growth-oriented common stocks and other equity-type securities (such as preferred stocks, convertible preferred stocks and convertible bonds) may involve larger price swings and greater potential for loss than other types of investments.
Investing outside the United States — Securities of issuers domiciled outside the United States, or with significant operations or revenues outside the United States, may lose value because of adverse political, social, economic or market developments (including social instability, regional conflicts, terrorism and war) in the countries or regions in which the issuers operate or generate revenue. These securities may also lose value due to changes in foreign currency exchange rates against the U.S. dollar and/or currencies of other countries. Issuers of these securities may be more susceptible to actions of foreign governments, such as nationalization, currency blockage or the imposition of price controls, sanctions, or punitive taxes, each of which could adversely impact the value of these securities. Securities markets in certain countries may be more volatile and/or less liquid than those in the United States. Investments outside the United States may also be subject to different regulatory, legal, accounting, auditing, financial reporting and recordkeeping requirements, and may be more difficult to value, than those in the United States. In addition, the value of investments outside the United States may be reduced by foreign taxes, including foreign withholding taxes on interest and
dividends. Further, there may be increased risks of delayed settlement of securities purchased or sold by the fund, which could impact the liquidity of the fund’s portfolio. The risks of investing outside the United States may be heightened in connection with investments in emerging markets.
Management — The investment adviser to the fund actively manages the fund’s investments. Consequently, the fund is subject to the risk that the methods and analyses, including models, tools and data, employed by the investment adviser in this process may be flawed or incorrect and may not produce the desired results. This could cause the fund to lose value or its investment results to lag relevant benchmarks or other funds with similar objectives.
Your investment in the fund is not a bank deposit and is not insured or guaranteed by the Federal Deposit Insurance Corporation or any other governmental agency, entity or person. You should consider how this fund fits into your overall investment program.
The following bar chart shows how the fund’s investment results have varied from year to year, and the following table shows how the fund’s average annual total returns for various periods compare with a broad measure of securities market results. This information provides some indication of the risks of investing in the fund. Past investment results (before and after taxes) are not predictive of future investment results. Prior to October 30, 2020, certain fees, such as 12b-1 fees, were not charged on Class 529-F-1 shares. If these expenses had been deducted, results would have been lower. Updated information on the fund’s investment results can be obtained by visiting capitalgroup.com.
The following bar chart shows how the fund’s investment results have varied from year to year, and the following table shows how the fund’s average annual total returns for various periods compare with a broad measure of securities market results.
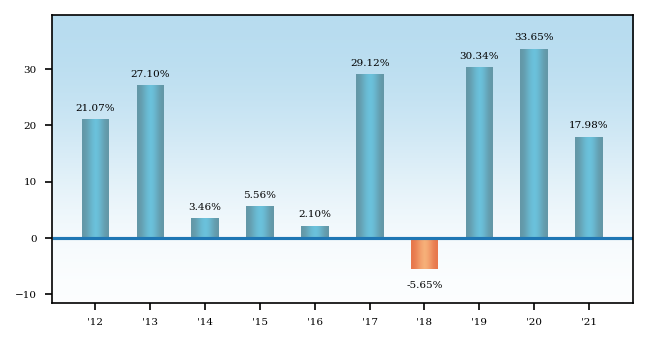
Highest/Lowest quarterly results during this period were:
Highest 23.86% (quarter ended June 30, 2020)
Lowest -18.23% (quarter ended March 31, 2020)
The fund's total return for the nine months ended September 30, 2022, was -31.49%.
Average Annual Returns - NEW PERSPECTIVE FUND |
Average Annual Returns, 1 Year |
Average Annual Returns, 5 Years |
Average Annual Returns, 10 Years |
Average Annual Returns, Since Inception |
Average Annual Returns, Inception Date |
|---|---|---|---|---|---|
| Class F-2 | 17.98% | 20.15% | 15.69% | 11.70% | Aug. 01, 2008 |
| Class A | 10.96% | 18.49% | 14.76% | 12.64% | Mar. 13, 1973 |
| Class C | 15.84% | 18.98% | 14.71% | 9.76% | Mar. 15, 2001 |
| Class F-1 | 17.66% | 19.82% | 15.38% | 10.06% | Mar. 15, 2001 |
| Class F-3 | 18.10% | 19.38% | Jan. 27, 2017 | ||
| Class 529-A | 13.58% | 18.98% | 14.95% | 10.64% | Feb. 15, 2002 |
| Class 529-C | 15.80% | 18.93% | 14.91% | 10.60% | Feb. 15, 2002 |
| Class 529-E | 17.42% | 19.56% | 15.09% | 10.44% | Mar. 01, 2002 |
| Class 529-F-1 | 17.89% | 20.09% | 15.61% | 12.39% | Sep. 17, 2002 |
| Class 529-F-2 | 17.95% | 35.19% | Oct. 30, 2020 | ||
| Class 529-F-3 | 18.04% | 35.28% | Oct. 30, 2020 | ||
| Class R-1 | 16.84% | 18.97% | 14.54% | 10.31% | Jun. 17, 2002 |
| Class R-2 | 16.82% | 18.97% | 14.55% | 9.95% | May 21, 2002 |
| Class R-2E | 17.16% | 19.32% | 13.68% | Aug. 29, 2014 | |
| Class R-3 | 17.34% | 19.50% | 15.06% | 10.63% | Jun. 04, 2002 |
| Class R-4 | 17.70% | 19.86% | 15.41% | 10.82% | May 28, 2002 |
| Class R-5E | 17.94% | 20.11% | 16.11% | Nov. 20, 2015 | |
| Class R-5 | 18.06% | 20.22% | 15.76% | 11.12% | May 15, 2002 |
| Class R-6 | 18.09% | 20.28% | 15.81% | 15.40% | May 01, 2009 |
| After Taxes on Distributions | Class F-2 | 16.02% | 18.56% | 14.35% | ||
| After Taxes on Distributions and Sale of Fund Shares | Class F-2 | 11.96% | 16.07% | 12.86% | ||
| MSCI® All Country World Index (reflects no deductions for sales charges, account fees, expenses or U.S. federal income taxes) | 18.54% | 14.40% | 11.85% | 8.24% | Aug. 01, 2008 |
After-tax returns are shown only for Class F-2 shares; after-tax returns for other share classes will vary. After-tax returns are calculated using the highest individual federal income tax rates in effect during each year of the periods shown and do not reflect the impact of state and local taxes. Your actual after-tax returns depend on your individual tax situation and likely will differ from the results shown above. In addition, after-tax returns are not relevant if you hold your fund shares through a tax-favored arrangement, such as a 401(k) plan, individual retirement account (IRA) or 529 college savings plan.