Exhibit 99.1


LOGO    FOURTH QUARTER 2022


EARNINGS RELEASE


 ROYAL BANK OF CANADA REPORTS FOURTH QUARTER AND 2022 RESULTS


All amounts are in Canadian dollars and are based on our audited Annual and unaudited Interim Consolidated Financial Statements for the year and quarter ended October 31, 2022 and related notes prepared in accordance with International Financial Reporting Standards (IFRS) as issued by the International Accounting Standards Board, unless otherwise noted. Our 2022 Annual Report (which includes our audited Annual Consolidated Financial Statements and accompanying Management’s Discussion & Analysis), our 2022 Annual Information Form and our Supplementary Financial Information are available on our website at: http://www.rbc.com/investorrelations.


LOGO

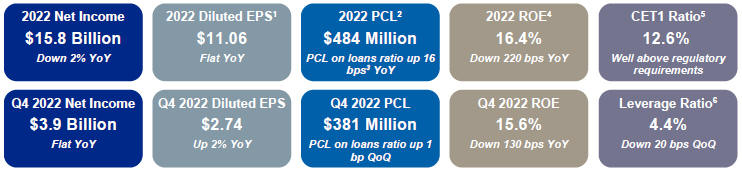
TORONTO, November 30, 2022 – Royal Bank of Canada7 (RY on TSX and NYSE) today reported net income of $15.8 billion for the year ended October 31, 2022, down $243 million or 2% from the prior year. Diluted EPS of $11.06 remained unchanged from the prior year. Our consolidated results include total PCL of $484 million compared to $(753) million last year, primarily reflecting lower releases of provisions on performing loans in Personal & Commercial Banking and Capital Markets due to unfavourable changes in our macroeconomic outlook in the current year. Lower earnings in Capital Markets and Insurance were partly offset by higher results in Personal & Commercial Banking, Wealth Management and Investor & Treasury Services.

Pre-provision, pre-tax earnings8 of $20.6 billion were up 4% from a year ago, mainly reflecting higher net interest income driven by strong volume growth and higher spreads in Canadian Banking and Wealth Management. These factors were partially offset by lower revenue in Capital Markets, including the impact from loan underwriting markdowns in Q3 2022, largely driven by challenging market conditions. Results also reflected higher salaries, technology investments and discretionary costs to support strong client-driven growth.

The PCL on loans ratio of 6 bps increased 16 bps from the prior year. The PCL on impaired loans ratio was 10 bps, flat from the prior year.

Our capital position remained robust, with a Common Equity Tier 1 (CET1) ratio of 12.6% supporting strong client-driven organic growth. In addition, this year we returned $12.4 billion to our shareholders through common share buybacks and dividends. And today, we declared a quarterly dividend of $1.32 per share reflecting an increase of $0.04 or 3%.


“While market conditions continue to be tough, our 2022 results reflect a resilient bank that is well-positioned to pursue strategic growth and deliver long-term shareholder value. Our premium businesses, strong balance sheet, prudent risk management and diversified business model mean we can deliver advice and services that help our clients navigate all cycles. RBC colleagues remain focused on building more exceptional experiences for our clients and supporting sustainable and prosperous communities.”

– Dave McKay, RBC President and Chief Executive Officer


2022 Full-Year Business Segment Performance

7% earnings growth in Personal & Commercial Banking, primarily attributable to higher net interest income, driven by average volume growth of 9% in both loans and deposits in Canadian Banking, and higher spreads. As a result of the rising interest rate environment (Bank of Canada raised the benchmark interest rate by 350 bps from March to October 2022), we saw higher spreads as compared to the prior year. Higher non-interest income, including higher foreign exchange revenue, card service revenue and service charges driven by increased client activity also contributed to the increase in earnings. These factors were partially offset by higher PCL, and higher staff and technology related costs. Our Canadian Banking franchise generated strong positive operating leverage of 3.8% while continuing to invest in digital initiatives to improve the client experience and deliver personalized advice.


20% earnings growth in Wealth Management, mainly due to higher net interest income driven by average volume growth of 19% in loans and 11% in deposits largely in U.S. Wealth Management (including City National), and higher interest rates. Higher average fee-based client assets primarily reflecting net sales, as well as the impact of a legal provision taken in U.S. Wealth Management (including City National) in the prior year that was partially released in the first quarter of 2022, also contributed to the increase. These factors were partially offset by higher staff-related costs and variable compensation.


1

Earnings per share (EPS).

2

Provision for credit losses (PCL).

3

Basis points (bps).

4

Return on equity (ROE). For further information, refer to the Key performance and non-GAAP measures section on page 11 of this Earnings Release.

5

This ratio is calculated by dividing Common Equity Tier 1 (CET1) by risk-weighted assets, in accordance with OSFI’s Basel III Capital Adequacy Requirements guideline.

6

Leverage ratio is calculated using OSFI’s Leverage Requirements guideline.

7

When we say “we”, “us”, “our”, or “RBC”, we mean Royal Bank of Canada and its subsidiaries, as applicable.

8

Pre-provision, pre-tax earnings is calculated as income (2022: $15,807 million; 2021: $16,050 million) before income taxes (2022: $4,302 million; 2021: $4,581 million) and PCL (2022: $484 million; 2021: $(753) million). This is a non-GAAP measure. For further information, refer to the Key performance and non-GAAP measures section on page 11 of this Earnings Release.


- 1 -


4% lower earnings in Insurance, largely due to the impact of lower new longevity reinsurance contracts, partially offset by higher favourable investment-related experience.


17% earnings growth in Investor & Treasury Services, mainly due to higher revenue from client deposits reflecting improved margins, partially offset by higher technology-related costs.


30% lower earnings in Capital Markets, primarily driven by lower revenue in Corporate & Investment Banking, larger releases of provisions on performing assets in the prior year and lower revenue in Global Markets. Global investment banking fee pools were impacted by weakness in credit and equity markets beginning in the second fiscal quarter of 2022, resulting in an approximately 30% decline in global investment banking fee pools9 this fiscal year compared to record levels in fiscal 2021.

Q4 2022 Performance

Earnings of $3.9 billion remained relatively flat from a year ago, with diluted EPS growth of 2% over the same period. Our consolidated results reflect $381 million of provisions, primarily taken on loans in the current quarter, as compared to $(227) million in the prior year, due to releases of provisions on performing loans, primarily in Personal & Commercial Banking. Higher earnings in Wealth Management and Personal & Commercial Banking reflected higher interest rates and robust client-driven volume growth. Earnings in Insurance and Investor & Treasury Services were largely unchanged. These were offset by lower earnings in Capital Markets.

Pre-provision, pre-tax earnings10 of $5.2 billion were up 10% from a year ago, mainly reflecting higher net interest income driven by higher spreads and strong volume growth in Canadian Banking and Wealth Management. This was partially offset by lower market-related revenue in Capital Markets and Wealth Management. Results were also impacted by higher staff-related costs, including higher salaries and variable compensation.

Earnings were up $305 million or 9% from last quarter due to higher earnings in Capital Markets, Personal & Commercial Banking, Insurance, and Wealth Management. These were partially offset lower earnings in Investor & Treasury Services. The PCL on loans ratio of 18 bps was up 1 bp from 17 bps last quarter. The PCL on impaired loans ratio of 12 bps was up 4 bps from last quarter.


  Q4 2022

  compared to        

  Q4 2021


•    Net income of $3,882 million


è 0%


•    Diluted EPS of $2.74

   é 2%
   

•    ROE of 15.6%

   ê 130 bps
   

•    CET1 ratio of 12.6%


ê 110 bps


  Q4 2022

  compared to        

  Q3 2022


•    Net income of $3,882 million


é 9%


•    Diluted EPS of $2.74

   é 9%
   

•    ROE of 15.6%

   é100 bps
   

•    CET1 ratio of 12.6%


ê 50 bps


Q4 2022 Business Segment Performance


  Personal & Commercial Banking

Net income of $2,139 million increased $106 million or 5% from a year ago, primarily attributable to higher net interest income reflecting higher spreads from higher interest rates and strong average volume growth of 10% in loans (including strong mortgage and business loan growth of 10% and 15%, respectively) and 9% in deposits in Canadian Banking. Higher non-interest income, including higher card service and foreign exchange revenue from increased client activity, also contributed to the increase. These factors were partially offset by higher PCL, higher staff and technology related costs, including digital initiatives, as well as higher marketing costs.

Compared to last quarter, net income increased $116 million or 6%, primarily due to higher net interest income reflecting higher spreads and volume growth. Lower PCL also contributed to the increase. These factors were partially offset by higher staff-related and marketing costs, as well as the timing of professional fees.


  Wealth Management

Net income of $822 million increased $264 million or 47% from a year ago, primarily due to higher net interest income reflecting higher interest rates and average volume growth in loans and deposits, and the impact of a legal provision taken in U.S. Wealth Management (including City National) in the prior year. These factors were partially offset by lower fee-based revenues mainly driven by unfavourable market conditions.

Compared to last quarter, net income increased $45 million or 6%, mainly due to higher net interest income largely reflecting higher interest rates. This factor was partially offset by lower average fee-based client assets, largely driven by unfavourable market conditions.


9 

Dealogic, based on global investment bank fees, Fiscal 2022.

10 

Pre-provision, pre-tax earnings is calculated as income (Q4 2022: $3,882 million; Q4 2021: $3,892 million) before income taxes (Q4 2022: $979 million; Q4 2021: $1,096 million) and PCL (Q4 2022: $381 million; Q4 2021: $(227) million). This is a Non-GAAP measure. For further information, refer to the Key Performance and Non-GAAP measures section on page 11 of this Earnings Release.


- 2 -


  Insurance

Net income of $268 million remained relatively flat, largely reflecting the impact of offsetting items between revenue and PBCAE (policyholder benefits, claims and acquisition expense). PBCAE also included the impact of favourable annual actuarial assumption updates.

Compared to last quarter, net income increased $82 million or 44%, mainly due to favourable annual actuarial assumption updates.


  Investor & Treasury Services

Net income of $110 million remained relatively flat as the impact of higher revenue reflecting improved margins mainly driven by higher interest rates from client deposits, was largely offset by lower funding and liquidity revenue and lower revenue from our asset services business.

Compared to last quarter, net income decreased $54 million or 33%, mainly driven by lower funding and liquidity revenue, including the impact of a funding cost adjustment.


  Capital Markets

Net income of $617 million decreased $303 million or 33% from a year ago, primarily due to the timing of true-ups related to our variable compensation plans. Lower revenue in Corporate & Investment Banking reflecting lower debt and equity origination as well as lower loan syndication revenue and higher PCL, also contributed to the decrease. These factors were partially offset by a lower effective tax rate reflecting changes in the earnings mix as well as higher fixed income trading revenue in Global Markets.

Compared to last quarter, net income increased $138 million or 29%, mainly due to higher fixed income trading revenue as the prior quarter included the impact from loan underwriting markdowns, primarily in the U.S., largely driven by challenging market conditions. This factor was partially offset by higher compensation on increased results and the timing of true-ups related to our variable compensation plans.


  Capital, Liquidity and Credit Quality

Capital – As at October 31, 2022, our CET1 ratio was 12.6%, down 110 bps from last year, mainly reflecting risk-weighted asset growth (excluding FX), share repurchases, the impact of our Brewin Dolphin acquisition, and the unfavourable impact of fair value other comprehensive income adjustments. These factors were partially offset by net internal capital generation, favourable net credit migration and model updates.

Liquidity – For the quarter ended October 31, 2022, the average liquidity coverage ratio (LCR) was 125%, which translates into a surplus of approximately $73 billion, compared to 123% and a surplus of approximately $66 billion in the prior quarter. LCR has increased compared to last quarter as loan growth was more than offset by an increase in volume and change in mix of client deposits, as well as by issuances of term funding.

The Net Stable Funding Ratio (NSFR) as at October 31, 2022 was 112%, which translates into a surplus of approximately $95 billion, compared to 113% and a surplus of approximately $100 billion in the prior quarter. NSFR remained relatively flat compared to last quarter as growth in loans and securities was offset by issuance of term funding and increases in client deposits.

Credit Quality

Q4 2022 vs. Q4 2021

Total PCL was $381 million compared to $(227) million last year, reflecting provisions taken on performing loans and higher provisions on impaired loans in the current quarter, as compared to releases of provisions on performing loans in the prior year, primarily in Personal & Commercial Banking. The PCL on loans ratio of 18 bps compared to (12) bps last year increased 30 bps.

PCL on performing loans was $126 million compared to $(355) million last year, primarily attributable to releases of provisions in the prior year driven by improvements in our macroeconomic and credit quality outlook, as compared to provisions taken in the current quarter in our Canadian Banking portfolios mainly reflecting unfavourable changes in our macroeconomic and credit quality outlook.

PCL on impaired loans increased $117 million, primarily due to higher provisions in Personal & Commercial Banking, largely in our Canadian Banking portfolios.

Q4 2022 vs. Q3 2022

Total PCL was $381 million and increased $41 million or 12% from last quarter, largely due to higher provisions on loans in Wealth Management and Capital Markets, partially offset by lower provisions on loans in Personal & Commercial Banking. The PCL on loans ratio increased 1 bp.

PCL on performing loans decreased $51 million or 29%, primarily due to lower provisions in Personal & Commercial Banking, largely in our Caribbean Banking portfolios, mainly reflecting the recovery from the COVID-19 pandemic and model updates. This was partially offset by higher provisions in U.S. Wealth Management (including City National), mainly reflecting unfavourable changes in our credit outlook.


- 3 -


PCL on impaired loans increased $84 million or 49%, largely due to higher provisions in Personal & Commercial Banking in our Canadian Banking portfolios, partially offset by lower provisions in our Caribbean Banking portfolios. Provisions taken in Capital Markets in the current quarter, mainly in the other services sector, as compared to recoveries last quarter, also contributed to the increase.


- 4 -


  Selected financial and other highlights


     As at or for the three months ended             For the year ended  
(Millions of Canadian dollars, except per share, number of and percentage amounts)   

October 31 

2022   


July 31

2022


October 31

2021


October 31

2022


October 31

2021


Total revenue

   $ 12,567     $ 12,132     $ 12,376        $ 48,985     $ 49,693  

Provision for credit losses (PCL)

     381       340       (227        484       (753

Insurance policyholder benefits, claims and acquisition expense (PBCAE)

     116       850       1,032          1,783       3,891  

Non-interest expense

     7,209       6,386       6,583          26,609       25,924  

Income before income taxes

     4,861       4,556       4,988          20,109       20,631  

Net income

   $ 3,882     $ 3,577     $ 3,892              $ 15,807     $ 16,050  

Segments - net income


Personal & Commercial Banking

   $ 2,139     $ 2,023     $ 2,033        $ 8,370     $ 7,847  

Wealth Management

     822       777       558          3,144       2,626  

Insurance

     268       186       267          857       889  

Investor & Treasury Services

     110       164       109          513       440  

Capital Markets

     617       479       920          2,921       4,187  

Corporate Support

     (74     (52     5          2       61  

Net income

   $ 3,882     $ 3,577     $ 3,892              $ 15,807     $ 16,050  

Selected information


Earnings per share (EPS) - basic

   $ 2.75     $ 2.52     $ 2.68        $ 11.08     $ 11.08  

- diluted

     2.74       2.51       2.68          11.06       11.06  

Return on common equity (ROE) (1)

     15.6 %     14.6 %     16.9 %        16.4 %     18.6 %

Average common equity (1)

   $ 97,150     $ 95,750     $ 89,500        $ 94,700     $ 84,850  

Net interest margin (NIM) - on average earning assets, net (2)

     1.56 %     1.52 %     1.43 %        1.48 %     1.48 %

PCL on loans as a % of average net loans and acceptances

     0.18 %     0.17 %     (0.12 )%         0.06 %     (0.10 )% 

PCL on performing loans as a % of average net loans and acceptances

     0.06 %     0.09 %     (0.19 )%         (0.04 )%      (0.20 )% 

PCL on impaired loans as a % of average net loans and acceptances

     0.12 %     0.08 %     0.07 %        0.10 %     0.10 %

Gross impaired loans (GIL) as a % of loans and acceptances

     0.26 %     0.25 %     0.31 %        0.26 %     0.31 %

Liquidity coverage ratio (LCR) (3)

     125 %     123 %     123 %        125 %     123 %

Net stable funding ratio (NSFR) (3)

     112 %     113 %     116 %        112 %     116 %

Capital ratios and Leverage ratio (4)


Common Equity Tier 1 (CET1) ratio

     12.6 %     13.1 %     13.7 %        12.6 %     13.7 %

Tier 1 capital ratio

     13.8 %     14.3 %     14.9 %        13.8 %     14.9 %

Total capital ratio

     15.4 %     15.9 %     16.7 %        15.4 %     16.7 %

Leverage ratio

     4.4 %     4.6 %     4.9 %        4.4 %     4.9 %

TLAC ratio (5)

     26.4 %     27.6 %     n.a.        26.4 %     n.a.

TLAC leverage ratio (5)

     8.5 %     8.8 %     n.a.        8.5 %     n.a.

Selected balance sheet and other information (6)


Total assets

   $ 1,917,219     $ 1,842,092     $ 1,706,323        $ 1,917,219     $ 1,706,323  

Securities, net of applicable allowance

     318,223       298,795       284,724          318,223       284,724  

Loans, net of allowance for loan losses

     819,965       796,314       717,575          819,965       717,575  

Derivative related assets

     154,439       122,058       95,541          154,439       95,541  

Deposits

     1,208,814       1,178,604       1,100,831          1,208,814       1,100,831  

Common equity

     100,746       96,570       91,983          100,746       91,983  

Total risk-weighted assets

     609,879       589,050       552,541          609,879       552,541  

Assets under management (AUM) (2)

     999,700       937,700       1,008,700          999,700       1,008,700  

Assets under administration (AUA) (2), (7)

     5,649,700       5,748,900       6,347,300          5,649,700       6,347,300  

Common share information


Shares outstanding (000s)         - average basic

     1,386,925       1,396,381       1,424,534          1,403,654       1,424,343  

            - average diluted

     1,388,548       1,398,667       1,427,225          1,406,034       1,426,735  

            - end of period

     1,382,911       1,390,629       1,424,525          1,382,911       1,424,525  

Dividends declared per common share

   $ 1.28     $ 1.28     $ 1.08        $ 4.96     $ 4.32  

Dividend yield (2)

     4.0 %     3.9 %     3.3 %        3.7 %     3.8 %

Dividend payout ratio (2)

     47 %     51 %     40 %        45 %     39 %

Common share price (RY on TSX) (8)

   $ 126.05   $ 124.86   $ 128.82      $ 126.05   $ 128.82

Market capitalization (TSX) (8)

     174,316       173,634       183,507          174,316       183,507  

Business information (number of)


Employees (full-time equivalent) (FTE)

     91,427       88,541       85,301          91,427       85,301  

Bank branches

     1,271       1,283       1,295          1,271       1,295  

Automated teller machines (ATMs)

     4,368       4,364       4,378          4,368       4,378  

Period average US$ equivalent of C$1.00 (9)

   $ 0.739     $ 0.783     $ 0.796              $ 0.774     $ 0.796  

Period-end US$ equivalent of C$1.00

   $ 0.734     $ 0.781     $ 0.808              $ 0.734     $ 0.808  


(1)

Average amounts are calculated using methods intended to approximate the average of the daily balances for the period. This includes average common equity used in the calculation of ROE. For further details, refer to the Key performance and non-GAAP measures section of this Earnings Release.

(2)

See the Glossary section of our 2022 Annual Report for composition of this measure.

(3)

The LCR and NSFR are calculated in accordance with the Office of the Superintendent of Financial Institutions’ (OSFI) Liquidity Adequacy Requirements (LAR) guideline. LCR is the average for the three months ended for each respective period. For further details, refer to the Liquidity and funding risk section. For further details, refer to the Liquidity and funding risk section of our 2022 Annual Report.

(4)

Capital ratios are calculated using OSFI’s Capital Adequacy Requirements (CAR) guideline and the Leverage ratio is calculated using OSFI’s Leverage Requirements (LR) guideline.

(5)

Effective Q1 2022, OSFI requires Canadian Domestic Systemically Important Banks (D-SIBs) to meet minimum risk-based TLAC ratio and TLAC leverage ratio requirements which are calculated using OSFI’s TLAC guideline. For further details, refer to the Capital management section.

(6)

Represents period-end spot balances.

(7)

AUA includes $15 billion and $6 billion (July 31, 2022 – $14 billion and $5 billion, October 31, 2021 – $15 billion and $3 billion) of securitized residential mortgages and credit card loans, respectively.

(8)

Based on TSX closing market price at period-end.

(9)

Average amounts are calculated using month-end spot rates for the period.

n.a.

not applicable


- 5 -


  Personal & Commercial Banking


     As at or for the three months ended  
     October 31     July 31     October 31  
(Millions of Canadian dollars, except percentage amounts and as otherwise noted)    2022     2022     2021  

Net interest income

   $ 3,901     $ 3,655     $ 3,169  

Non-interest income

     1,518       1,527       1,436  

Total revenue

     5,419       5,182       4,605  

PCL on performing assets

     56       141       (342

PCL on impaired assets

     230       183       134  

PCL

     286       324       (208

Non-interest expense

     2,270       2,130       2,087  

Income before income taxes

     2,863       2,728       2,726  

Net income

   $ 2,139     $ 2,023     $ 2,033  

Revenue by business


Canadian Banking

   $ 5,179     $ 4,974     $ 4,414  

Caribbean & U.S. Banking

     240       208       191  

Selected balances and other information


ROE

     30.5 %     29.2 %     32.5 %

NIM

     2.72 %     2.61 %     2.42 %

Efficiency ratio (1)

     41.9 %     41.1 %     45.3 %

Operating leverage (2)

     8.9 %     4.8 %     2.5 %

Average total assets

   $         597,600     $         582,700     $         543,900  

Average total earning assets, net

     569,000       555,400       518,900  

Average loans and acceptances, net

     574,300       560,300       522,200  

Average deposits

     570,200       555,300       524,300  

AUA (3), (4)

     336,400       346,500       367,700  

Average AUA

     338,300       343,500       363,500  

AUM (4)

     5,600       5,400       5,400  

PCL on impaired loans as a % of average net loans and acceptances

     0.16 %     0.13 %     0.10 %

Other selected information - Canadian Banking


Net income

   $ 1,999     $ 1,971     $ 1,970  

NIM

     2.70 %     2.60 %     2.42 %

Efficiency ratio

     40.3 %     39.7 %     43.8 %

Operating leverage

     9.2 %     4.5 %     2.7 %


(1)

Calculated as non-interest expense divided by total revenue.

(2)

Defined as the difference between our revenue growth rate and non-interest expense growth rate.

(3)

AUA includes securitized residential mortgages and credit card loans as at October 31, 2022 of $15 billion and $6 billion, respectively (July 31, 2022 – $14 billion and $5 billion, October 31, 2021 – $15 billion and $3 billion).

(4)

Represents period-end spot balances.

Q4 2022 vs. Q4 2021

Net income increased $106 million or 5% from a year ago, primarily attributable to higher net interest income reflecting higher spreads and average volume growth of 9% in Canadian Banking. Higher non-interest income also contributed to the increase. These factors were partially offset by higher PCL, higher staff and technology related costs, including digital initiatives, as well as higher marketing costs.

Total revenue increased $814 million or 18%.

Canadian Banking revenue increased $765 million or 17%, primarily due to higher net interest income reflecting higher spreads and average volume growth in Canadian Banking of 10% in loans and 9% in deposits. Increased client activity contributed to higher card service and foreign exchange revenue. These factors were partially offset by lower average mutual fund balances driving lower distribution fees.

Caribbean & U.S. Banking revenue increased $49 million or 26%, mainly due to higher net interest income reflecting higher spreads and the impact of foreign exchange translation.

Net interest margin was up 30 bps, mainly due to the impact of the rising interest rate environment.

PCL was $286 million compared to $(208) million last year, primarily attributable to releases of provisions on performing loans in the prior year reflecting the recovery from the COVID-19 pandemic as compared to provisions taken in the current quarter in our Canadian Banking portfolios, mainly reflecting unfavourable changes in our macroeconomic and credit quality outlook. Higher provisions on impaired loans, primarily in our Canadian Banking portfolios, also contributed to the increase, resulting in a 6 bps increase in the PCL on impaired loans ratio.

Non-interest expense increased $183 million or 9%, mainly attributable to higher staff and technology related costs, including digital initiatives, higher marketing costs, as well as professional fees.

Q4 2022 vs. Q3 2022

Net income increased $116 million or 6% from last quarter, primarily due to higher net interest income reflecting higher spreads. Lower PCL also contributed to the increase. These factors were partially offset by higher staff-related and marketing costs, as well as the timing of professional fees.

Net interest margin was up 11 bps, mainly due to the impact of the rising interest rate environment.


- 6 -


  Wealth Management


As at or for the three months ended

 
     October 31     July 31     October 31  
(Millions of Canadian dollars, except number of and percentage amounts and as otherwise noted)    2022     2022     2021  

Net interest income

   $ 1,149     $ 960     $ 675  

Non-interest income

     2,827       2,695       2,769  

Total revenue

     3,976       3,655       3,444  

PCL on performing assets

     52       12       (7

PCL on impaired assets

     11       1       12  

PCL

     63       13       5  

Non-interest expense

     2,858       2,618       2,718  

Income before income taxes

     1,055       1,024       721  

Net income

   $ 822     $ 777     $ 558  

Revenue by business


Canadian Wealth Management

   $ 1,095     $ 1,070     $ 1,032  

U.S. Wealth Management (including City National)

     2,068       1,878       1,628  

U.S. Wealth Management (including City National) (US$ millions)

     1,529       1,470       1,296  

Global Asset Management

     644       609       711  

International Wealth Management

     169       98       73  

Selected balances and other information


ROE

     15.6 %     16.0 %     13.1 %

NIM

     3.08 %     2.75 %     2.06 %

Pre-tax margin (1)

     26.5 %     28.0 %     20.9 %

Selected average balance sheet information


Average total assets

   $             165,100     $ 154,700     $ 146,600  

Average total earning assets, net

     148,000       138,700       130,000  

Average loans and acceptances, net

     109,200       101,100       87,000  

Average deposits

     157,900       156,800                  151,500  

Other information


AUA - total (2), (3)

     1,387,900                  1,295,100       1,322,300  

- U.S. Wealth Management (including City National) (2)

     700,100       683,400       704,200  

- U.S. Wealth Management (including City National) (US$ millions) (2)

     513,700       533,600       568,800  

AUM (2)

     991,500       929,600       1,000,600  

Average AUA

     1,316,500       1,278,700       1,314,100  

Average AUM

     942,000       922,000       997,400  

PCL on impaired loans as a % of average net loans and acceptances

     0.04 %     0.01 %     0.05 %

Number of advisors (3)

     6,158       5,622       5,548  


     For the three months ended  

Estimated impact of U.S. dollar, British pound and Euro translation on key income statement items

(Millions of Canadian dollars, except percentage amounts)

   Q4 2022 vs
Q4 2021
    Q4 2022 vs
Q3 2022
 

Increase (decrease):


Total revenue

   $ 121     $ 112  

Non-interest expense

     99       90  

Net income

     12       14  

Percentage change in average US$ equivalent of C$1.00

     (7 )%      (6 )% 

Percentage change in average British pound equivalent of C$1.00

     11     2

Percentage change in average Euro equivalent of C$1.00

     9     0


(1)

Pre-tax margin is defined as Income before income taxes divided by Total revenue.

(2)

Represents period-end spot balances.

(3)

Represents client-facing advisors across all our Wealth Management businesses.

Q4 2022 vs. Q4 2021

Net income increased $264 million or 47% from a year ago, primarily due to higher net interest income reflecting higher interest rates.

Total revenue increased $532 million or 15%, primarily due to higher net interest income reflecting higher interest rates and average volume growth of 26% in loans and 4% in deposits. The impact of foreign exchange translation and higher revenue from sweep deposits also contributed to the increase. These factors were partially offset by lower average fee-based client assets, largely driven by unfavourable market conditions.

PCL increased $58 million, largely reflecting higher provisions on performing loans in U.S. Wealth Management (including City National), mainly driven by unfavourable changes in our macroeconomic outlook.

Non-interest expense increased $140 million or 5%, largely due to the impact of foreign exchange translation as well as the Brewin Dolphin acquisition and related costs in the current quarter. Higher staff and technology related costs also contributed to the increase. Partly offsetting these factors was the impact of a legal provision taken in U.S. Wealth Management (including City National) in the prior year that was partially released in the first quarter of 2022.

Q4 2022 vs. Q3 2022

Net income increased $45 million or 6% from last quarter, mainly due to higher net interest income largely reflecting higher interest rates. This factor was partially offset by lower average fee-based client assets, largely driven by unfavourable market conditions.


- 7 -


  Insurance


     As at or for the three months ended  
(Millions of Canadian dollars, except percentage amounts)   

October 31

2022


July 31

2022


October 31

2021


Non-interest income


Net earned premiums

   $ 908     $ 936     $ 1,569  

Investment income, gains/(losses) on assets supporting insurance policyholder liabilities (1)

     (334     245       (128

Fee income

     70       52       60  

Total revenue

     644       1,233       1,501  

PCL

     -         -         (1

Insurance policyholder benefits and claims (1)

     42       773       939  

Insurance policyholder acquisition expense

     74       77       93  

Non-interest expense

     157       139       152  

Income before income taxes

     371       244       318  

Net income

   $ 268     $ 186     $ 267  

Revenue by business


Canadian Insurance

   $ (130   $ 597     $ 796  

International Insurance

     774       636       705  

Selected balances and other information


ROE

     46.7 %     32.3 %     42.8 %

Premiums and deposits (2)

   $ 1,071     $ 1,155     $ 1,795  

Fair value changes on investments backing policyholder liabilities (1)

     (440     115       (266


(1)

Includes unrealized gains and losses on investments backing policyholder liabilities attributable to fluctuation of assets designated as fair value through profit or loss (FVTPL). The investments which support actuarial liabilities are predominantly fixed income assets designated as FVTPL. Consequently, changes in the fair values of these assets are recorded in Insurance premiums, investment and fee income in the Consolidated Statements of Income and are largely offset by changes in the fair value of the actuarial liabilities, the impact of which is reflected in Insurance policyholder benefits, claims and acquisition expense (PBCAE).

(2)

Premiums and deposits include premiums on risk-based individual and group insurance and annuity products as well as segregated fund deposits, consistent with insurance industry practices.

Q4 2022 vs. Q4 2021

Net income remained relatively flat largely reflecting the impact of offsetting items between revenue and PBCAE. PBCAE also included the impact of favourable annual actuarial assumption updates.

Total revenue decreased $857 million or 57%, primarily due to lower group annuity sales and the change in fair value of investments backing policyholder liabilities, both of which are largely offset in PBCAE as indicated below.

PBCAE decreased $916 million or 89%, primarily due to lower group annuity sales and the change in fair value of investments backing policyholder liabilities, both of which are largely offset in revenue. Higher favourable annual actuarial assumption updates largely related to economic assumption updates in the current year also contributed to the decrease.

Non-interest expense increased $5 million or 3%.

Q4 2022 vs. Q3 2022

Net income increased $82 million or 44% from last quarter, mainly due to favourable annual actuarial assumption updates.


  Investor & Treasury Services


     As at or for the three months ended  
(Millions of Canadian dollars, except percentage amounts)   

October 31

2022


July 31

2022


October 31

2021


Net interest income

   $ (1   $ 188     $ 155  

Non-interest income

     504       394       393  

Total revenue

     503       582       548  

PCL on performing assets

     -         1       (1

PCL on impaired assets

     -         (4     -    

PCL

     -         (3     (1

Non-interest expense

     377       374       412  

Income before income taxes

     126       207       137  

Net income

   $ 110     $ 164     $ 109  
       

Selected balances and other information


ROE

     13.5 %     20.2 %     15.2 %

Average deposits

   $ 252,800     $ 243,800     $ 233,300  

Average client deposits

     59,400       59,900       65,700  

Average wholesale funding deposits

     193,400       183,900       167,600  

AUA (1)

     3,906,900       4,089,900       4,640,900  

Average AUA

     4,138,000       4,262,100       4,745,400  


- 8 -


     For the three months ended  

Estimated impact of U.S. dollar, British pound and Euro translation on key income statement items

(Millions of Canadian dollars, except percentage amounts)

   Q4 2022 vs
Q4 2021
    Q4 2022 vs
Q3 2022
 

Increase (decrease):


Total revenue

   $ (15   $ 4  

Non-interest expense

     (18     -    

Net income

     2       3  

Percentage change in average US$ equivalent of C$1.00

     (7 )%      (6 )% 

Percentage change in average British pound equivalent of C$1.00

     11     2

Percentage change in average Euro equivalent of C$1.00

     9     0


(1)

Represents period-end spot balances.

Q4 2022 vs. Q4 2021

Net income remained relatively flat as the impact of higher revenue from client deposits was largely offset by lower funding and liquidity revenue and lower revenue from our asset services business.

Total revenue decreased $45 million or 8%, mainly due to lower funding and liquidity revenue including the impact of a funding cost adjustment. Funding and liquidity revenue, as reflected in net interest income, includes funding costs, which were unfavourably impacted by increasing rates and offset by gains on related economic hedges in non-interest income. Lower revenue from our asset services business, the impact of repositioning initiatives and foreign exchange translation also contributed to the decrease. These factors were partially offset by higher revenue from client deposits, reflecting improved margins.

Non-interest expense decreased $35 million or 8%, mainly due to the impact of foreign exchange translation and lower costs associated with ongoing efficiency initiatives.

Q4 2022 vs. Q3 2022

Net income decreased $54 million or 33% from last quarter, mainly driven by lower funding and liquidity revenue, including the impact of a funding cost adjustment.


  Capital Markets


As at or for the three months ended

 
(Millions of Canadian dollars, except percentage amounts)   

October 31

2022


July 31

2022


October 31

2021


Net interest income (1)

   $ 1,140     $ 1,136     $ 1,111  

Non-interest income (1)

     1,173       513       1,187  

Total revenue (1)

     2,313       1,649       2,298  

PCL on performing assets

     19       19       (11

PCL on impaired assets

     13       (13     (11

PCL

     32       6       (22

Non-interest expense

     1,616       1,123       1,155  

Income before income taxes

     665       520       1,165  

Net income

   $ 617     $ 479     $ 920  

Revenue by business


Corporate and Investment Banking

   $ 1,168     $ 625     $ 1,225  

Global Markets

     1,255       1,142       1,122  

Other

     (110     (118     (49

Selected balances and other information


ROE

     9.2 %     7.1 %     16.1 %

Average total assets

   $ 884,500     $ 812,700     $ 717,000  

Average trading securities

     126,800       128,400       125,300  

Average loans and acceptances, net

     130,800       126,000       106,100  

Average deposits

     81,300       75,700       73,700  

PCL on impaired loans as a % of average net loans and acceptances

     0.03 %     (0.04 )%      (0.04 )% 


     For the three months ended  

Estimated impact of U.S. dollar, British pound and Euro translation on key income statement items

(Millions of Canadian dollars, except percentage amounts)

   Q4 2022 vs
Q4 2021
    Q4 2022 vs
Q3 2022
 

Increase (decrease):


Total revenue

   $ 73     $ 78  

Non-interest expense

     30       40  

Net income

     40       33  

Percentage change in average US$ equivalent of C$1.00

     (7 )%      (6 )% 

Percentage change in average British pound equivalent of C$1.00

     11     2

Percentage change in average Euro equivalent of C$1.00

     9     0


(1)

The taxable equivalent basis (teb) adjustment for the three months ended October 31, 2022 was $142 million (July 31, 2022 – $143 million, October 31, 2021 - $125 million).

Q4 2022 vs. Q4 2021

Net income decreased $303 million or 33% from a year ago, primarily due to the timing of true-ups related to our variable compensation plans. Lower revenue in Corporate & Investment Banking, and higher PCL also contributed to the decrease. These factors were partially offset by a lower effective tax rate reflecting changes in the earnings mix as well as higher revenue in Global Markets.


- 9 -


Total revenue increased $15 million or 1%, mainly due to higher fixed income trading revenue across most regions partially offset by lower debt origination across all regions.

PCL was $32 million compared to $(22) million last year, largely attributable to provisions on performing assets in the current year, reflecting unfavorable changes in our macroeconomic outlook as compared to releases in the prior year reflective of the recovery from the COVID-19 pandemic. Provisions taken on impaired loans in the current quarter, largely in the other services sector, as compared to recoveries in the prior year, mainly in the oil and gas sector, also contributed to the increase, resulting in an increase of 7 bps in the PCL on impaired loans ratio.

Non-interest expense increased $461 million or 40%, primarily due to the timing of true-ups related to our variable compensation plans. Higher technology-related costs and the impact of foreign exchange translation also contributed to the increase.

Q4 2022 vs. Q3 2022

Net income increased $138 million or 29% from last quarter, mainly due to higher fixed income trading revenue as the prior quarter included the impact from loan underwriting markdowns, primarily in the U.S., largely driven by challenging market conditions. This factor was partially offset by higher compensation on increased results and the timing of true-ups related to our variable compensation plans.


  Corporate Support


     As at or for the three months ended  
(Millions of Canadian dollars)    October 31
2022
    July 31
2022
    October 31
2021
 

Net interest income (loss) (1)

   $ 93     $ (49   $ (49

Non-interest income (loss) (1), (2)

     (381     (120     29  

Total revenue (1), (2)

     (288     (169     (20

PCL

      -          -          -    

Non-interest expense (2)

     (69     2       59  

Income (loss) before income taxes (1)

     (219     (171     (79

Income taxes (recoveries) (1)

     (145     (119     (84

Net income (loss)

   $ (74   $ (52   $ 5  


(1)

Teb adjusted.

(2)

Revenue for the three months ended October 31, 2022, included losses of $98 million (losses of $22 million in the prior quarter and gains of $41 million in the same quarter last year) on economic hedges of our U.S. Wealth Management (including City National) share-based compensation plans, and non-interest expense included $(81) million ($(15) million in the prior quarter and $42 million in the same quarter last year) of share-based compensation expense driven by changes in the fair value of liabilities relating to our U.S. Wealth Management (including City National) share-based compensation plans.

Due to the nature of activities and consolidation adjustments reported in this segment, we believe that a comparative period analysis is not relevant.

Total revenue and Income taxes (recoveries) in each period in Corporate Support include the deduction of the teb adjustments related to the gross-up of income from Canadian taxable corporate dividends and the U.S. tax credit investment business recorded in Capital Markets. The amount deducted from revenue was offset by an equivalent increase in Income taxes (recoveries).

The teb amount for the three months ended October 31, 2022 was $142 million, compared to $143 million in the prior quarter and $125 million in the same quarter last year. For further discussion, refer to the How we measure and report our business segments section of our 2022 Annual Report.

The following identifies the material items, other than the teb impacts noted previously, affecting the reported results in each period.

Q4 2022

Net loss was $74 million, primarily due to residual unallocated items and unfavourable tax adjustments.

Q3 2022

Net loss was $52 million, primarily due to residual unallocated items and unfavourable tax adjustments.

Q4 2021

Net income was $5 million.


- 10 -


 Key performance and non-GAAP measures

We measure and evaluate the performance of our consolidated operations and each business segment using a number of financial metrics, such as net income, ROE and non-GAAP measures, including pre-provision, pre-tax earnings. Certain financial metrics, including ROE and pre-provision, pre-tax earnings do not have any standardized meanings under GAAP and may not be comparable to similar measures disclosed by other financial institutions. We use ROE, at both the consolidated and business segment levels, as a measure of return on total capital invested in our business. We use pre-provision, pre-tax earnings to assess our ability to generate sustained earnings growth outside of credit losses, which are impacted by the cyclical nature of a credit cycle. We believe that certain non-GAAP measures are more reflective of our ongoing operating results and provide readers with a better understanding of management’s perspective on our performance.


  Calculation of ROE


     For the three months ended            For the year ended  
     October 31, 2022            October 31, 2022  

(Millions of Canadian dollars, except

percentage amounts)


Personal &

Commercial

Banking


Wealth

Management

    Insurance    

Investor &

Treasury

Services


Capital

Markets


Corporate

Support

    Total            Total  

Net income available to common shareholders

   $ 2,114     $ 809     $ 266     $ 108     $ 599     $ (87   $ 3,809        $ 15,547  

Total average common equity (1), (2)

   $ 27,550     $ 20,550     $ 2,250     $ 3,200     $ 25,950     $ 17,650     $ 97,150        $ 94,700  

ROE (3)

     30.5 %     15.6 %     46.7 %     13.5 %     9.2 %     n.m.       15.6 %              16.4 %


(1)

Total average common equity represents rounded figures.

(2)

The amounts for the segments are referred to as attributed capital.

(3)

ROE is based on actual balances of average common equity before rounding.

n.m.

not meaningful

Additional information about key performance and non-GAAP measures can be found under the Key performance and non-GAAP measures section of our 2022 Annual Report.


- 11 -


  Consolidated Balance Sheets


     As at  
(Millions of Canadian dollars)   

October 31

2022 (1)


July 31

2022 (2)


October 31

2021 (1)


Assets


Cash and due from banks

   $ 72,397     $ 89,110     $ 113,846  

Interest-bearing deposits with banks

     108,011       98,145       79,638  

Securities


Trading

     148,205       141,986       139,240  

Investment, net of applicable allowance

     170,018       156,809       145,484  
       318,223       298,795       284,724  

Assets purchased under reverse repurchase agreements and securities borrowed

     317,845       318,565       307,903  

Loans


Retail

     549,751       538,389       503,598  

Wholesale

     273,967       261,592       218,066  
     823,718       799,981       721,664  

Allowance for loan losses

     (3,753     (3,667     (4,089
       819,965       796,314       717,575  

Segregated fund net assets

     2,638       2,690       2,666  

Other


Customers’ liability under acceptances

     17,827       17,360       19,798  

Derivatives

     154,439       122,058       95,541  

Premises and equipment

     7,214       7,142       7,424  

Goodwill

     12,277       10,933       10,854  

Other intangibles

     6,083       4,383       4,471  

Other assets

     80,300       76,597       61,883  
       278,140       238,473       199,971  

Total assets

   $ 1,917,219     $ 1,842,092     $ 1,706,323  

Liabilities and equity


Deposits


Personal

   $ 404,932     $ 392,267     $ 362,488  

Business and government

     759,870       739,467       696,353  

Bank

     44,012       46,870       41,990  
       1,208,814       1,178,604       1,100,831  

Segregated fund net liabilities

     2,638       2,690       2,666  

Other


Acceptances

     17,872       17,390       19,873  

Obligations related to securities sold short

     35,511       38,504       37,841  

Obligations related to assets sold under repurchase agreements and securities loaned

     273,947       281,149       262,201  

Derivatives

     153,491       119,868       91,439  

Insurance claims and policy benefit liabilities

     11,511       12,033       12,816  

Other liabilities

     95,235       77,745       70,301  
       587,567       546,689       494,471  

Subordinated debentures

     10,025       10,111       9,593  

Total liabilities

     1,809,044       1,738,094       1,607,561  

Equity attributable to shareholders


Preferred shares and other equity instruments

     7,318       7,328       6,684  

Common shares

     16,984       17,092       17,655  

Retained earnings

     78,037       76,466       71,795  

Other components of equity

     5,725       3,012       2,533  
     108,064       103,898       98,667  

Non-controlling interests

     111       100       95  

Total equity

     108,175       103,998       98,762  

Total liabilities and equity

   $ 1,917,219     $ 1,842,092     $ 1,706,323  


(1)

Derived from audited financial statements.

(2)

Derived from unaudited financial statements.


- 12 -


  Consolidated Statements of Income


     For the three months ended            For the year ended  
(Millions of Canadian dollars, except per share amounts)   

October 31 

2022 (1)


July 31

2022 (1)


October 31

2021 (1)


October 31 

2022 (2)


October 31

2021 (2)


Interest and dividend income


Loans

   $ 8,540     $ 6,761     $ 5,412        $ 26,565      $ 21,654  

Securities

     2,465       1,822       1,200          7,062        4,877  

Assets purchased under reverse repurchase agreements and securities borrowed

     2,941       1,601       307          5,447        1,309  

Deposits and other

     952       553       95          1,697        305  
       14,898       10,737       7,014                40,771        28,145  

Interest expense


Deposits and other

     5,197       2,786       1,270          10,751        5,448  

Other liabilities

     3,308       1,984       641          7,015        2,516  

Subordinated debentures

     111       77       42          288        179  
       8,616       4,847       1,953                18,054        8,143  

Net interest income

     6,282       5,890       5,061                22,717        20,002  

Non-interest income


Insurance premiums, investment and fee income

     644       1,233       1,501          3,510        5,600  

Trading revenue

     451       (128     103          926        1,183  

Investment management and custodial fees

     1,900       1,857       1,888          7,610        7,132  

Mutual fund revenue

     1,010       1,028       1,142          4,289        4,251  

Securities brokerage commissions

     349       344       350          1,481        1,538  

Service charges

     512       499       475          1,976        1,858  

Underwriting and other advisory fees

     481       369       655          2,058        2,692  

Foreign exchange revenue, other than trading

     266       250       239          1,038        1,066  

Card service revenue

     310       314       247          1,203        1,078  

Credit fees

     337       301       418          1,512        1,530  

Net gains (losses) on investment securities

     (23     28       20          43        145  

Share of profit in joint ventures and associates

     24       33       34          110        130  

Other

     24       114       243          512        1,488  
       6,285       6,242       7,315                26,268        29,691  

Total revenue

     12,567       12,132       12,376                48,985        49,693  

Provision for credit losses

     381       340       (227              484        (753

Insurance policyholder benefits, claims and acquisition expense

     116       850       1,032                1,783        3,891  
             

Non-interest expense


Human resources

     4,383       3,858       3,988          16,528        16,539  

Equipment

     571       514       514          2,099        1,986  

Occupancy

     401       381       393          1,554        1,584  

Communications

     319       277       279          1,082        931  

Professional fees

     472       373       417          1,511        1,351  

Amortization of other intangibles

     354       342       330          1,369        1,287  

Other

     709       641       662          2,466        2,246  
       7,209       6,386       6,583                26,609        25,924  
             

Income before income taxes

     4,861       4,556       4,988          20,109        20,631  

Income taxes

     979       979       1,096          4,302        4,581  

Net income

   $ 3,882     $ 3,577     $ 3,892              $ 15,807      $ 16,050  
             

Net income attributable to:


Shareholders

   $ 3,876     $ 3,575     $ 3,887        $ 15,794      $ 16,038  

Non-controlling interests

     6       2       5          13        12  
     $ 3,882     $ 3,577     $ 3,892              $ 15,807      $ 16,050  

Basic earnings per share (in dollars)

   $ 2.75     $ 2.52     $ 2.68              $ 11.08      $ 11.08  

Diluted earnings per share (in dollars)

     2.74       2.51       2.68          11.06        11.06  

Dividends per common share (in dollars)

     1.28       1.28       1.08                4.96        4.32  


(1)

Derived from unaudited financial statements.

(2)

Derived from audited financial statements.


- 13 -


  Consolidated Statements of Comprehensive Income


(Millions of Canadian dollars)    For the three months ended            For the year ended  
  

October 31

2022 (1)


July 31

2022 (1)


October 31

2021 (1)


October 31

2022 (2)


October 31

2021 (2)


Net income

   $ 3,882     $ 3,577     $ 3,892              $ 15,807     $ 16,050  

Other comprehensive income (loss), net of taxes


Items that will be reclassified subsequently to income:


Net change in unrealized gains (losses) on debt securities and loans at fair value through other comprehensive income


Net unrealized gains (losses) on debt securities and loans at fair value through other comprehensive income

     (849     (247     (183        (2,241     177  

Provision for credit losses recognized in income

     (3     (2     (1        (16     (9

Reclassification of net losses (gains) on debt securities and loans at fair value through other comprehensive income to income

     22       (5     (11              (12     (117
       (830     (254     (195              (2,269     51  

Foreign currency translation adjustments


Unrealized foreign currency translation gains (losses)

     3,878       (459     (613        5,091       (4,316

Net foreign currency translation gains (losses) from hedging activities

     (1,292     213       280          (1,449     1,740  

Reclassification of losses (gains) on foreign currency translation to income

      -         -        (2        (18     (7

Reclassification of losses (gains) on net investment hedging activities to income

      -         -         -                 17       (1
       2,586       (246     (335              3,641       (2,584

Net change in cash flow hedges


Net gains (losses) on derivatives designated as cash flow hedges

     963       (296     767          1,634       1,373  

Reclassification of losses (gains) on derivatives designated as cash flow hedges to income

      -        46       99                194       272  
       963       (250     866                1,828       1,645  

Items that will not be reclassified subsequently to income:


Remeasurements of employee benefit plans

     92       (319     456          821       2,251  

Net fair value change due to credit risk on financial liabilities designated as at fair value through profit or loss

     390       324       67          1,747       55  

Net gains (losses) on equity securities designated at fair value through other comprehensive income

     (3     10       40                50       38  
       479       15       563                2,618       2,344  

Total other comprehensive income (loss), net of taxes

     3,198       (735     899                5,818       1,456  

Total comprehensive income (loss)

   $ 7,080     $ 2,842     $ 4,791              $ 21,625     $ 17,506  

Total comprehensive income attributable to:


Shareholders

   $ 7,068     $ 2,841     $ 4,787        $ 21,604     $ 17,501  

Non-controlling interests

     12       1       4                21       5  
     $ 7,080     $ 2,842     $ 4,791              $ 21,625     $ 17,506  


(1)

Derived from unaudited financial statements.

(2)

Derived from audited financial statements.


- 14 -


  Consolidated Statements of Changes in Equity


    For the three months ended October 31, 2022 (1)  
                                        Other components of equity                    
(Millions of Canadian dollars)   Preferred
shares and
other equity
instruments
    Common
shares
    Treasury -
preferred
shares and
other equity
instruments
    Treasury -
common
shares
    Retained
earnings
           FVOCI
securities
and loans
    Foreign
currency
translation
    Cash
flow
hedges
    Total other
components
of equity
    Equity
attributable to
shareholders
    Non-controlling
interests
    Total
equity
 

Balance at beginning of period

  $ 7,323     $ 17,367     $ 5     $ (275   $ 76,466       $ (1,527   $ 3,108     $ 1,431     $ 3,012     $ 103,898     $ 100     $ 103,998  

Changes in equity


Issues of share capital and other equity instruments

     -        49        -         -         -           -         -         -         -        49        -        49  

Common shares purchased for cancellation

     -        (98      -         -        (884        -         -         -         -        (982      -        (982

Redemption of preferred shares and other equity instruments

     -         -         -         -         -           -         -         -         -         -         -         -   

Sales of treasury shares and other equity instruments

     -         -        50       1,034        -           -         -         -         -        1,084        -        1,084  

Purchases of treasury shares and other equity instruments

     -         -        (60     (1,093      -           -         -         -         -        (1,153      -        (1,153

Share-based compensation awards

     -         -         -         -         -           -         -         -         -         -         -         -   

Dividends on common shares

     -         -         -         -        (1,774        -         -         -         -        (1,774      -        (1,774

Dividends on preferred shares and distributions on other equity instruments

     -         -         -         -        (67        -         -         -         -        (67     (1     (68

Other

     -         -         -         -        (59        -         -         -         -        (59      -        (59

Net income

     -         -         -         -        3,876          -         -         -         -        3,876       6       3,882  

Total other comprehensive income (loss), net of taxes

     -         -         -         -        479         (830     2,580       963       2,713       3,192       6       3,198  

Balance at end of period

  $ 7,323     $ 17,318     $ (5   $ (334   $ 78,037             $ (2,357   $ 5,688     $ 2,394     $ 5,725     $ 108,064     $ 111     $ 108,175  


    For the three months ended October 31, 2021 (1)  
                                     Other components of equity                    
(Millions of Canadian dollars)   Preferred
shares and
other equity
instruments
    Common
shares
    Treasury -
preferred
shares and
other equity
instruments
    Treasury -
common
shares
    Retained
earnings
      

FVOCI

securities

and loans

    Foreign
currency
translation
    Cash flow
hedges
    Total other
components
of equity
    Equity
attributable to
shareholders
    Non-controlling
interests
    Total
equity
 

Balance at beginning of period

  $ 7,473     $ 17,713     $ (57   $ (57   $ 68,951        $ 107     $ 2,389     $ (300   $ 2,196     $ 96,219     $ 91     $ 96,310  

Changes in equity


Issues of share capital and other equity instruments

     -        15        -         -         -            -         -         -         -        15        -        15  

Common shares purchased for cancellation

     -         -         -         -         -            -         -         -         -         -         -         -   

Redemption of preferred shares and other equity instruments

    (750      -         -         -         -            -         -         -         -        (750      -        (750

Sales of treasury shares and other equity instruments

     -         -        205       994        -            -         -         -         -        1,199        -        1,199  

Purchases of treasury shares and other equity instruments


instruments

     -         -        (187     (1,010      -            -         -         -         -        (1,197      -        (1,197

Share-based compensation awards

     -         -         -         -        (2         -         -         -         -        (2      -        (2

Dividends on common shares

     -         -         -         -        (1,540         -         -         -         -        (1,540      -        (1,540

Dividends on preferred shares and distributions on other equity instruments

     -         -         -         -        (68         -         -         -         -        (68      -        (68

Other

     -         -         -         -        4           -         -         -         -        4        -        4  

Net income

     -         -         -         -        3,887           -         -         -         -        3,887       5       3,892  

Total other comprehensive income (loss), net of taxes

     -         -         -         -        563          (195     (334     866       337       900       (1     899  

Balance at end of period

  $ 6,723     $ 17,728     $ (39   $ (73   $ 71,795        $ (88   $ 2,055     $ 566     $ 2,533     $ 98,667     $ 95     $ 98,762  


(1)

Derived from unaudited financial statements.


- 15 -


    For the year ended October 31, 2022 (1)  
                                        Other components of equity                    
(Millions of Canadian dollars)   Preferred
shares and
other equity
instruments
    Common
shares
    Treasury -
preferred
shares and
other equity
instruments
    Treasury -
common
shares
    Retained
earnings
          

FVOCI

securities

and loans

    Foreign
currency
translation
    Cash flow
hedges
    Total other
components
of equity
    Equity
attributable to
shareholders
    Non-controlling
interests
    Total
equity
 

Balance at beginning of period

  $ 6,723     $ 17,728     $ (39   $ (73   $ 71,795       $ (88   $ 2,055     $ 566     $ 2,533     $ 98,667     $ 95     $ 98,762  

Changes in equity


Issues of share capital and other equity instruments

    750       99        -         -        (1        -         -         -         -        848        -        848  

Common shares purchased for cancellation

     -        (509      -         -        (4,917        -         -         -         -        (5,426      -        (5,426

Redemption of preferred shares and other equity instruments

    (150      -         -         -        (5        -         -         -         -        (155      -        (155

Sales of treasury shares and other equity instruments

     -         -        552       4,922        -           -         -         -         -        5,474        -        5,474  

Purchases of treasury shares and other equity instruments

     -         -        (518     (5,183      -           -         -         -         -        (5,701      -        (5,701

Share-based compensation awards

     -         -         -         -        2          -         -         -         -        2        -        2  

Dividends on common shares

     -         -         -         -        (6,946        -         -         -         -        (6,946      -        (6,946

Dividends on preferred shares and distributions on other equity instruments

     -         -         -         -        (247        -         -         -         -        (247     (5     (252

Other

     -         -         -         -        (56        -         -         -         -        (56      -        (56

Net income

     -         -         -         -        15,794          -         -         -         -        15,794       13       15,807  

Total other comprehensive income (loss), net of taxes

     -         -         -         -        2,618         (2,269     3,633       1,828       3,192       5,810       8       5,818  

Balance at end of period

  $ 7,323     $ 17,318     $ (5   $ (334   $ 78,037             $ (2,357   $ 5,688     $ 2,394     $ 5,725     $ 108,064     $ 111     $ 108,175  


    For the year ended October 31, 2021 (1)  
                                     Other components of equity                    
(Millions of Canadian dollars)   Preferred
shares and
other equity
instruments
    Common
shares
    Treasury -
preferred
shares and
other equity
instruments
    Treasury -
common
shares
    Retained
earnings
      

FVOCI

securities

and loans

    Foreign
currency
translation
    Cash flow
hedges
    Total other
components
of equity
    Equity
attributable to
shareholders
    Non-controlling
interests
    Total
equity
 

Balance at beginning of period

  $ 5,948     $ 17,628     $ (3   $ (129   $ 59,806        $ (139   $ 4,632     $ (1,079   $ 3,414     $ 86,664     $ 103     $ 86,767  

Changes in equity


Issues of share capital and other equity instruments

    2,250       100        -         -        (5         -         -         -         -        2,345        -        2,345  

Common shares purchased for cancellation

     -         -         -         -         -            -         -         -         -         -         -         -   

Redemption of preferred shares and other equity instruments

    (1,475      -         -         -         -            -         -         -         -        (1,475      -        (1,475

Sales of treasury shares and other equity instruments

     -         -        647       4,116        -            -         -         -         -        4,763        -        4,763  

Purchases of treasury shares and other equity instruments

     -         -        (683     (4,060      -            -         -         -         -        (4,743      -        (4,743

Share-based compensation awards

     -         -         -         -        (6         -         -         -         -        (6      -        (6

Dividends on common shares

     -         -         -         -        (6,158         -         -         -         -        (6,158      -        (6,158

Dividends on preferred shares and distributions on other equity instruments

     -         -         -         -        (257         -         -         -         -        (257     (3     (260

Other

     -         -         -         -        33           -         -         -         -        33       (10     23  

Net income

     -         -         -         -        16,038           -         -         -         -        16,038       12       16,050  

Total other comprehensive income (loss), net of taxes

     -         -         -         -        2,344          51       (2,577     1,645       (881     1,463       (7     1,456  

Balance at end of period

  $ 6,723     $ 17,728     $ (39   $ (73   $ 71,795        $ (88   $ 2,055     $ 566     $ 2,533     $ 98,667     $ 95     $ 98,762  


(1)

Derived from audited financial statements.


- 16 -


 CAUTION REGARDING FORWARD-LOOKING STATEMENTS

From time to time, we make written or oral forward-looking statements within the meaning of certain securities laws, including the “safe harbour” provisions of the United States Private Securities Litigation Reform Act of 1995 and any applicable Canadian securities legislation. We may make forward-looking statements in this Earnings Release, in other filings with Canadian regulators or the SEC, in reports to shareholders, and in other communications, including statements by our President and Chief Executive Officer. Forward-looking statements in this document include, but are not limited to, statements relating to our financial performance objectives, vision and strategic goals. The forward-looking information contained in this Earnings Release is presented for the purpose of assisting the holders of our securities and financial analysts in understanding our financial position and results of operations as at and for the periods ended on the dates presented, as well as our financial performance objectives, vision and strategic goals, and may not be appropriate for other purposes. Forward-looking statements are typically identified by words such as “believe”, “expect”, “foresee”, “forecast”, “anticipate”, “intend”, “estimate”, “goal”, “commit”, “target”, “objective”, “plan” and “project” and similar expressions of future or conditional verbs such as “will”, “may”, “might”, “should”, “could” or “would”.

By their very nature, forward-looking statements require us to make assumptions and are subject to inherent risks and uncertainties, which give rise to the possibility that our predictions, forecasts, projections, expectations or conclusions will not prove to be accurate, that our assumptions may not be correct, that our financial performance objectives, vision and strategic goals will not be achieved, and that our actual results may differ materially from such predictions, forecasts, projections, expectations or conclusions.

We caution readers not to place undue reliance on these statements as a number of risk factors could cause our actual results to differ materially from the expectations expressed in such forward-looking statements. These factors – many of which are beyond our control and the effects of which can be difficult to predict – include: credit, market, liquidity and funding, insurance, operational, regulatory compliance (which could lead to us being subject to various legal and regulatory proceedings, the potential outcome of which could include regulatory restrictions, penalties and fines), strategic, reputation, competitive, model, legal and regulatory environment, systemic risks and other risks discussed in the risk sections of our annual report for the fiscal year ended October 31, 2022 (the 2022 Annual Report); including business and economic conditions in the geographic regions in which we operate, Canadian housing and household indebtedness, information technology and cyber risks, geopolitical uncertainty, environmental and social risk (including climate change), digital disruption and innovation, privacy, data and third party related risks, regulatory changes, culture and conduct risks, the effects of changes in government fiscal, monetary and other policies, tax risk and transparency, and the emergence of widespread health emergencies or public health crises such as pandemics and epidemics, including the COVID-19 pandemic and its impact on the global economy, financial market conditions and our business operations, and financial results, condition and objectives. Additional factors that could cause actual results to differ materially from the expectations in such forward-looking statements can be found in the risk section of our 2022 Annual Report.

We caution that the foregoing list of risk factors is not exhaustive and other factors could also adversely affect our results. When relying on our forward-looking statements to make decisions with respect to us, investors and others should carefully consider the foregoing factors and other uncertainties and potential events. Material economic assumptions underlying the forward-looking statements contained in this Earnings Release are set out in the Economic, market and regulatory review and outlook section and for each business segment under the Strategic priorities and Outlook sections in our 2022 Annual Report. Except as required by law, we do not undertake to update any forward-looking statement, whether written or oral, that may be made from time to time by us or on our behalf.

Additional information about these and other factors can be found in the risk sections of our 2022 Annual Report. Information contained in or otherwise accessible through the websites mentioned does not form part of this Earnings Release. All references in this Earnings Release to websites are inactive textual references and are for your information only.

ACCESS TO QUARTERLY RESULTS MATERIALS

Interested investors, the media and others may review this quarterly Earnings Release, quarterly results slides, supplementary financial information and our 2022 Annual Report at rbc.com/investorrelations.

Quarterly conference call and webcast presentation

Our quarterly conference call is scheduled for November 30, 2022 at 8:00 a.m. (EST) and will feature a presentation about our fourth quarter and 2022 results by RBC executives. It will be followed by a question and answer period with analysts. Interested parties can access the call live on a listen-only basis at rbc.com/investorrelations/quarterly-financial-statements.html or by telephone (416-340-2217, 866-696-5910, passcode 6983188#). Please call between 7:50 a.m. and 7:55 a.m. (EST).

Management’s comments on results will be posted on our website shortly following the call. A recording will be available by 5:00 p.m. (EST) from November 30, 2022 until February 28, 2023 at rbc.com/investorrelations/quarterly-financial-statements.html or by telephone (905-694-9451 or 800-408-3053, passcode 4264780#).

Media Relations Contact

Gillian McArdle, Senior Director, Corporate Communications, gillian.mcardle@rbccm.com, 416-842-4231

Christine Stewart, Director, Financial Communications, christine.stewart@rbc.com, 647-271-2821

Investor Relations Contacts

Asim Imran, Vice President, Head of Investor Relations, asim.imran@rbc.com, 416-955-7804

Marco Giurleo, Senior Director, Investor Relations, marco.giurleo@rbc.com, 437-239-5374

ABOUT RBC

Royal Bank of Canada is a global financial institution with a purpose-driven, principles-led approach to delivering leading performance. Our success comes from the 95,000+ employees who leverage their imaginations and insights to bring our vision, values and strategy to life so we can help our clients thrive and communities prosper. As Canada’s biggest bank and one of the largest in the world, based on market capitalization, we have a diversified business model with a focus on innovation and providing exceptional experiences to our 17 million clients in Canada, the U.S. and 27 other countries. Learn more at rbc.com.

We are proud to support a broad range of community initiatives through donations, community investments and employee volunteer activities. See how at rbc.com/community-social-impact.

Trademarks used in this earnings release include the RBC LION & GLOBE Design, ROYAL BANK OF CANADA and RBC which are trademarks of Royal Bank of Canada used by Royal Bank of Canada and/or by its subsidiaries under license. All other trademarks mentioned in this earnings release, which are not the property of Royal Bank of Canada, are owned by their respective holders.


- 17 -