Loans and allowance for credit losses
Oct. 31, 2022
| Note 5 Loans and allowance for credit losses |
Loans by geography and portfolio net of allowance
As at October 31, 2022 |
||||||||||||||||||||||||
(Millions of Canadian dollars) |
Canada |
United States |
Other International |
Total |
Allowance for loan losses (1) |
Total net of allowance |
||||||||||||||||||
| Retail (2) |
||||||||||||||||||||||||
| Residential mortgages |
$ |
383,797 |
$ |
31,956 |
$ |
3,043 |
$ |
418,796 |
$ |
(432 |
) | $ |
418,364 |
|||||||||||
| Personal |
79,422 |
14,888 |
3,399 |
97,709 |
(856 |
) | 96,853 |
|||||||||||||||||
| Credit cards (3) |
19,778 |
558 |
241 |
20,577 |
(849 |
) | 19,728 |
|||||||||||||||||
| Small business (4) |
12,669 |
– |
– |
12,669 |
(181 |
) | 12,488 |
|||||||||||||||||
| Wholesale (2), (5) |
108,916 |
114,795 |
50,256 |
273,967 |
(1,435 |
) | 272,532 |
|||||||||||||||||
| Total loans |
$ |
604,582 |
$ |
162,197 |
$ |
56,939 |
$ |
823,718 |
$ |
(3,753 |
) | $ |
819,965 |
|||||||||||
| Undrawn loan commitments – Retail |
258,115 |
4,630 |
2,212 |
264,957 |
(243 |
) | ||||||||||||||||||
| Undrawn loan commitments – Wholesale |
118,928 |
225,113 |
81,194 |
425,235 |
(135 |
) | ||||||||||||||||||
| As at October 31, 2021 | ||||||||||||||||||||||||
(Millions of Canadian dollars) |
Canada | United States |
Other International |
Total | Allowance for loan losses (1) |
Total net of allowance |
||||||||||||||||||
| Retail (2) |
||||||||||||||||||||||||
| Residential mortgages |
$ | 354,169 | $ | 23,423 | $ | 2,740 | $ | 380,332 | $ | (416 | ) | $ | 379,916 | |||||||||||
| Personal |
78,232 | 11,794 | 3,415 | 93,441 | (973 | ) | 92,468 | |||||||||||||||||
| Credit cards (3) |
17,235 | 384 | 203 | 17,822 | (852 | ) | 16,970 | |||||||||||||||||
| Small business (4) |
12,003 | – | – | 12,003 | (168 | ) | 11,835 | |||||||||||||||||
| Wholesale (2), (5) |
88,083 | 86,028 | 43,955 | 218,066 | (1,680 | ) | 216,386 | |||||||||||||||||
| Total loans |
$ | 549,722 | $ | 121,629 | $ | 50,313 | $ | 721,664 | $ | (4,089 | ) | $ | 717,575 | |||||||||||
| Undrawn loan commitments – Retail |
240,242 | 3,713 | 1,989 | 245,944 | (136 | ) | ||||||||||||||||||
| Undrawn loan commitments – Wholesale |
107,070 | 189,177 | 75,331 | 371,578 | (105 | ) | ||||||||||||||||||
| (1) | Excludes allowance for loans measured at FVOCI of $5 million (October 31, 2021 – $14 million). |
| (2) | Geographic information is based on residence of the borrower. |
| (3) | The credit cards business is managed as a single portfolio and includes both consumer and business cards. |
| (4) | Includes small business exposure managed on a pooled basis. |
| (5) | Includes small business exposure managed on an individual client basis. |
Loans maturity and rate sensitivity
As at October 31, 2022 |
||||||||||||||||||||||||||||||||
Maturity term (1) |
Rate sensitivity |
|||||||||||||||||||||||||||||||
(Millions of Canadian dollars) |
Under 1 year (2) |
1 to 5 years |
Over 5 years |
Total |
Floating |
Fixed Rate |
Non-rate- sensitive |
Total |
||||||||||||||||||||||||
| Retail |
$ |
277,302 |
$ |
226,793 |
$ |
45,656 |
$ |
549,751 |
$ |
199,414 |
$ |
342,087 |
$ |
8,250 |
$ |
549,751 |
||||||||||||||||
| Wholesale |
226,813 |
35,802 |
11,352 |
273,967 |
46,660 |
225,123 |
2,184 |
273,967 |
||||||||||||||||||||||||
| Total loans |
$ |
504,115 |
$ |
262,595 |
$ |
57,008 |
$ |
823,718 |
$ |
246,074 |
$ |
567,210 |
$ |
10,434 |
$ |
823,718 |
||||||||||||||||
| Allowance for loan losses |
(3,753 |
) | (3,753 |
) | ||||||||||||||||||||||||||||
| Total loans net of allowance for loan losses |
$ |
819,965 |
$ |
819,965 |
||||||||||||||||||||||||||||
As at October 31, 2021 |
||||||||||||||||||||||||||||||||
| Maturity term (1) |
Rate sensitivity |
|||||||||||||||||||||||||||||||
(Millions of Canadian dollars) |
Under 1 year (2) |
1 to 5 years |
Over 5 years |
Total |
Floating |
Fixed Rate |
Non-rate- sensitive |
Total |
||||||||||||||||||||||||
| Retail |
$ | 249,363 | $ | 222,408 | $ | 31,827 | $ | 503,598 | $ | 166,910 | $ | 329,185 | $ | 7,503 | $ | 503,598 | ||||||||||||||||
| Wholesale |
174,345 | 33,882 | 9,839 | 218,066 | 36,143 | 179,588 | 2,335 | 218,066 | ||||||||||||||||||||||||
| Total loans |
$ | 423,708 | $ | 256,290 | $ | 41,666 | $ | 721,664 | $ | 203,053 | $ | 508,773 | $ | 9,838 | $ | 721,664 | ||||||||||||||||
| Allowance for loan losses |
(4,089 | ) | (4,089 | ) | ||||||||||||||||||||||||||||
| Total loans net of allowance for loan losses |
$ | 717,575 | $ | 717,575 | ||||||||||||||||||||||||||||
| (1) | Generally, based on the earlier of contractual repricing or maturity date. |
| (2) | Includes variable rate loans that can be repriced at the clients’ discretion without penalty. |
Allowance for credit losses
| For the year ended | ||||||||||||||||||||||||||||||||||||||||||||
October 31, 2022 |
October 31, 2021 | |||||||||||||||||||||||||||||||||||||||||||
| (Millions of Canadian dollars) | Balance at beginning of period |
Provision for credit losses |
Net write-offs |
Exchange rate and other |
Balance at end of period |
Balance at beginning of period |
Provision for credit losses |
Net write-offs (1) |
Exchange rate and other |
Balance at end of period |
||||||||||||||||||||||||||||||||||
| Retail |
||||||||||||||||||||||||||||||||||||||||||||
| Residential mortgages |
$ |
416 |
$ |
27 |
$ |
(24 |
) |
$ |
13 |
$ |
432 |
$ | 518 | $ | (43 | ) | $ | (27 | ) | $ | (32 | ) | $ | 416 | ||||||||||||||||||||
| Personal |
1,079 |
211 |
(248 |
) |
1 |
1,043 |
1,309 | 23 | (247 | ) | (6 | ) | 1,079 | |||||||||||||||||||||||||||||||
| Credit cards |
875 |
348 |
(332 |
) |
2 |
893 |
1,246 | (72 | ) | (297 | ) | (2 | ) | 875 | ||||||||||||||||||||||||||||||
| Small business |
177 |
31 |
(23 |
) |
9 |
194 |
140 | 12 | (23 | ) | 48 | 177 | ||||||||||||||||||||||||||||||||
| Wholesale |
1,797 |
(90 |
) |
(136 |
) |
3 |
1,574 |
2,795 | (560 | ) | (200 | ) | (238 | ) | 1,797 | |||||||||||||||||||||||||||||
| Customers’ liability under acceptances |
75 |
(30 |
) |
– |
– |
45 |
107 | (32 | ) | – | – | 75 | ||||||||||||||||||||||||||||||||
$ |
4,419 |
$ |
497 |
$ |
(763 |
) |
$ |
28 |
$ |
4,181 |
$ | 6,115 | $ | (672 | ) | $ | (794 | ) | $ | (230 | ) | $ | 4,419 | |||||||||||||||||||||
| Presented as: |
||||||||||||||||||||||||||||||||||||||||||||
| Allowance for loan losses |
$ |
4,089 |
$ |
3,753 |
$ | 5,639 | $ | 4,089 | ||||||||||||||||||||||||||||||||||||
| Other liabilities – Provisions |
241 |
378 |
363 | 241 | ||||||||||||||||||||||||||||||||||||||||
| Customers’ liability under acceptances |
75 |
45 |
107 | 75 | ||||||||||||||||||||||||||||||||||||||||
| Other components of equity |
14 |
5 |
6 | 14 | ||||||||||||||||||||||||||||||||||||||||
| (1) | Loans written-off are generally subject to continued collection efforts for a period of time following write-off. The contractual amount outstanding on loans written-off during the year ended October 31, 2022 that are no longer subject to enforcement activity was $53 million (October 31, 2021 – $93 million). |
The following table reconciles the opening and closing allowance for each major product of loans and commitments as determined by our modelled, scenario-weighted allowance and the application of expert credit judgment as applicable. Reconciling items include the following:
| • | Model changes, which generally comprise the impact of significant changes to the quantitative models used to estimate expected credit losses and any staging impacts that may arise. |
| • | Transfers between stages, which are presumed to occur before any corresponding remeasurements of the allowance. |
| • | Originations, which reflect the allowance related to assets newly recognized during the period, including those assets that were derecognized following a modification of terms. |
| • | Maturities, which reflect the allowance related to assets derecognized during the period without a credit loss being incurred, including those assets that were derecognized following a modification of terms. |
| • | Changes in risk, parameters and exposures, which comprise the impact of changes in model inputs or assumptions, including changes in forward-looking macroeconomic conditions; partial repayments and additional draws on existing facilities; changes in the measurement following a transfer between stages; and unwinding of the time value discount due to the passage of time in Stage 1 and Stage 2. |
Allowance for credit losses – Retail and wholesale loans
For the year ended |
||||||||||||||||||||||||||||||||||||||||||||
October 31, 2022 |
October 31, 2021 |
|||||||||||||||||||||||||||||||||||||||||||
Performing |
Impaired |
Performing |
Impaired |
|||||||||||||||||||||||||||||||||||||||||
(Millions of Canadian dollars) |
Stage 1 |
Stage 2 |
Stage 3 |
Total |
Stage 1 |
Stage 2 |
Stage 3 |
Total |
||||||||||||||||||||||||||||||||||||
Residential mortgages |
||||||||||||||||||||||||||||||||||||||||||||
Balance at beginning of period |
$ |
186 |
$ |
92 |
$ |
138 |
$ |
416 |
$ | 206 | $ | 160 | $ | 152 | $ | 518 | ||||||||||||||||||||||||||||
Provision for credit losses |
||||||||||||||||||||||||||||||||||||||||||||
Model changes |
(21 |
) |
10 |
– |
(11 |
) |
(6 | ) | (5 | ) | – | (11 | ) | |||||||||||||||||||||||||||||||
Transfers to stage 1 |
113 |
(98 |
) |
(15 |
) |
– |
205 | (182 | ) | (23 | ) | – | ||||||||||||||||||||||||||||||||
Transfers to stage 2 |
(14 |
) |
23 |
(9 |
) |
– |
(14 | ) | 18 | (4 | ) | – | ||||||||||||||||||||||||||||||||
Transfers to stage 3 |
(2 |
) |
(25 |
) |
27 |
– |
(2 | ) | (44 | ) | 46 | – | ||||||||||||||||||||||||||||||||
Originations |
159 |
– |
– |
159 |
113 | – | – | 113 | ||||||||||||||||||||||||||||||||||||
Maturities |
(23 |
) |
(9 |
) |
– |
(32 |
) |
(30 | ) | (24 | ) | – | (54 | ) | ||||||||||||||||||||||||||||||
Changes in risk, parameters and exposures |
(167 |
) |
68 |
10 |
(89 |
) |
(284 | ) | 178 | 15 | (91 | ) | ||||||||||||||||||||||||||||||||
Write-offs |
– |
– |
(38 |
) |
(38 |
) |
– | – | (37 | ) | (37 | ) | ||||||||||||||||||||||||||||||||
Recoveries |
– |
– |
14 |
14 |
– | – | 10 | 10 | ||||||||||||||||||||||||||||||||||||
Exchange rate and other |
4 |
4 |
5 |
13 |
(2 | ) | (9 | ) | (21 | ) | (32 | ) | ||||||||||||||||||||||||||||||||
Balance at end of period |
$ |
235 |
$ |
65 |
$ |
132 |
$ |
432 |
$ | 186 | $ | 92 | $ | 138 | $ | 416 | ||||||||||||||||||||||||||||
Personal |
||||||||||||||||||||||||||||||||||||||||||||
Balance at beginning of period |
$ |
422 |
$ |
569 |
$ |
88 |
$ |
1,079 |
$ | 480 | $ | 733 | $ | 96 | $ | 1,309 | ||||||||||||||||||||||||||||
Provision for credit losses |
||||||||||||||||||||||||||||||||||||||||||||
Model changes |
(3 |
) |
– |
– |
(3 |
) |
(1 | ) | – | – | (1 | ) | ||||||||||||||||||||||||||||||||
Transfers to stage 1 |
609 |
(607 |
) |
(2 |
) |
– |
710 | (706 | ) | (4 | ) | – | ||||||||||||||||||||||||||||||||
Transfers to stage 2 |
(120 |
) |
121 |
(1 |
) |
– |
(97 | ) | 97 | – | – | |||||||||||||||||||||||||||||||||
Transfers to stage 3 |
(2 |
) |
(47 |
) |
49 |
– |
(3 | ) | (58 | ) | 61 | – | ||||||||||||||||||||||||||||||||
Originations |
106 |
– |
– |
106 |
128 | – | – | 128 | ||||||||||||||||||||||||||||||||||||
Maturities |
(70 |
) |
(99 |
) |
– |
(169 |
) |
(96 | ) | (130 | ) | – | (226 | ) | ||||||||||||||||||||||||||||||
Changes in risk, parameters and exposures |
(660 |
) |
724 |
213 |
277 |
(697 | ) | 633 | 186 | 122 | ||||||||||||||||||||||||||||||||||
Write-offs |
– |
– |
(374 |
) |
(374 |
) |
– | – | (387 | ) | (387 | ) | ||||||||||||||||||||||||||||||||
Recoveries |
– |
– |
126 |
126 |
– | – | 140 | 140 | ||||||||||||||||||||||||||||||||||||
Exchange rate and other |
3 |
– |
(2 |
) |
1 |
(2 | ) | – | (4 | ) | (6 | ) | ||||||||||||||||||||||||||||||||
Balance at end of period |
$ |
285 |
$ |
661 |
$ |
97 |
$ |
1,043 |
$ | 422 | $ | 569 | $ | 88 | $ | 1,079 | ||||||||||||||||||||||||||||
Credit cards |
||||||||||||||||||||||||||||||||||||||||||||
Balance at beginning of period |
$ |
233 |
$ |
642 |
$ |
– |
$ |
875 |
$ | 364 | $ | 882 | $ | – | $ | 1,246 | ||||||||||||||||||||||||||||
Provision for credit losses |
||||||||||||||||||||||||||||||||||||||||||||
Model changes |
(2 |
) |
– |
– |
(2 |
) |
– | – | – | – | ||||||||||||||||||||||||||||||||||
Transfers to stage 1 |
495 |
(495 |
) |
– |
– |
723 | (723 | ) | – | – | ||||||||||||||||||||||||||||||||||
Transfers to stage 2 |
(95 |
) |
95 |
– |
– |
(105 | ) | 105 | – | – | ||||||||||||||||||||||||||||||||||
Transfers to stage 3 |
(2 |
) |
(325 |
) |
327 |
– |
(4 | ) | (309 | ) | 313 | – | ||||||||||||||||||||||||||||||||
Originations |
10 |
– |
– |
10 |
6 | – | – | 6 | ||||||||||||||||||||||||||||||||||||
Maturities |
(5 |
) |
(29 |
) |
– |
(34 |
) |
(7 | ) | (31 | ) | – | (38 | ) | ||||||||||||||||||||||||||||||
Changes in risk, parameters and exposures |
(458 |
) |
826 |
6 |
374 |
(742 | ) | 719 | (17 | ) | (40 | ) | ||||||||||||||||||||||||||||||||
Write-offs |
– |
– |
(503 |
) |
(503 |
) |
– | – | (460 | ) | (460 | ) | ||||||||||||||||||||||||||||||||
Recoveries |
– |
– |
171 |
171 |
– | – | 163 | 163 | ||||||||||||||||||||||||||||||||||||
Exchange rate and other |
1 |
2 |
(1 |
) |
2 |
(2 | ) | (1 | ) | 1 | (2 | ) | ||||||||||||||||||||||||||||||||
Balance at end of period |
$ |
177 |
$ |
716 |
$ |
– |
$ |
893 |
$ | 233 | $ | 642 | $ | – | $ | 875 | ||||||||||||||||||||||||||||
Small business |
||||||||||||||||||||||||||||||||||||||||||||
Balance at beginning of period |
$ |
88 |
$ |
55 |
$ |
34 |
$ |
177 |
$ | 78 | $ | 29 | $ | 33 | $ | 140 | ||||||||||||||||||||||||||||
Provision for credit losses |
||||||||||||||||||||||||||||||||||||||||||||
Model changes |
– |
– |
– |
– |
3 | 1 | – | 4 | ||||||||||||||||||||||||||||||||||||
Transfers to stage 1 |
27 |
(27 |
) |
– |
– |
57 | (57 | ) | – | – | ||||||||||||||||||||||||||||||||||
Transfers to stage 2 |
(17 |
) |
17 |
– |
– |
(11 | ) | 11 | – | – | ||||||||||||||||||||||||||||||||||
Transfers to stage 3 |
(1 |
) |
(4 |
) |
5 |
– |
(1 | ) | (2 | ) | 3 | – | ||||||||||||||||||||||||||||||||
Originations |
32 |
– |
– |
32 |
36 | – | – | 36 | ||||||||||||||||||||||||||||||||||||
Maturities |
(22 |
) |
(24 |
) |
– |
(46 |
) |
(21 | ) | (22 | ) | – | (43 | ) | ||||||||||||||||||||||||||||||
Changes in risk, parameters and exposures |
(43 |
) |
50 |
38 |
45 |
(77 | ) | 64 | 28 | 15 | ||||||||||||||||||||||||||||||||||
Write-offs |
– |
– |
(32 |
) |
(32 |
) |
– | – | (32 | ) | (32 | ) | ||||||||||||||||||||||||||||||||
Recoveries |
– |
– |
9 |
9 |
– | – | 9 | 9 | ||||||||||||||||||||||||||||||||||||
Exchange rate and other |
9 |
6 |
(6 |
) |
9 |
24 | 31 | (7 | ) | 48 | ||||||||||||||||||||||||||||||||||
Balance at end of period |
$ |
73 |
$ |
73 |
$ |
48 |
$ |
194 |
$ | 88 | $ | 55 | $ | 34 | $ | 177 | ||||||||||||||||||||||||||||
Wholesale |
||||||||||||||||||||||||||||||||||||||||||||
Balance at beginning of period |
$ |
566 |
$ |
794 |
$ |
437 |
$ |
1,797 |
$ | 995 | $ | 1,132 | $ | 668 | $ | 2,795 | ||||||||||||||||||||||||||||
Provision for credit losses |
||||||||||||||||||||||||||||||||||||||||||||
Model changes |
(14 |
) |
(3 |
) |
– |
(17 |
) |
1 | 24 | – | 25 | |||||||||||||||||||||||||||||||||
Transfers to stage 1 |
415 |
(411 |
) |
(4 |
) |
– |
581 | (576 | ) | (5 | ) | – | ||||||||||||||||||||||||||||||||
Transfers to stage 2 |
(78 |
) |
80 |
(2 |
) |
– |
(132 | ) | 161 | (29 | ) | – | ||||||||||||||||||||||||||||||||
Transfers to stage 3 |
(3 |
) |
(62 |
) |
65 |
– |
(4 | ) | (60 | ) | 64 | – | ||||||||||||||||||||||||||||||||
Originations |
641 |
– |
– |
641 |
601 | – | – | 601 | ||||||||||||||||||||||||||||||||||||
Maturities |
(439 |
) |
(345 |
) |
– |
(784 |
) |
(488 | ) | (500 | ) | – | (988 | ) | ||||||||||||||||||||||||||||||
Changes in risk, parameters and exposures |
(504 |
) |
503 |
71 |
70 |
(931 | ) | 689 | 44 | (198 | ) | |||||||||||||||||||||||||||||||||
Write-offs |
– |
– |
(202 |
) |
(202 |
) |
– | – | (253 | ) | (253 | ) | ||||||||||||||||||||||||||||||||
Recoveries |
– |
– |
66 |
66 |
– | – | 53 | 53 | ||||||||||||||||||||||||||||||||||||
Exchange rate and other |
13 |
29 |
(39 |
) |
3 |
(57 | ) | (76 | ) | (105 | ) | (238 | ) | |||||||||||||||||||||||||||||||
Balance at end of period |
$ |
597 |
$ |
585 |
$ |
392 |
$ |
1,574 |
$ | 566 | $ | 794 | $ | 437 | $ | 1,797 | ||||||||||||||||||||||||||||
Key inputs and assumptions
The measurement of expected credit losses is a complex calculation that involves a large number of interrelated inputs and assumptions and the allowance is not sensitive to any one single factor alone. The key drivers of changes in expected credit losses include the following:
| • | Changes in the credit quality of the borrower or instrument, primarily reflected in changes in internal risk ratings; |
| • | Changes in forward-looking macroeconomic conditions, specifically the macroeconomic variables to which our models are calibrated, which are those most closely correlated with credit losses in the relevant portfolio; |
| • | Changes in scenario design and the weights assigned to each scenario; and |
| • | Transfers between stages, which can be triggered by changes to any of the above inputs. |
To reflect relevant risk factors not captured in our modelled results, we applied expert credit judgment in determining significant increases in credit risk since origination as well as in the measurement of our weighted allowance for credit losses due to uncertainty related to the pace and level of deterioration in economic forecasts.
Internal risk ratings
Internal risk ratings are assigned according to the risk management framework outlined under the headings Wholesale credit risk and Retail credit risk of the Credit risk section of Management’s Discussion and Analysis. Changes in internal risk ratings are primarily reflected in the PD parameters, which are estimated based on our historical loss experience at the relevant risk segment or risk rating level, adjusted for forward-looking information.
Scenario design and weightings
Our estimation of expected credit losses in Stage 1 and Stage 2 considers five distinct future macroeconomic scenarios. Scenarios are designed to capture a wide range of possible outcomes and are weighted according to our expectation of the relative likelihood of the range of outcomes that each scenario represents at the reporting date. We weight each scenario to take into account historical frequency, current trends, and forward-looking conditions which will change over time. The base case scenario is based on forecasts of the expected rate, value or yield for each relevant macroeconomic variable. The upside and downside scenarios are set by adjusting our base projections to construct reasonably possible scenarios and weightings that are more optimistic and pessimistic, respectively, than the base case. Two additional downside scenarios capture the non-linear nature of potential credit losses across our portfolios.
The impact of each of our five scenarios varies across our portfolios given the portfolios have different sensitivities to movements in each macroeconomic variable. We reassessed our scenario weights to increase weight to the downside scenarios relative to October 31, 2021 in order to reflect the uncertainty and downside risk of deeper recessions than contemplated in our base scenario.
The impact of weighting these multiple scenarios increased our ACL on performing loans, relative to our base scenario, by $738 million at October 31, 2022 (October 31, 2021 – $726 million).
Forward looking macroeconomic variables
The PD, LGD and EAD inputs used to estimate
S
tage 1 and S
tage 2 credit loss allowances are modelled based on the macroeconomic variables (or changes in macroeconomic variables) that are most closely correlated with credit losses in the relevant portfolio. Each macroeconomic scenario used in our expected credit loss calculation includes a projection of all relevant macroeconomic variables used in our models for a five year horizon, reverting to long-run averages generally within the 2 to 5 year period. Depending on their usage in the models, macroeconomic variables are projected at a country, province/state or more granular level. These include one or more of the variables described below, which differ by portfolio and region. Our allowance for credit losses reflects our economic outlook as at October 31, 2022. Subsequent changes to this forecast and related estimates will be reflected in our allowance for credit losses in future periods.
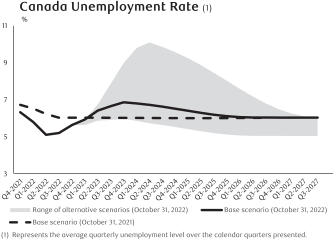
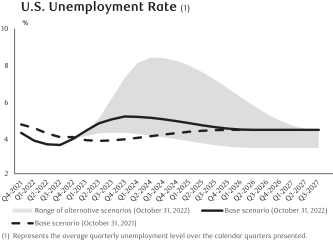
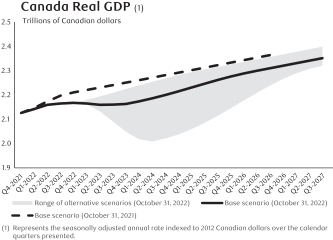
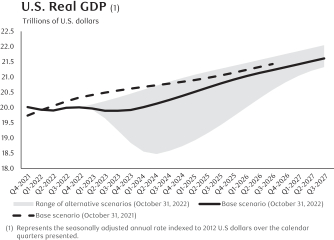
Our base scenario reflects rising unemployment rates, high inflation, production capacity limits, supply chain pressures, and increased expectations for central banks to continue increasing interest rates which results in moderate recessions expected in Canada and the U.S. in calendar 2023. Our base scenario also reflects declining housing prices in Canada.
Downside scenarios, including two additional and more severe downside scenarios designed for the energy and real estate sectors, reflect the possibility of a more severe macroeconomic shock beginning in calendar Q1 2023 relative
to
our base scenario. Conditions are expected to deteriorate from calendar Q4 2022 levels for up to 18 months, followed by a recovery for the remainder of the period. These scenarios assume monetary policy responses that return the economy to a long-run, sustainable growth rate within the forecast period. The possibility of a deeper recession and a more prolonged recovery as compared to our base scenario, including further monetary policy responses to elevated inflation rates which may increase credit risk, is reflected in our general downside scenario. The upside scenario reflects slightly stronger economic growth than the base scenario, without prompting a further offsetting monetary policy response as compared to our base scenario, followed by a return to a long-run sustainable growth rate within the forecast period.
The following provides additional detail about our calendar quarter forecasts for certain key macroeconomic variables used in the models to estimate ACL:
| • | Unemployment |
 |
 |
| • | Gross Domestic Product (GDP) |
 |
 |
| • | Oil price (West Texas Intermediate in US$) |
| • | Canadian housing price index from calendar Q4 2022 , with a compound annual growth rate of 5.2% for the following 2 to 5 years. The range of annual housing price growth (contraction) in our alternative real estate downside and upside scenarios is (30.0)% to 10.9% over the next 12 months and 4.2% to 9.5% for the following 2 to 5 years. As at October 31, 2021 our base forecast included housing price growth of 0.1% from calendar Q4 2021 for the next 12 months and 4.1% for the following 2 to 5 years. |
The primary variables driving credit losses in our retail portfolios are Canadian unemployment rates, Canadian housing price index and Canadian GDP. The Canadian overnight interest rate also impacts our retail portfolios. Our wholesale portfolios are affected by all of the variables discussed above; however, the specific variables differ by sector. Other variables also impact our wholesale portfolios including, but not limited to, Canadian and U.S. 10 year BBB corporate bond credit spreads, Canadian and U.S. 10 year government bond yields, U.S. 10 year BBB corporate bond yield, Canadian consumer confidence index, Canadian and U.S. commercial real estate price indices, U.S. housing price index, and natural gas prices (Henry Hub).
Increases in the following macroeconomic variables will generally correlate with higher expected credit losses: Canadian and U.S. unemployment rates, Canadian overnight interest rates, Canadian and U.S. 10 year BBB corporate bond credit spreads, Canadian and U.S. 10 year government bond yields, and U.S. 10 year BBB corporate bond yield.
Increases in the following macroeconomic variables will generally correlate with lower expected credit losses: Canadian and U.S. housing price indices, Canadian and U.S. GDP, Canadian consumer confidence index, Canadian and U.S. commercial real estate price indices, and oil and natural gas prices.
Transfers between stages
Transfers between
S
tage 1 and S
tage 2 are based on the assessment of significant increases in credit risk relative to initial recognition, as described in Note 2. The impact of moving from 12 months expected credit losses to lifetime expected credit losses, or vice versa, varies by product and is dependent on the expected remaining life at the date of the transfer. Stage transfers may result in significant fluctuations in expected credit losses. The following table illustrates the impact of staging on our ACL by comparing our allowance if all performing loans were in
S
tage 1 to the actual ACL recorded on these assets. As at |
||||||||||||||||||||||||||||
October 31, 2022 |
October 31, 2021 |
|||||||||||||||||||||||||||
ACL – All performing loans in Stage 1 |
Impact of staging |
Stage 1 and 2 ACL |
ACL – All performing loans in Stage 1 |
Impact of staging |
Stage 1 and 2 ACL |
|||||||||||||||||||||||
Performing loans (1) |
$ 2,373 |
$ 1,094 |
$ 3,467 |
$ 2,521 | $ 1,125 | $ 3,646 | ||||||||||||||||||||||
(1) |
Represents loans and commitments in Stage 1 and Stage 2. |
Credit risk exposure by internal risk rating
The following table presents the gross carrying amount of loans measured at amortized cost, and the full contractual amount of undrawn loan commitments subject to the impairment requirements of IFRS 9. Risk ratings are based on internal ratings used in the measurement of expected credit losses as at the reporting date, as outlined in the internal ratings maps for Wholesale and Retail facilities in the Credit risk section of Management’s Discussion and Analysis.
As at |
||||||||||||||||||||||||||||||||||||
October 31, 2022 |
October 31, 2021 |
|||||||||||||||||||||||||||||||||||
(Millions of Canadian dollars) |
Stage 1 |
Stage 2 |
Stage 3 |
Total |
Stage 1 |
Stage 2 |
Stage 3 (1) |
Total |
||||||||||||||||||||||||||||
| Retail |
||||||||||||||||||||||||||||||||||||
| Loans outstanding – Residential mortgages |
||||||||||||||||||||||||||||||||||||
| Low risk |
$ |
340,716 |
$ |
2,573 |
$ |
– |
$ |
343,289 |
$ | 310,334 | $ | 1,507 | $ | – | $ | 311,841 | ||||||||||||||||||||
| Medium risk |
15,035 |
1,932 |
– |
16,967 |
15,152 | 2,051 | – | 17,203 | ||||||||||||||||||||||||||||
| High risk |
1,188 |
3,125 |
– |
4,313 |
3,343 | 634 | – | 3,977 | ||||||||||||||||||||||||||||
| Not rated (2) |
51,915 |
1,304 |
– |
53,219 |
45,512 | 913 | – | 46,425 | ||||||||||||||||||||||||||||
| Impaired |
– |
– |
560 |
560 |
– | – | 645 | 645 | ||||||||||||||||||||||||||||
408,854 |
8,934 |
560 |
418,348 |
374,341 | 5,105 | 645 | 380,091 | |||||||||||||||||||||||||||||
| Items not subject to impairment (3) |
448 |
241 | ||||||||||||||||||||||||||||||||||
| Total |
$ |
418,796 |
$ |
380,332 | ||||||||||||||||||||||||||||||||
| Loans outstanding – Personal |
||||||||||||||||||||||||||||||||||||
| Low risk |
$ |
73,339 |
$ |
2,575 |
$ |
– |
$ |
75,914 |
$ | 72,267 | $ | 698 | $ | – | $ | 72,965 | ||||||||||||||||||||
| Medium risk |
5,482 |
3,780 |
– |
9,262 |
4,974 | 4,551 | – | 9,525 | ||||||||||||||||||||||||||||
| High risk |
836 |
1,660 |
– |
2,496 |
687 | 1,045 | – | 1,732 | ||||||||||||||||||||||||||||
| Not rated (2) |
9,733 |
104 |
– |
9,837 |
8,934 | 88 | – | 9,022 | ||||||||||||||||||||||||||||
| Impaired |
– |
– |
200 |
200 |
– | – | 197 | 197 | ||||||||||||||||||||||||||||
| Total |
$ |
89,390 |
$ |
8,119 |
$ |
200 |
$ |
97,709 |
$ |
86,862 | $ |
6,382 | $ |
197 | $ |
93,441 | ||||||||||||||||||||
| Loans outstanding – Credit cards |
||||||||||||||||||||||||||||||||||||
| Low risk |
$ |
15,088 |
$ |
83 |
$ |
– |
$ |
15,171 |
$ | 12,864 | $ | 24 | $ | – | $ | 12,888 | ||||||||||||||||||||
| Medium risk |
1,418 |
1,911 |
– |
3,329 |
1,646 | 1,645 | – | 3,291 | ||||||||||||||||||||||||||||
| High risk |
39 |
1,255 |
– |
1,294 |
136 | 937 | – | 1,073 | ||||||||||||||||||||||||||||
| Not rated (2) |
751 |
32 |
– |
783 |
527 | 43 | – | 570 | ||||||||||||||||||||||||||||
| Total |
$ |
17,296 |
$ |
3,281 |
$ |
– |
$ |
20,577 |
$ |
15,173 | $ |
2,649 | $ |
– | $ |
17,822 | ||||||||||||||||||||
| Loans outstanding – Small business |
||||||||||||||||||||||||||||||||||||
| Low risk |
$ |
8,571 |
$ |
838 |
$ |
– |
$ |
9,409 |
$ | 8,609 | $ | 274 | $ | – | $ | 8,883 | ||||||||||||||||||||
| Medium risk |
1,512 |
1,130 |
– |
2,642 |
1,583 | 979 | – | 2,562 | ||||||||||||||||||||||||||||
| High risk |
102 |
375 |
– |
477 |
227 | 218 | – | 445 | ||||||||||||||||||||||||||||
| Not rated (2) |
3 |
– |
– |
3 |
4 | – | – | 4 | ||||||||||||||||||||||||||||
| Impaired |
– |
– |
138 |
138 |
– | – | 109 | 109 | ||||||||||||||||||||||||||||
| Total |
$ |
10,188 |
$ |
2,343 |
$ |
138 |
$ |
12,669 |
$ |
10,423 | $ |
1,471 | $ |
109 | $ |
12,003 | ||||||||||||||||||||
| Undrawn loan commitments – Retail |
||||||||||||||||||||||||||||||||||||
| Low risk |
$ |
247,620 |
$ |
1,041 |
$ |
– |
$ |
248,661 |
$ | 229,516 | $ | 574 | $ | – | $ | 230,090 | ||||||||||||||||||||
| Medium risk |
9,021 |
246 |
– |
9,267 |
9,475 | 133 | – | 9,608 | ||||||||||||||||||||||||||||
| High risk |
876 |
367 |
– |
1,243 |
1,205 | 97 | – | 1,302 | ||||||||||||||||||||||||||||
| Not rated (2) |
5,668 |
118 |
– |
5,786 |
4,854 | 90 | – | 4,944 | ||||||||||||||||||||||||||||
| Total |
$ |
263,185 |
$ |
1,772 |
$ |
– |
$ |
264,957 |
$ |
245,050 | $ |
894 | $ |
– | $ |
245,944 | ||||||||||||||||||||
| Wholesale – Loans outstanding |
||||||||||||||||||||||||||||||||||||
| Investment grade |
$ |
88,513 |
$ |
202 |
$ |
– |
$ |
88,715 |
$ | 62,975 | $ | 226 | $ | – | $ | 63,201 | ||||||||||||||||||||
| Non-investment grade |
145,908 |
15,758 |
– |
161,666 |
117,396 | 15,146 | – | 132,542 | ||||||||||||||||||||||||||||
| Not rated (2) |
11,789 |
360 |
– |
12,149 |
9,339 | 430 | – | 9,769 | ||||||||||||||||||||||||||||
| Impaired |
– |
– |
1,301 |
1,301 |
– | – | 1,357 | 1,357 | ||||||||||||||||||||||||||||
246,210 |
16,320 |
1,301 |
263,831 |
189,710 | 15,802 | 1,357 | 206,869 | |||||||||||||||||||||||||||||
| Items not subject to impairment (3) |
10,136 |
11,197 | ||||||||||||||||||||||||||||||||||
| Total |
$ |
273,967 |
$ |
218,066 | ||||||||||||||||||||||||||||||||
| Undrawn loan commitments – Wholesale |
||||||||||||||||||||||||||||||||||||
| Investment grade |
$ |
284,481 |
$ |
179 |
$ |
– |
$ |
284,660 |
$ | 246,539 | $ | 1,122 | $ | – | $ | 247,661 | ||||||||||||||||||||
| Non-investment grade |
126,225 |
10,657 |
– |
136,882 |
108,063 | 12,377 | – | 120,440 | ||||||||||||||||||||||||||||
| Not rated (2) |
3,692 |
1 |
– |
3,693 |
3,476 | 1 | – | 3,477 | ||||||||||||||||||||||||||||
| Total |
$ |
414,398 |
$ |
10,837 |
$ |
– |
$ |
425,235 |
$ |
358,078 | $ |
13,500 | $ |
– | $ |
371,578 | ||||||||||||||||||||
| (1) | As at October 31, 2022, |
| (2) | In certain cases where an internal risk rating is not assigned, we use other approved credit risk assessments or rating methodologies, policies and tools to manage our credit risk. |
| (3) | Items not subject to impairment are loans held at FVTPL. |
Loans past due but not impaired
(1), (2)
As at |
||||||||||||||||||||||||||
October 31, 2022 |
October 31, 2021 |
|||||||||||||||||||||||||
(Millions of Canadian dollars) |
30 to 89 days |
90 days and greater |
Total |
30 to 89 days |
90 days and greater |
Total |
||||||||||||||||||||
| Retail |
$ |
1,328 |
$ |
168 |
$ |
1,496 |
$ |
1,105 |
$ |
137 |
$ |
1,242 |
||||||||||||||
| Wholesale |
1,279 |
2 |
1,281 |
1,230 |
– |
1,230 |
||||||||||||||||||||
$ |
2,607 |
$ |
170 |
$ |
2,777 |
$ |
2,335 |
$ |
137 |
$ |
2,472 |
|||||||||||||||
| (1) | Excludes loans less than 30 days past due as they are not generally representative of the borrowers’ ability to meet their payment obligations. |
| (2) | Amounts presented may include loans past due as a result of administrative processes, such as mortgage loans on which payments are restrained pending payout due to sale or refinancing. Past due loans arising from administrative processes are not representative of the borrowers’ ability to meet their payment obligations. |