MANAGEMENT'S DISCUSSION AND ANALYSIS
OF FINANCIAL POSITION AND RESULTS OF OPERATIONS
Third Quarter Ended September 30, 2022
INDEX
| | | | | |
| Introduction | |
About IAMGOLD | |
| Highlights — Third Quarter 2022 | |
| Operating and Financial Results | |
| Outlook | |
| Environmental, Social and Governance | |
| |
| Quarterly Updates | |
| |
| Operating and Financial Performance | |
| West Africa | |
| North America | |
| South America | |
| |
| |
| |
| Exploration | |
| |
| Financial Condition | |
| |
| Liquidity and Capital Resources | |
| Cash Flow | |
| Market Trends | |
| Market Risk | |
| |
| Shareholders’ Equity | |
| Quarterly Financial Review | |
| Disclosure Controls and Procedures and Internal Control over Financial Reporting | |
| Critical Judgments, Estimates and Assumptions | |
| |
| New Accounting Standards | |
| Risks and Uncertainties | |
| Non-GAAP Financial Measures | |
| Cautionary Statement on Forward-Looking Information | |
| | | | | |
IAMGOLD CORPORATION Third Quarter 2022 Management’s Discussion and Analysis | 1 |
INTRODUCTION
The following Management’s Discussion and Analysis (“MD&A”) of IAMGOLD Corporation (“IAMGOLD” or the “Company”), dated November 8, 2022, is intended to supplement and complement the unaudited condensed consolidated interim financial statements and notes thereto as at and for the three and nine months ended September 30, 2022 ("consolidated interim financial statements"). This MD&A should be read in conjunction with IAMGOLD's audited annual consolidated financial statements and related notes as at and for the fiscal year ended December 31, 2021 and the related MD&A included in the 2021 annual report. All figures in this MD&A are in U.S. dollars and tabular dollar amounts are in millions, unless stated otherwise. Additional information on IAMGOLD can be found at www.iamgold.com. The information on the website is not in any way incorporated in or made a part of this MD&A.
ABOUT IAMGOLD
IAMGOLD is a mid-tier gold mining company operating in North America, South America and West Africa. The Company has three operating mines: Essakane (Burkina Faso), Rosebel (Suriname) and Westwood (Canada) and is building the large-scale, long life Côté Gold project (“Côté Gold”) (Canada) which is expected to start production in the beginning of 2024. In addition, the Company has a robust development and exploration portfolio within high potential mining districts in the Americas and West Africa. On October 18, 2022, IAMGOLD entered into a definitive agreement to sell its interests in Rosebel (see below for further details).
IAMGOLD employs approximately 5,000 people and is committed to maintaining its culture of accountable mining through high standards of Environmental, Social and Governance ("ESG") practices, including its commitment to Zero Harm®, in every aspect of its business. IAMGOLD is listed on the New York Stock Exchange (NYSE:IAG) and the Toronto Stock Exchange (TSX:IMG) and is one of the companies on the JSI index1.
HIGHLIGHTS - THIRD QUARTER 2022
•Attributable gold production of 184,000 ounces in the third quarter and 528,000 ounces year-to-date (“YTD”) as a result of continued strong performance from Essakane and improvements at Rosebel.
•The Company expects that annual production will exceed the top end of the previous guidance range of 570,000 to 640,000 ounces and is revising guidance upwards to 650,000 to 705,000 ounces.
•Cost of sales per ounce sold of $1,140 ($1,102 YTD), cash cost2 per ounce sold of $1,126 ($1,087 YTD) and all-in sustaining costs2 ("AISC") of $1,559 ($1,550 YTD).
•The Company expects AISC2 to be below the bottom end of guidance range of $1,650 to $1,690 and revised guidance downwards to between $1,600 and $1,650 per ounce sold. Cash costs2 guidance for 2022 is revised downwards to be between $1,100 and $1,130 per ounce sold from the previous guidance range of $1,100 to $1,150 per ounce.
•Gold revenues of $343.3 million in the third quarter from sales of 203,000 ounces (187,000 ounces on an attributable basis) at an average realized gold price of $1,690 per ounce and $1,033.9 million YTD from sales of 584,000 ounces (538,000 ounces on an attributable basis) at an average realized gold price of $1,766 per ounce.
•Earnings before interest, income taxes, depreciation and amortization (“EBITDA”)2 of $(41.3) million ($195.0 million YTD) and adjusted EBITDA2 of $103.1 million ($350.6 million YTD).
•Mine-site free cash flow2 of $59.2 million ($189.3 million YTD).
•Net loss and adjusted net loss per share attributable to equity holders2 of $(0.23) and $(0.03), respectively; YTD net earnings (loss) and adjusted net earnings (loss) per share attributable to equity holders2 of $(0.20) and $0.01, respectively.
•Cash, cash equivalents and short-term investments of $536.1 million and liquidity2 of $636.8 million at September 30, 2022.
•As of September 30, 2022, the Côté Gold project was approximately 64.2% complete, with detailed engineering fully complete and construction in line with the updated technical report. The Company's share of remaining project spend to bring Côté Gold into production is estimated to be between $1.0 and $1.1 billion from October 1, 2022, net of leases and working capital.
•On October 18, 2022, the Company announced that it had entered into a definitive agreement with Zijin Mining Group Co. Ltd. to sell its interests in the Rosebel mine for cash consideration of $360 million plus working capital adjustments, as well as the release of approximately $41 million of IAMGOLD obligations related to equipment leases, on closing. The transaction is expected to close in the first quarter 2023 or earlier. It is subject to certain regulatory approvals, including approvals from the relevant authorities of the People’s Republic of China, the Government of Suriname, and other customary closing conditions. An after-tax non-cash impairment charge of $74.0 million ($115.8 million before tax) was recorded to align the carrying value of the Rosebel cash generating unit with the purchase price.
•The Company is actively pursuing various alternatives to increase its liquidity and capital resources to advance and complete construction of the Côté Gold project on the updated schedule. See “Liquidity and Capital Resources - Liquidity Outlook”.
______________________________
1.Jantzi Social Index (“JSI”). The JSI is a socially screened market capitalization-weighted common stock index modeled on the S&P/TSX 60. It consists of companies which meet a set of broadly based environmental, social and governance rating criteria.
2.This is a non-GAAP financial measure. See "Non-GAAP Financial Measures".
| | | | | |
IAMGOLD CORPORATION Third Quarter 2022 Management’s Discussion and Analysis | 2 |
OPERATING AND FINANCIAL RESULTS For more details and the Company's overall outlook for 2022, see "Outlook", and for individual mines and projects performance, see "Quarterly Updates". The following table summarizes certain operating and financial results for the three months ended September 30, 2022 (Q3 2022), June 30, 2022 (Q2 2022) and September 30, 2021 (Q3 2021) and the nine months ended September 30 (or YTD), 2022 and 2021 and certain measures of the Company's financial position as at September 30, 2022, June 30, 2022 and December 31, 2021.
| | | | | | | | | | | | | | | | | | |
| | | |
| | | | | | |
| Q3 2022 | Q2 2022 | Q3 2021 | YTD 2022 | YTD 2021 | |
| Key Operating Statistics | | | | | | |
| Gold production – attributable (000s oz) | 184 | | 170 | | 153 | | 528 | | 448 | | |
| Gold sales – attributable (000s oz) | 187 | | 170 | | 150 | | 538 | | 438 | | |
| | | | | | |
| | | | | | |
Average realized gold price1 ($/oz) | $ | 1,690 | | $ | 1,799 | | $ | 1,787 | | $ | 1,766 | | $ | 1,788 | | |
Cost of sales2 ($/oz sold) – attributable | $ | 1,140 | | $ | 1,130 | | $ | 1,247 | | $ | 1,102 | | $ | 1,157 | | |
Cash costs3 ($/oz sold) – attributable | $ | 1,126 | | $ | 1,119 | | $ | 1,245 | | $ | 1,087 | | $ | 1,155 | | |
AISC3 ($/oz sold) – attributable | $ | 1,559 | | $ | 1,604 | | $ | 1,508 | | $ | 1,550 | | $ | 1,387 | | |
| | | | | | |
Financial Results ($ millions, except where noted) | | | | | | |
| Revenues | $ | 343.3 | | $ | 334.0 | | $ | 294.1 | | $ | 1,033.9 | | $ | 857.1 | | |
| Gross profit | $ | 29.7 | | $ | 49.4 | | $ | 6.9 | | $ | 160.1 | | $ | 79.0 | | |
| | | | | | |
| | | | | | |
EBITDA3 | $ | (41.3) | | $ | 101.4 | | $ | 19.6 | | $ | 195.0 | | $ | 220.5 | | |
Adjusted EBITDA3 | $ | 103.1 | | $ | 110.0 | | $ | 82.5 | | $ | 350.6 | | $ | 265.7 | | |
| Net loss attributable to equity holders | $ | (108.3) | | $ | (9.6) | | $ | (75.3) | | $ | (94.1) | | $ | (60.3) | | |
Adjusted net earnings (loss) attributable to equity holders3 | $ | (13.7) | | $ | (6.3) | | $ | (20.1) | | $ | 6.1 | | $ | (17.5) | | |
| Net loss per share attributable to equity holders | $ | (0.23) | | $ | (0.02) | | $ | (0.16) | | $ | (0.20) | | $ | (0.13) | | |
| | | | | | |
| | | | | | |
| | | | | | |
Adjusted net earnings (loss) per share attributable to equity holders3 | $ | (0.03) | | $ | (0.01) | | $ | (0.04) | | $ | 0.01 | | $ | (0.04) | | |
Net cash from operating activities before changes in working capital3 | $ | 108.8 | | $ | 93.9 | | $ | 79.6 | | $ | 336.6 | | $ | 217.0 | | |
| Net cash from operating activities | $ | 117.7 | | $ | 81.9 | | $ | 78.5 | | $ | 341.9 | | $ | 217.5 | | |
| | | | | | |
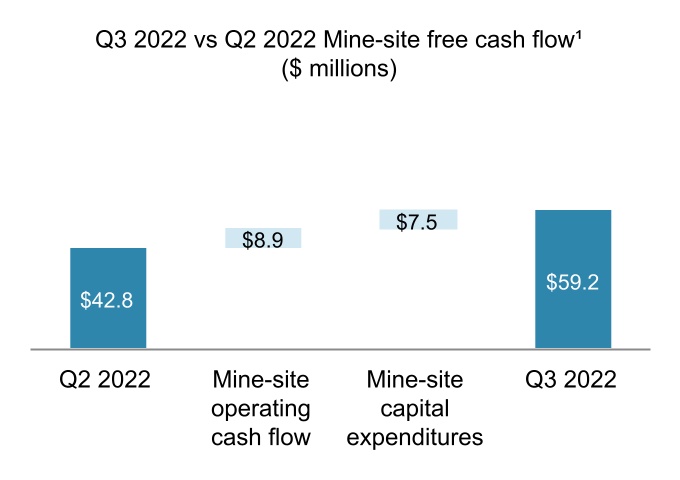
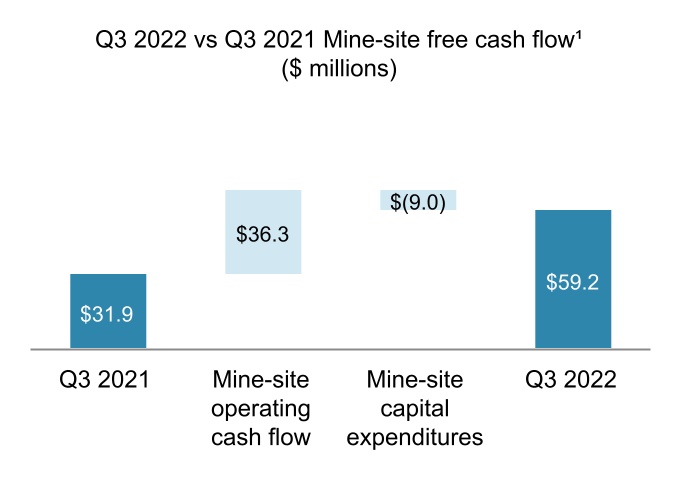
Mine-site free cash flow3 | $ | 59.2 | | $ | 42.8 | | $ | 31.9 | | $ | 189.3 | | $ | 121.6 | | |
Capital expenditures3,4,5 – sustaining | $ | 71.1 | | $ | 67.1 | | $ | 26.4 | | $ | 214.8 | | $ | 64.0 | | |
Capital expenditures3,4,5 – expansion | $ | 158.9 | | $ | 189.0 | | $ | 113.0 | | $ | 440.0 | | $ | 330.2 | | |
| | | | | | |
| | | | | | |
| | | | | | |
| | | | | | |
| | | | | | |
| | | | | | |
| | | | | | |
| | | | | | |
| | | | | | |
| | | | | | |
| September 30 | June 30 | December 31 | September 30 | December 31 | |
| 2022 | 2022 | 2021 | 2022 | 2021 | |
| Financial Position ($ millions) | | | | | | |
| Cash, cash equivalents and short-term investments | $ | 536.1 | | $ | 452.9 | | $ | 552.5 | | $ | 536.1 | | $ | 552.5 | | |
| Long-term debt | $ | 844.6 | | $ | 612.0 | | $ | 464.4 | | $ | 844.6 | | $ | 464.4 | | |
Net cash (debt)3 | $ | (409.3) | | $ | (225.1) | | $ | 16.3 | | $ | (409.3) | | $ | 16.3 | | |
| Available credit facility | $ | 100.7 | | $ | 348.7 | | $ | 498.3 | | $ | 100.7 | | $ | 498.3 | | |
| | | | | | |
| | | | | | |
| | | | | | |
1.The average realized gold price in the third quarter 2022 excluding the impact of the 2019 Prepay Arrangement (as defined below) was $1,735, (second quarter 2022 - $1,873) and YTD 2022 $1,829.
2.Throughout this MD&A, cost of sales, excluding depreciation, is disclosed in the cost of sales note in the consolidated interim financial statements.
3.Throughout this MD&A, the Company uses the terms average realized gold price per ounce sold, cash costs, cash costs per ounce sold, AISC, AISC per ounce sold, net cash from operating activities before changes in working capital, mine-site free cash flow, liquidity, net cash (debt), EBITDA, adjusted EBITDA, adjusted net earnings (loss) attributable to equity holders and adjusted net earnings (loss) per share attributable to equity holders, sustaining capital expenditures and expansion capital expenditures all of which are non-GAAP financial measures with no standard meaning under International Financial Reporting Standards ("IFRS") and are further discussed in the "Non-GAAP Financial Measures" section.
4.Throughout this MD&A, capital expenditures represent cash expenditures for property, plant and equipment and exploration and evaluation assets.
5.Starting in 2022, a higher portion of stripping costs are categorized as sustaining capital versus expansion capital, due to the particular areas that are scheduled to be mined and the stage of the life of mine aligning with World Gold Council guidelines. See "Non-GAAP Financial Measures" section.
| | | | | |
IAMGOLD CORPORATION Third Quarter 2022 Management’s Discussion and Analysis | 3 |
Summary of Financial and Operating Results
| | | | | | | | |
| Contributors to Change | | Q3 2022 vs. Q2 2022 |
| Financial | | |
| Revenues | r | $343.3 million, up $9.3 million or 3%, primarily due to higher sales volumes at Essakane and Westwood as a result of higher production and timing of sales ($32.7 million and $6.9 million, respectively), partially offset by a lower average realized gold price ($23.6 million or $109 per ounce sold) and lower sales volume at Rosebel as a result of timing of sales ($6.3 million). Included in the quarter is the impact of the lower revenues recognized from the $1,500 per ounce collar included in the 2019 Prepay Arrangement ($9.1 million or $45 per ounce sold). |
| Cost of sales | r | $313.6 million, up $29.0 million or 10%. Excluding the non-cash net realizable value (“NRV”) write-down of ore stockpile and finished goods inventories, cost of sales is higher, primarily due to higher operating costs, as a result of higher operating waste stripping volumes, ongoing cost pressures and higher depreciation (see below) and an increase in ounces produced and sold. The NRV write-down during the quarter was $4.0 million (second quarter 2022 - $5.2 million) and is associated with Rosebel and Westwood. |
| | |
Depreciation expense (included in cost of sales) | r | $84.3 million, up $6.2 million or 8%, primarily due to higher depreciation at Essakane ($7.0 million), partially offset by lower depreciation at Westwood ($0.6 million). |
| General and administrative expenses | s | $11.8 million, down $5.4 million or 31%, primarily due to lower severance and salaries costs ($2.8 million), legal and consulting costs associated with changes in the Company's board of directors ($2.4 million) and other consulting costs ($0.4 million) occurring in the second quarter, partially offset by higher share-based payments ($0.2 million). |
| Exploration expenses | s | $5.6 million, down $3.7 million, primarily due to reductions in drilling activity. |
| Other income (expense) | r | $2.3 million, up $0.9 million. |
| Income tax (recovery) expense | s | ($19.2) million, down $44.3 million, comprised of current income tax expense of $14.6 million (second quarter 2022 - $27.7 million) and deferred income tax recovery of $33.8 million (second quarter 2022 - recovery of $2.6 million). The higher current income tax expense in the second quarter primarily reflected withholding taxes paid in respect of dividends from Essakane and other foreign subsidiaries during that quarter. |
| | |
| | |
| | |
| Net cash from operating activities before changes in working capital | r | $108.8 million, up $14.9 million, primarily due to the factors noted below. |
| Net cash from operating activities | r | $117.7 million, up $35.8 million, primarily due to a decrease in income taxes paid ($22.4 million) and a net inflow in non-cash working capital movements ($20.9 million), partially offset by lower net cash earnings ($5.2 million) and lower settlement of derivatives ($1.7 million).
|
| Mine-site free cash flow | r | $59.2 million, up $16.4 million, from the prior quarter, primarily due to higher free cash flow at Essakane ($20.2 million) and Westwood ($9.2 million) due to higher sales volume, partially offset by lower free cash flow at Rosebel ($13.0 million) primarily due to changes in working capital and lower average realized gold price. |
| | |
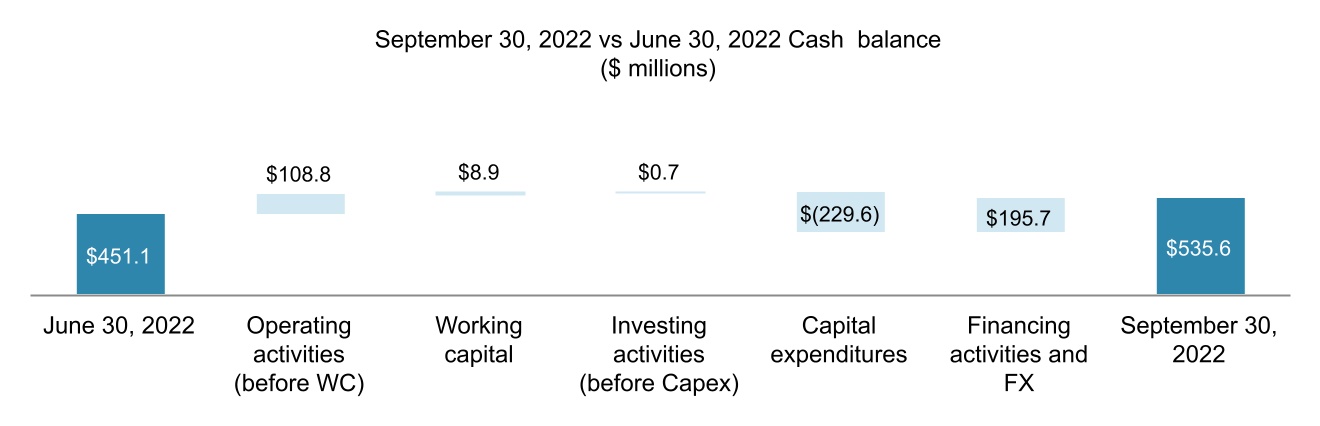
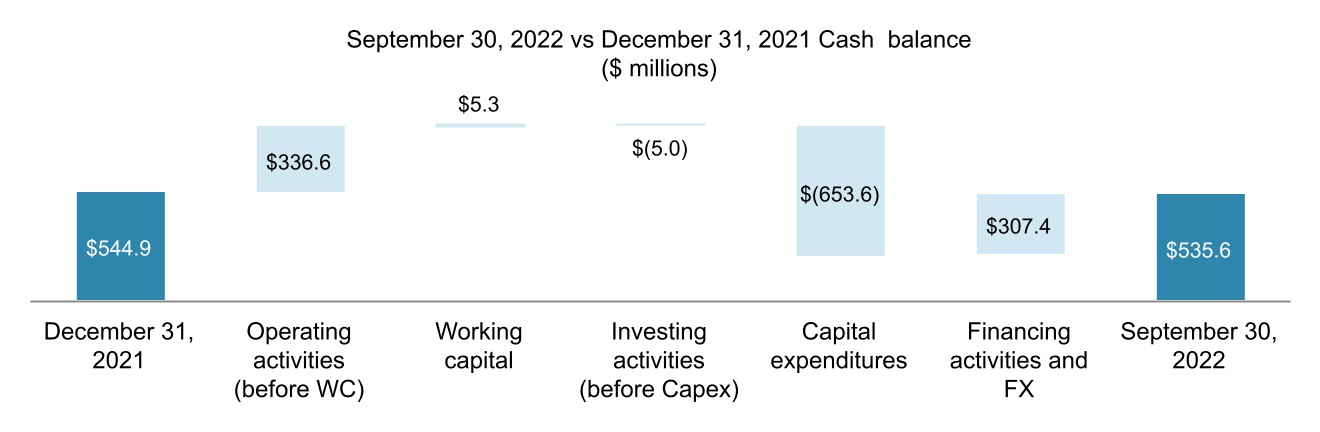
| Cash, cash equivalents, short-term investments and restricted cash | r | $583.3 million comprised of cash and cash equivalents of $535.6 million, short-term investments of $0.5 million and restricted cash of $47.2 million, up $91.5 million from June 30, 2022, and down $11.4 million from December 31, 2021. |
| Operating | | |
| Attributable gold production | r | 184,000 ounces, up 14,000 ounces or 8%, primarily due to higher production at Essakane (8,000 ounces) due to higher throughput, and Westwood (5,000 ounces) due to higher grade from the underground mine. |
| Attributable gold sales | r | 187,000 ounces, up 17,000 ounces or 10%, due to higher production and timing of sales at Essakane (16,000 ounces) and higher production at Westwood (4,000 ounces), partially offset by timing of sales at Rosebel (3,000 ounces). |
Capital expenditures – capitalized stripping (included in capital expenditures – sustaining and expansion) | r | $38.0 million, up $2.2 million or 6%, primarily due to higher capitalized stripping activities at Essakane. In the third quarter 2022, $34.2 million of capitalized stripping expenditures were categorized as sustaining capital (second quarter 2022 - $24.5 million) and $3.8 million were categorized as expansion capital (second quarter 2022 - $11.3 million). |
| | |
| | | | | |
IAMGOLD CORPORATION Third Quarter 2022 Management’s Discussion and Analysis | 4 |
| | | | | | | | |
| Contributors to Change | | Q3 2022 vs. Q2 2022 |
| Operating | | |
| | |
| | | | | | | | |
| | |
| | |
| | |
| | |
| | |
| | |
| | |
| | |
| | |
| | |
| | |
| | |
| | |
| | |
| | |
| | |
| | |
| | |
| | |
| | |
| | |
| | |
| | |
| | |
| | |
| | |
| | |
| | |
| | |
| | |
| | |
| | |
| | |
| | |
| | |
| | |
| | |
| | |
| | |
| | |
| | |
| Capital expenditures – sustaining | r | $71.1 million, up $4.0 million or 6%. Sustaining capitalized stripping expenditures were higher by $9.7 million and other sustaining capital expenditures were lower by $5.7 million, primarily due to lower spending at Rosebel ($9.2 million) related to timing of capital projects, partially offset by higher spending at Essakane ($5.1 million) due to the commissioning of replacement equipment in the quarter. |
| Capital expenditures – expansion | s | $158.9 million, down $30.1 million or 16%. Expansion capitalized stripping expenditures were lower by $7.5 million and other expansion capital expenditures were lower by $22.6 million, primarily due to lower expenditures at Côté Gold which includes $14.6 million of sale-leaseback proceeds, and Rosebel of $4.5 million. |
Cost of sales (excluding depreciation) per ounce sold | r | $1,140, up $10 or 1%, from $1,130 per ounce sold. Production costs per ounce sold were in line with the prior quarter with higher costs being offset by higher production. Included was the positive impact of realized derivative gains of $40 per ounce sold (second quarter 2022 - gains of $64 per ounce sold). |
| Cash costs per ounce sold | r | $1,126, up $7 or 1% from $1,119 per ounce sold. Cash costs per ounce sold were higher due to higher cost of sales per ounce, partially offset by the exclusion of the long term NRV adjustment that is included in cost of sales. |
| AISC per ounce sold | s | $1,559, down $45 or 3%, from $1,604 per ounce sold, primarily due higher sales volume and a decrease in general administrative expenses as described above. |
| Contributors to change | | Q3 2022 vs. Q3 2021 |
| Financial | | |
| Revenues | r | $343.3 million, up $49.2 million or 17%, primarily due to higher sales volume at Rosebel ($27.4 million) and higher production at Essakane ($21.7 million) and Westwood ($19.5 million), partially offset by a lower realized gold price ($19.6 million or $98 per ounce sold). Included in the third quarter 2022 is the impact of lower revenues recognized from the $1,500 per ounce collar included in the 2019 Prepay Arrangement ($9.1 million or $45 per ounce sold) |
| Cost of sales | r | $313.6 million, up $26.4 million or 9%. Cost of sales is higher primarily due to higher operating costs, production and sales volume. The NRV write-down this quarter was $4.0 million as noted above (third quarter 2021 - $16.2 million). |
| | |
| | |
Depreciation expense (included in cost of sales) | s | $84.3 million, down $0.8 million, primarily due to lower depreciation at Rosebel resulting from the 2021 impairment charge ($5.0 million), partially offset by higher depreciation of capitalized stripping assets at Essakane ($4.1 million). |
| General and administrative expenses | s | $11.8 million, down $1.8 million or 13%, primarily due to lower salaries ($0.8 million), consulting costs ($0.7 million) and share-based payments ($0.5 million), partially offset by lower realized gains on cash flow hedges ($0.5 million). |
| Exploration expenses | s | $5.6 million, down $4.4 million due to a reduction in planned exploration expenditures during 2022. |
| Other income (expense) | r | $2.3 million, up $48.3 million, primarily due to changes in the Doyon asset retirement obligation ($43.9 million). |
| Income tax (recovery) expense | s | ($19.2) million, down $21.6 million, comprised of current income tax expense of $14.6 million (third quarter 2021 - $12.3 million) and deferred income tax recovery of $33.8 million (third quarter 2021 - recovery of $9.9 million). |
| Net cash from operating activities before changes in working capital | r | $108.8 million, up $29.2 million, primarily due to the factors noted below. |
| Net cash from operating activities | r | $117.7 million, up $39.2 million, primarily due to proceeds from the 2022 Prepay Arrangements ($59.0 million), and an increase in movements in non-cash working capital items and non-current ore stockpiles ($10.0 million), partially offset by a lower net cash earnings ($24.7 million) and lower proceeds from insurance claim ($7.7 million). |
| Mine-site free cash flow | r | $59.2 million, up $27.3 million, primarily due to higher free cash flow at Essakane ($18.7 million) and Westwood ($7.9 million) due to higher sales volume and changes in working capital, partially offset by lower average realized gold price and the impact of inflation. Free cash flow at Rosebel ($0.7 million) was in line with the same prior year period. |
| | |
| | |
| | |
| | |
| | |
| | | | | |
IAMGOLD CORPORATION Third Quarter 2022 Management’s Discussion and Analysis | 5 |
| | | | | | | | |
| | |
| | |
| | |
| | |
| | |
| | |
| | |
| | |
| | |
| | |
| | |
| | |
| | |
| | |
| | |
| | |
| | |
| | |
| | |
| | |
| | |
| | |
| | |
| | |
| | |
| | |
| | |
| | |
| | |
| | |
| | |
| Contributors to change | | Q3 2022 vs. Q3 2021 |
| Operating | | |
| Attributable gold production | r | 184,000 ounces, up 31,000 ounces or 20%, due to higher production at Westwood (12,000 ounces) as the underground operations continue ramping up after being in care and maintenance in the first half of 2021, Rosebel (10,000 ounces) and Essakane (9,000 ounces) both resulting from higher head grade and recoveries, partially offset by lower throughput. |
| Attributable gold sales | r | 187,000 ounces, up 37,000 ounces or 25%, due to higher production and timing of sales at Rosebel (15,000 ounces) and Essakane (11,000 ounces) and higher production at Westwood (11,000 ounces). |
Capital expenditures – capitalized stripping (included in capital expenditures – sustaining and expansion) | r | $38.0 million, up $6.8 million or 22%, due to higher capitalized stripping activities at Rosebel ($11.0 million) to support future production plans, partially offset by lower capitalized stripping at Essakane ($4.2 million). In the third quarter 2022, $34.2 million of capitalized stripping expenditures were categorized as sustaining capital (third quarter 2021 - $1.0 million) and $3.8 million were categorized as expansion capital (third quarter 2021 - $30.2 million). |
| Capital expenditures – sustaining | r | $71.1 million, up $44.7 million or 169%. Sustaining capitalized stripping activities were higher by $33.2 million and other sustaining capital expenditures were higher by $11.5 million, primarily due to higher spending at Essakane ($8.4 million) related to timing of capital projects and Westwood ($2.6 million) as underground operations were ramping after being in care and maintenance in the first half of 2021. |
| Capital expenditures – expansion | r | $158.9 million, up $45.9 million or 41%. Expansion capitalized stripping expenditures were lower by $26.4 million and other expansion capital expenditures were higher by $72.3 million, primarily due to higher spending at Côté Gold resulting from an increase in construction activities ($84.2 million), partially offset by lower spending at Rosebel ($5.5 million), Essakane ($4.4 million) and Boto Gold ($2.7 million). |
| | |
Cost of sales (excluding depreciation) per ounce sold
| s | $1,140, down $107 or 9%, from $1,247 per ounce sold. Excluding depreciation, cost of sales per ounce sold was lower primarily due to higher production and sales volume at Essakane, Rosebel and Westwood and a lower NRV write-down, partially offset by higher production costs. |
| | |
| | |
| Cash costs per ounce sold | s | $1,126, down $119 or 10%, from $1,245 per ounce sold. Cash costs per ounce sold were lower due to lower cost of sales per ounce sold noted above and a lower NRV write-down, partially offset by higher production costs. |
| AISC per ounce sold | r | $1,559, up $51 or 3%, from $1,508, primarily due to higher sustaining capital expenditures, partially offset by lower cash costs per ounce sold noted above. |
Global COVID-19 PandemicThe global COVID-19 pandemic continues to evolve and the management thereof remains a focus for the business. See "Operational Updates" for more information on each site. The Company continues to closely monitor developments and is taking necessary measures to manage the impact of the COVID-19 pandemic on its personnel, operations, construction and development projects and exploration activities. COVID-19 detection and mitigation protocols at our sites are reviewed on an ongoing basis to adapt to the evolving situation.
OUTLOOK
Operating Performance
| | | | | | | | | | | | |
| | | | |
| Actual YTD 2022 | Updated Full Year Guidance 20221 | Previous Full Year Guidance 20222 | |
| Essakane (000s oz) | 334 | | 410 – 430 | 360 – 385 | |
| Rosebel (000s oz) | 145 | | 175 – 200 | 155 – 180 | |
| Westwood (000s oz) | 49 | | 65 – 75 | 55 – 75 | |
| | | | |
| | | | |
Total attributable production (000s oz)3 | 528 | | 650 – 705 | 570 – 640 | |
| | | | |
Cost of sales3 ($/oz sold) | $ | 1,102 | | $1,100 – $1,130 | $1,100 – $1,150 | |
| | | | |
Cash costs3,4 ($/oz sold) | $ | 1,087 | | $1,100 – $1,130 | $1,100 – $1,150 | |
| | | | |
AISC3,4 ($/oz sold) | $ | 1,550 | | $1,600 – $1,650 | $1,650 – $1,690 | |
Depreciation expense5 ($ millions) | $ | 237.4 | | $305 – $315 | $280 – $290 | |
| Income taxes paid | $ | 59.0 | | $69 – $79 | $69 – $79 | |
| | | | |
| | | | |
| | | | |
| | | | |
| | | | |
1.The updated full year guidance is based on the following 2022 full year assumptions, before the impact of hedging: average realized gold price of $1,792 per ounce, USDCAD exchange rate of 1.30, EURUSD exchange rate of 1.04 and average crude oil price of $100 per barrel.
2.The previous full year guidance is based on the following 2022 full year assumptions, before the impact of hedging: average realized gold price of $1,700 per ounce, USDCAD exchange rate of 1.25, EURUSD exchange rate of 1.20 and average crude oil price of $70 per barrel.
3.Consists of Essakane, Rosebel and Westwood on an attributable basis of 90%, 95% and 100%, respectively.
4.This is a non-GAAP financial measure. See "Non-GAAP Financial Measures".
5.The updated full year depreciation expense guidance includes an estimated $12 million of depreciation in the fourth quarter at Rosebel. Effective October 18, 2022, the Rosebel mine will be accounted for as held for sale, and its operating results will be reported as discontinued operations.
| | | | | |
IAMGOLD CORPORATION Third Quarter 2022 Management’s Discussion and Analysis | 6 |
Production Outlook
The Company expects that annual attributable production will exceed the top end of the previous guidance range of 570,000 to 640,000 ounces due to stronger operating performance, particularly at Essakane, and is revising guidance upwards to 650,000 to 705,000 ounces.
Costs Outlook
Cash costs guidance for 2022 has been revised downwards to $1,100 and $1,130 per ounce sold and AISC guidance is revised downwards with costs expected to be between $1,600 and $1,650 per ounce sold, largely reflecting the higher sales expected for the full year, partially offset with higher costs from inflation. The estimates issued in January 2022 included an inflation assumption of 5% to 7% on key consumables, translating to an increase of 1% to 2% in cash costs and AISC (reflected in the previous guidance figures). During the first nine months of the year, higher production offset the additional cost pressures from systemic inflation, constrained global supply chains and the sanctions on trade with Russia that increased the average cost of key consumables such as oil, ammonium nitrate, grinding media, lime and cyanide. The impact of the above-mentioned cost pressures stabilized during the third quarter of 2022 when compared to the first six months of the year. The Company continues to work with its supply chain and seek alternatives to mitigate ongoing costs pressures, including the sourcing of appropriate alternatives as well as progressing productivity initiatives at its operations through the IAMALLIN operational improvement program. Increases in oil prices have been partially mitigated by the existing oil hedge program, see “Market Risk”. For reference, excluding the impact of the Company’s hedging program, a $10/bbl increase in the oil price would translate to a $15 per ounce increase in cash costs; however, with current hedges in place, the same movement would equate to a $6 per ounce increase in cash costs. The Company notes that continued external cost pressures may result in an increase in costs and capital expenditures.
Income Taxes Paid
Income taxes paid guidance for 2022 is reaffirmed between $69 and $79 million.
Depreciation Expense
Depreciation expense guidance for 2022 is expected to be in the range of $305 and $315 million, reflecting higher YTD 2022 production and sales at Essakane. The updated full year depreciation expense guidance includes an estimated $12 million of depreciation in the fourth quarter at Rosebel. Effective October 18, 2022, the Rosebel mine will be accounted for as held for sale, and its operating results will be reported as discontinued operations.
Capital Expenditures1
| | | | | | | | | | | | | | | | | | | | | | | | | | | | | | | |
| | | | | |
| Actual YTD 2022 | Updated Full Year Guidance 2022 | Previous Full Year Guidance 2022 |
| ($ millions) | Sustaining2 | Expansion3 | Total | Sustaining2 | Expansion3 | Total | Sustaining2 | Expansion3 | Total | | |
| | | | | | | | | | | |
| Essakane | $ | 116.4 | | $ | 2.5 | | $ | 118.9 | | $ | 175 | | $ | 5 | | $ | 180 | | $ | 165 | | $ | 5 | | $ | 170 | | | |
Rosebel4 | 75.0 | | 23.4 | | 98.4 | | 105 | | 30 | | 135 | | 105 | | 35 | | 140 | | | |
| Westwood | 22.5 | | 2.7 | | 25.2 | | 30 | | 5 | | 35 | | 40 | | 10 | | 50 | | | |
| 213.9 | | 28.6 | | 242.5 | | 310 | | 40 | | 350 | | 310 | | 50 | | 360 | | | |
| | | | | | | | | | | |
| Boto Gold | — | | 11.8 | | 11.8 | | — | | 20 | | 20 | | — | | 20 | | 20 | | | |
| | | | | | | | | | | |
| Corporate | 0.9 | | — | | 0.9 | | — | | — | | — | | — | | — | | — | | | |
Total5,6,7,8 (±5%) | $ | 214.8 | | $ | 40.4 | | $ | 255.2 | | $ | 310 | | $ | 60 | | $ | 370 | | $ | 310 | | $ | 70 | | $ | 380 | | | |
1.100% basis, unless otherwise stated.
2.Sustaining capital includes capitalized stripping of (i) $18.6 million for Essakane and $15.6 million for Rosebel in Q3 2022 (ii) $65.7 million for Essakane and $35.4 million for Rosebel YTD 2022 and (iii) $110 million for Essakane and $45 million for Rosebel for both the revised and previous full year guidance. See "Outlook" sections below.
3.Expansion capital includes capitalized stripping of (i) $nil million for Essakane and $3.8 million for Rosebel in Q3 2022 (ii) $nil for Essakane and $18.6 million for Rosebel YTD 2022 and (iii) $nil for Essakane and $20 million for Rosebel for the both the revised and previous full year 2022 guidance. See "Outlook" sections below.
4.Rosebel includes Saramacca at 70%.
5.Includes $10 million of capitalized exploration and evaluation expenditures also included in the Exploration Outlook guidance table.
6.Capitalized borrowing costs are not included.
7.In addition to the above capital expenditures, $22 million in total principal lease payments are expected.
8.See "Costs Outlook" section above.
Exploration
| | | | | | | | | | | | | | | | | | | | |
| | | | | | |
| Actual YTD 2022 | Full Year Guidance 2022 |
| ($ millions) | Capitalized | Expensed | Total | Capitalized | Expensed | Total |
| Exploration projects – greenfield | $ | — | | $ | 19.5 | | $ | 19.5 | | $ | — | | $ | 21 | | $ | 21 | |
Exploration projects – brownfield1 | 5.2 | | 3.4 | | 8.6 | | 10 | | 4 | | 14 | |
| | | | | | |
| | | | | | |
| | | | | | |
| | | | | | |
| $ | 5.2 | | $ | 22.9 | | $ | 28.1 | | $ | 10 | | $ | 25 | | $ | 35 | |
1.Exploration projects - brownfield includes planned near-mine exploration and resource development of (i) $5.2 million YTD 2022, and (ii) $10 million for the full
year 2022 guidance.
| | | | | |
IAMGOLD CORPORATION Third Quarter 2022 Management’s Discussion and Analysis | 7 |
ENVIRONMENTAL, SOCIAL AND GOVERNANCE
The Company is committed to:
•Maintaining its culture of accountable mining through high standards of ESG practices; and
•The principle of Zero Harm®, in every aspect of its business, with particular emphasis on respecting the natural environment, building strong community partnerships and putting the health and safety of the Company's employees first.
The Company has implemented the Mining Association of Canada's Toward Sustainable Mining ("TSM") framework at all its operations and is working towards the implementation of the World Gold Council’s Responsible Gold Mining Principles with the year two annual report relating to this implementation released by the Company. ESG policies, systems and practices are embedded throughout the business and the Company reports annually on its ESG performance via its Global Reporting Initiative compliant Sustainability Report. As part of its accountability and reporting framework, the Company has also committed to report in accordance with the Task Force on Climate-Related Financial Disclosures ("TCFD") guidelines and expects to release its initial TCFD report by the end of 2022.
Environmental
The Company recognizes that mining activities are energy intensive and generate significant greenhouse gas emissions (“GHG”). In September 2021, the Company announced that it had set a global target of reaching net negative GHG emissions by no later than 2050. The Company also announced a target of achieving net positive biodiversity. Medium term targets will be set as part of the Company’s roadmap to achieve these global targets and will be issued by the end of 2022. An external review of the Company’s GHG emissions profile across all sites has been completed and a draft action plan of the Company’s global commitments is currently being reviewed by the Executive Leadership and the Board. The details of the roadmap will be published in the inaugural TCFD report in Q4 2022.
At Côté Gold, the Company received the Ontario Minister of the Environment, Conservation and Parks for a site visit. The Annual Federal and Provincial compliance reports have been filed with the relevant authorities.
At Rosebel, the Tailings Storage Facility 3 ("TSF3") Expansion Environmental and Social Impact Assessment ("ESIA") was completed and submitted to the authorities. A public disclosure meeting was conducted and comments from authorities received to update the ESIA. As part of TSM Water Stewardship protocol requirements, the study watershed and water use by Communities of Interest started in September. The site-wide water balance study is also ongoing and expected to be complete by the end of 2022. The Company also started analyzing a de-carbonization roadmap for the mine.
At Essakane, the Company continued working on the various studies and action plans required to gather all the information that will feed the mine’s knowledge base, which will be used to develop the integrated mine closure plan.
Social
Health and Safety
Health and safety is core to the Company’s relentless pursuit of its Zero Harm® vision. Through various programs, the Company continuously promotes a safe work environment and a wellness program at all sites. The DARTFR (days away, restricted, transferred duty frequency rate) was 0.27 (on YTD basis) at the end of the third quarter of 2022, tracking below the global annual target of 0.42, with a decreasing trend. The TRIFR (total recordable injuries frequency rate) was 0.72 (on YTD basis) at the end of the third quarter of 2022, tracking below the global annual target of 0.73, with a decreasing trend. Côté Gold has surpassed over 6.9 million hours with no lost time injuries to date. The operations have been increasing focus on situational awareness and preventative activities related to work tasks.
Social and Economic Development
The Company is continuously exploring opportunities for investing and partnering with communities impacted by its operations. At both Essakane and Rosebel, the Company has committed to establishing and seeding community funds. The bulk of the Company’s funding for community investment initiatives at these sites will flow through these dedicated community funds to ensure consistent funding on a year-to-year basis.
At Rosebel, the Company has committed to making an annual contribution of 0.25% of annual revenues to the Rosebel Community Fund, in addition to its existing in-kind royalty of 0.25% of gold and silver monthly production it contributes to the Suriname Environmental & Mining Foundation. In 2021, Rosebel contributed $0.9 million to the Rosebel Community Fund complementing the initial endowment of $2.5 million made by the Company in 2020. Rosebel updated its community investment strategy to further support the social and economic development of its local communities. The priority areas identified up to 2025 are public health, education, livelihood development and basic infrastructure. In Q3 2022, the construction of a Mourning Facility was completed in one of Rosebel's Communities of Interest. An agreement was signed with the traditional authority and entrepreneurs of the region to start a large-scale agricultural project and the Company committed $200,000 for this project: $100,000 will be invested in Q4 2022 and $100,000 in Q1 2023. Rosebel strongly believes in socio-economic development of the region to ensure a self-sustaining livelihood post mine closure. Rosebel completed the ESIA for the TSF3 expansion. As part of that process the public disclosure meeting was successfully completed with alignment and consent of the host communities for the project.
| | | | | |
IAMGOLD CORPORATION Third Quarter 2022 Management’s Discussion and Analysis | 8 |
At Essakane, the Company continued its participation in the Mining Fund for Local Development in Burkina Faso, a program established by the government, pursuant to which the Company committed to contribute 1% of its annual revenues. The contribution for the third quarter 2022 is estimated at $5.9 million and $7.9 million year-to-date from the mine. A session of the communal committee for Falagountou was held in September and concluded with the adoption of 17 projects for a total budget of $2.5 million. In parallel, Essakane continued its direct community investment initiatives, focusing on agricultural programs as well as the fight against malaria, tuberculosis and malnutrition, income generating activities supported through the mine’s Iron Fund and small business support through the mine’s local content strategy. Consultations with stakeholders are ongoing for the official launch in Q4 of the implementation of the 2-year partnership program with the United Nations Development Programme for the implementation of a local development initiative in favor of the communities of Falagountou, Markoye, Gorom-Gorom and Dori, fostering youth employment, reducing poverty, strengthening local infrastructure, and supporting capacity building in local governance.
The Company has continued to advance work on its previously announced partnership with Giants of Africa, a non-governmental organization founded by Masai Ujiri, President of the Toronto Raptors. After the first phase in 2021, two additional courts have been constructed this year by Giants of Africa in Burkina Faso and Senegal.
At Boto Gold, the construction of new houses for the resettlement of the Kouliminde village is progressing and expected to be completed in the first half of 2023. The Company also continued with its community development projects, focusing on health with the fight against malaria, access to water and income generating activities through agriculture and vegetable production.
At Côté Gold, several successful site visits were organized with various stakeholders and Indigenous groups including Fisheries and Oceans Canada, Impact Assessment Agency of Canada, Ministry of Natural Resources and Forestry, Ministry of the Environment, Conservation and Parks, Métis Nation of Ontario, Flying Post First Nation, and members of the local cottagers association.
Diversity, Equity and Inclusion
The Company unequivocally condemns inequity, discrimination and hatred in all its forms. One of the Company's values is to conduct itself with respect and to embrace diversity. The Company has established a Diversity, Equity and Inclusion ("DEI") Steering Committee and Employee Council groups to further enhance the Company's strong commitment to these important values through data collection, education, awareness and action planning at the enterprise level. The Company completed a diagnostic evaluation of its DEI status and the resulting findings and recommendations (global and site specific) are being rolled out across the Company to develop action plans. The Company is a sponsor of the Artemis Project, which aims to promote female business owners and entrepreneurs in the mining sector. The Company is also an active contributor of the TSM protocol on DEI and is working closely with Mining HR Canada on various initiatives.
Governance
The Board of Directors of IAMGOLD (the “Board”) adopted new diversity and renewal guidelines in 2021, reflecting governance best practices. In terms of diversity, the Board agreed that its membership should comprise, at a minimum, the greater of (i) two and (ii) 30%, female directors. With respect to Board membership renewal, it was decided that the average tenure of the Board should not exceed ten years and that no director should serve as the chair of the Board or the chair of any committee for more than ten consecutive years. Currently, women represent approximately 43% of the directors and the average tenure of directors on the Board is less than one year.
Recent Developments and Acknowledgments
•Corporate Knights released its Best 50 list on June 29, 2022, which identifies the top 50 Canadian corporate citizens across all sectors evaluated based on ESG and economic key performance indicators. From a pool of 332 firms, the Company placed in 37th place, an improvement of seven places over the prior year.
•In a recent ESG assessment by Moody’s ESG Solutions, IAMGOLD was ranked 5th out of 52 sector peers, with notable strengths in social and economic development, environmental strategy, health & safety and governance.
•The Company obtained the ECOLOGO® certification for its mineral exploration activities carried out in Quebec and is the first producing mining company to achieve such certification.
•On September 16, 2022, the Company announced the departure of Daniella Dimitrov, Chief Financial Officer ("CFO") and Executive Vice president, Strategy & Corporate Development. Maarten Theunissen, the Company's current Vice President of Finance, was appointed interim CFO.
•On September 30, 2022, Deborah Starkman resigned from the Board. Ms. Starkman's decision to resign was to focus on her other professional commitments.
| | | | | |
IAMGOLD CORPORATION Third Quarter 2022 Management’s Discussion and Analysis | 9 |
QUARTERLY UPDATES
West Africa
Essakane District, Burkina Faso
The Essakane District is located in north-eastern Burkina Faso, West Africa approximately 330 km northeast of the capital, Ouagadougou. The Essakane District includes the Essakane Mine and the surrounding mining lease and exploration concessions totaling approximately 650 square kilometres. The Company owns a 90% interest in the Essakane mine with the remaining 10% held by the government of Burkina Faso.
Essakane Mine (IAMGOLD interest – 90%)1
| | | | | | | | | | | | | | | | | |
| | |
| | | | | |
| Q3 2022 | Q2 2022 | Q3 2021 | YTD 2022 | YTD 2021 |
| Key Operating Statistics | | | | | |
| Ore mined (000s t) | 3,259 | | 3,803 | | 3,908 | | 10,894 | | 11,902 | |
| Waste mined (000s t) | 9,357 | | 7,602 | | 11,335 | | 28,305 | | 33,502 | |
| Material mined (000s t) – total | 12,616 | | 11,405 | | 15,243 | | 39,199 | | 45,404 | |
Strip ratio2 | 2.9 | | 2.0 | | 2.9 | | 2.6 | | 2.8 | |
| Ore milled (000s t) | 2,978 | | 2,704 | | 3,298 | | 8,844 | | 9,656 | |
| Head grade (g/t) | 1.50 | | 1.52 | | 1.33 | | 1.47 | | 1.37 | |
| Recovery (%) | 90 | | 90 | | 83 | | 89 | | 82 | |
| Gold production (000s oz) – 100% | 129 | | 119 | | 118 | | 372 | | 349 | |
| Gold production (000s oz) – attributable 90% | 115 | | 107 | | 106 | | 334 | | 314 | |
| Gold sales (000s oz) – 100% | 133 | | 117 | | 122 | | 381 | | 351 | |
Average realized gold price3 ($/oz) | $ | 1,739 | | $ | 1,882 | | $ | 1,790 | | $ | 1,833 | | $ | 1,794 | |
Financial Results ($ millions)1 | | | | | |
Revenues4 | $ | 232.2 | | $ | 218.8 | | $ | 217.4 | | $ | 699.2 | | $ | 629.7 | |
| Operating costs | (115.7) | | (86.4) | | (101.1) | | (292.5) | | (303.3) | |
| Royalties | (11.4) | | (10.6) | | (10.9) | | (34.3) | | (31.5) | |
| | | | | |
Cash costs3 | $ | (127.1) | | $ | (97.0) | | $ | (112.0) | | $ | (326.8) | | $ | (334.8) | |
Other mine costs5 | (0.3) | | (0.3) | | (0.3) | | (1.0) | | (0.7) | |
Cost of sales4 | $ | (127.4) | | $ | (97.3) | | $ | (112.3) | | $ | (327.8) | | $ | (335.5) | |
Sustaining capital expenditures3,6 | (37.6) | | (31.1) | | (11.6) | | (116.4) | | (28.3) | |
| | | | | |
Other costs and adjustments7 | (1.5) | | (2.0) | | (1.5) | | (1.8) | | (4.9) | |
AISC3 | $ | (166.5) | | $ | (130.4) | | $ | (125.4) | | $ | (446.0) | | $ | (368.7) | |
Expansion capital expenditures3,8 | $ | (1.0) | | $ | (0.5) | | $ | (27.2) | | $ | (2.5) | | $ | (60.3) | |
Performance Measures9 | | | | | |
| Cost of sales excluding depreciation ($/oz sold) | $ | 954 | | $ | 838 | | $ | 925 | | $ | 860 | | $ | 956 | |
Cash costs3 ($/oz sold) | $ | 952 | | $ | 836 | | $ | 923 | | $ | 858 | | $ | 955 | |
AISC3 ($/oz sold) | $ | 1,248 | | $ | 1,124 | | $ | 1,033 | | $ | 1,171 | | $ | 1,051 | |
1.100% basis, unless otherwise stated.
2.Strip ratio is calculated as waste mined divided by ore mined.
3.This is a non-GAAP financial measure. See "Non-GAAP Financial Measures".
4.As per note 27 of the consolidated interim financial statements for revenues and cost of sales. Cost of sales is net of depreciation expense.
5.Other mine costs exclude by-product credits.
6.Includes sustaining capitalized stripping for the third quarter 2022 of $18.6 million (second quarter 2022 - $17.2 million; third quarter 2021 - $1.0 million) and YTD 2022 of $65.7 million (YTD 2021 - $1.0 million).
7.Other costs and adjustments include sustaining lease principal payments, environmental rehabilitation accretion and depletion and prior period operating costs, partially offset by by-product credits.
8.Includes expansion capitalized stripping for the third quarter 2022 of $nil (second quarter 2022 - $nil; third quarter 2021 - $21.8 million) and YTD 2022 of $nil (YTD 2021 - $43.9 million).
9.Cost of sales, cash costs and AISC per ounce sold may not be calculated based on amounts presented in this table due to rounding.
Operational Insights
•Essakane continued to deliver strong results and achieved attributable gold production of 115,000 ounces in the third quarter of 2022, higher by 8,000 ounces or 7% compared to the prior quarter and 9,000 ounces or 8% compared to the same quarter of the prior year. Higher production is attributed mainly to higher mill throughput when compared with the prior quarter and better head grade at higher recovery rates when compared to the same prior year period.
| | | | | |
IAMGOLD CORPORATION Third Quarter 2022 Management’s Discussion and Analysis | 10 |
•Mining activity of 12.6 million tonnes in the third quarter was higher compared to the prior quarter mainly due to the return of mining operations to full capacity during September as a result of mitigation efforts and an easing of supply chain challenges in the country.
•Mill throughput of 3.0 million tonnes in the third quarter, at an average head grade of 1.50 g/t Au and plant availability of 93%, was higher compared to the prior quarter due to improved grind size and mill availability. Mill recovery of 90% in the third quarter was similar to the prior quarter.
•The Company reported on certain political developments in Burkina Faso in the third quarter (see news release dated October 3, 2022). All IAMGOLD personnel continue to be safe and Essakane continues to operate as per the business plan.
•The security situation in Burkina Faso continues at elevated risk levels and the Company continues to take proactive measures to ensure the safety and security of in-country personnel and is constantly adjusting its protocols and the activity levels at the site according to the security environment. The Company is furthering certain additional investments in security and supply chain infrastructure in the region and at the mine site, with the support of the government. The security situation continues to apply pressures to the in-country supply chain, however mitigation measures minimized impacts in the third quarter.
•The COVID-19 situation remained stable during the third quarter with a few isolated cases recorded.
•The IAMALLIN improvement project has continued the execution phase in the third quarter, with the focus continuing on improving mine productivity, mill feed optimization and supplies inventory management including lead time optimization.
Financial Performance - Q3 2022 Compared to Q2 2022 and Q3 2021
•Cost of sales, excluding depreciation, of $127.4 million was (i) higher by $30.1 million or 31% compared with the prior quarter, primarily due to higher operating costs resulting from higher mill throughput as described above and an increase in operational waste stripping volumes, and (ii) higher by $15.1 million or 13% compared to the same prior year period, primarily due to higher operational waste stripping volumes and inflationary impacts, partially offset by lower mill throughput and higher realized derivative gains.
•Compared to the second quarter 2022, cost of sales, excluding depreciation, and cash costs per ounce sold of $954 and $952, respectively, were higher by 14%, primarily due to higher operating costs partially offset by higher production and sales. AISC per ounce sold of $1,248 was higher by $124 or 11% due to higher cash costs per ounce and higher sustaining capital expenditures.
•Compared to the third quarter 2021, cost of sales, excluding depreciation, and cash costs per ounce sold, were higher by 3%, primarily due to higher operating costs resulting from inflation, partially offset by higher production and sales. AISC per ounce sold was higher by $215 or 21%, compared with the same prior year period primarily due to higher sustaining capital expenditures.
•Total capitalized stripping (sustaining and expansion) in the third quarter of $18.6 million was higher by $1.4 million or 8% and lower by $4.2 million or 18% compared to the prior quarter and same prior year period, respectively. Capitalized stripping was higher than the prior quarter as the impact of supply chain issues were mitigated towards the end of the quarter, while lower than the same prior year period due to the timing of stripping activities and the impact of the supply chain issues experienced in 2022.
•Sustaining capital expenditures, excluding capitalized stripping, of $19.0 million included mobile and mill equipment of $8.0 million, capital spares of $4.4 million, tailings management of $1.9 million, airstrip extension of $1.6 million and other sustaining projects of $3.1 million. Expansion capital expenditures, excluding capitalized stripping, of $1.0 million, primarily included capital projects associated with the community village resettlement project.
Financial Performance – YTD 2022 Compared to YTD 2021
•Cost of sales, excluding depreciation, of $327.8 million for YTD 2022, was lower by $7.7 million or 2% compared with the same prior year period, primarily due to a higher ratio of stripping costs capitalized and the positive impact of realized derivative gains, partially offset by higher operating costs due to inflation.
•Cost of sales, excluding depreciation, and cash costs per ounce sold of $860 and $858, respectively, for YTD 2022 was lower by 10% compared to the same prior year period, due to lower cost of sales noted above combined with the impact of higher production and sales volume.
•AISC per ounce sold of $1,171 for YTD 2022 was higher by $120 or 11%, compared to the same prior year period, primarily due to higher sustaining capital expenditures, partially offset by lower cash costs per ounce.
•Sustaining capital expenditures, excluding capitalized stripping, of $50.7 million for YTD 2022 included mobile and mill equipment of $16.8, capital spares of $14.4 million, tailings management of $6.2 million, airstrip extension of $4.4 million, and other sustaining projects of $8.9 million. Expansion capital expenditures, excluding capitalized stripping, of $2.5 million for YTD 2022 included capital projects associated with community village resettlement, tailings management, tailings management plant upgrade and other expansion projects.
| | | | | |
IAMGOLD CORPORATION Third Quarter 2022 Management’s Discussion and Analysis | 11 |
Outlook
The guidance range for 2022 attributable gold production at Essakane has been increased to 410,000 to 430,000 ounces, reflecting the continued trend of positive grade reconciliation. The Company is investigating whether the updated block model may be underestimating grade as the complexity of mineralization has increased in the lower portions of the pit with higher amounts of coarse gold. The operation continues to execute on targeted operational improvements including improving mill throughput optimizing blast fragmentation and enhanced gravity circuit recoveries through the planned addition of a double deck screen. In the fourth quarter, Essakane's capital stripping program is expected to increase from current levels in order to secure the 2023 and 2024 production plan, assuming no significant disruptions in the supply chain resulting from the security situation described above.
Cash costs continue to be under pressure due to systemic inflation and constrained global supply chains, although these pressures have been partially offset through increased sales volumes and the weakening of the EURUSD exchange rate which lowers the cost of certain inputs, including labour. The Company continues to actively work with authorities and suppliers to mitigate potential impacts and manage continuity of supply due to the security situation noted above while also investing in additional security infrastructure.
Brownfield Exploration
During the first three quarters of 2022, approximately 9,000 metres of diamond drilling were completed as part of a planned 10,000-metre infill program in 2022 to improve resource confidence within selected areas of the EMZ and the Lao satellite deposit. Exploration activities on concessions surrounding the mine lease continue to be suspended due to the impacts of regional security constraints.
Bambouk District
The Bambouk District includes the Boto Gold project and the Karita and the Diakha-Siribaya Gold projects located within 15 kilometres of the Boto Gold project in adjacent countries. The Company is undertaking a delineation drilling program to support an initial resource estimate at the Karita discovery in Guinea and the completion of an updated mineral resource estimate aiming to convert mineral resources to a higher confidence level at the Diakha deposit in Mali. The Company continues to progress its strategic alternatives with respect to these development and exploration assets in West Africa that may include the disposition of all or an interest in one or more of such assets. See “Liquidity and Capital Resources - Liquidity Outlook”.
Boto Gold Project, Senegal
The Boto Gold project is a shovel ready development project located in southeastern Senegal along the border with Mali. The project is owned 90% by the Company, with the Republic of Senegal owning a 10% free carried interest. The project is located on an exploitation permit granted in late 2019 for an initial 20-year period and is currently undergoing various de-risking activities.
The 2022 scope includes the completion of preliminary works started in 2021. During the third quarter 2022, both geotechnical drilling to further de-risk the Malikoundi pit design, as well as on-site hydrogeological testing to further understand and model water flow, were competed. The data acquired are being processed and final reports are expected by year-end 2022. The Company is progressing with the work related to the Kouliminde village resettlement action plan and continues to evaluate the scope of the overall project, associated capital expenditures and timing, as well as potential alternatives to enhance the value of the project in general. Capital expenditures totaled $11.8 million for the first three quarters of 2022.
Karita Gold Project, Guinea
The Karita Gold project is wholly-owned by the Company and was acquired in 2017 as a granted exploration permit that covers approximately 100 square kilometres located in Guinea between the Company's Boto Gold project in Senegal to the north and its Diakha-Siribaya Gold project in Mali to the south. During 2019, a first pass RC drilling program confirmed the discovery of mineralization along this portion of the Senegal-Mali Shear Zone.
In 2022, the Company is completing a 24,000-metre drilling program to support a future initial mineral resource estimate, of which approximately 21,000 metres were completed in the first three quarters of 2022. During the third quarter, the Company reported assay results with highlights including: 34.0 metres grading 5.81 g/t Au, 25.0 metres grading 5.32 g/t Au and 12.0 metres grading 9.49 g/t Au (see news release dated July 6, 2022).
Diakha-Siribaya Gold Project, Mali
The Diakha-Siribaya project is wholly-owned by the Company and consists of eight contiguous exploration permits which cover a total area of approximately 600 square kilometres, located approximately 10 kilometres south of the Boto Gold project, in the Kédougou-Kéniéba inlier of the West African Craton region of western Mali along the borders with Senegal and Guinea. The results of a revised mineral resource estimate incorporating the drill results from the 2021 drilling program completed at the Diakha deposit are expected to be reported in Company's annual year end Mineral Resource and Reserve statement.
| | | | | |
IAMGOLD CORPORATION Third Quarter 2022 Management’s Discussion and Analysis | 12 |
North America
Abitibi District, Canada
The Company is developing a “hub-and-spoke" model in the Abitibi District to exploit the available mill capacity at the Westwood complex, located 35 kilometres northeast of Rouyn-Noranda and 80 kilometres west of Val d'Or in southwestern Québec, Canada. In addition to feed from the Westwood underground mine and the Grand Duc open pit mine, the Company is evaluating potential future supplemental feed from assets such as the Fayolle exploration property and the optioned Rouyn Gold project.
Westwood Mine (IAMGOLD interest – 100%)
| | | | | | | | | | | | | | | | | |
| | |
| | | | | |
| Q3 2022 | Q2 2022 | Q3 2021 | YTD 2022 | YTD 2021 |
| Key Operating Statistics | | | | | |
| Underground lateral development (metres) | 951 | | 1,207 | | 401 | 3,006 | | 549 | |
| Ore mined (000s t) – underground | 61 | | 53 | | 31 | | 177 | | 45 | |
| Ore mined (000s t) – other sources | 243 | | 218 | | 171 | | 620 | | 690 | |
| Ore mined (000s t) – total | 304 | | 271 | | 202 | | 797 | | 735 | |
| Ore milled (000s t) | 284 | | 284 | 220 | | 818 | | 711 | |
| Head grade (g/t) – underground | 6.82 | | 4.01 | | 4.17 | | 5.68 | | 4.26 | |
| Head grade (g/t) – other sources | 0.94 | | 1.04 | | 0.59 | | 0.98 | | 0.82 | |
| Head grade (g/t) – total | 2.23 | | 1.62 | | 1.11 | | 2.00 | | 1.03 | |
| Recovery (%) | 94 | | 93 | | 92 | | 93 | | 93 | |
| Gold production (000s oz) – 100% | 19 | | 14 | | 7 | | 49 | | 22 | |
| Gold sales (000s oz) – 100% | 18 | | 14 | | 7 | | 48 | | 22 | |
Average realized gold price1 ($/oz) | $ | 1,730 | | $ | 1,854 | | $ | 1,779 | | $ | 1,814 | | $ | 1,790 | |
| Financial Results ($ millions) | | | | | |
Revenues2 | $ | 31.4 | | $ | 27.1 | | $ | 12.7 | | $ | 89.3 | | $ | 39.4 | |
| | | | | |
| | | | | |
Cash costs1 | $ | (32.4) | | $ | (34.8) | | $ | (24.7) | | $ | (97.7) | | $ | (47.8) | |
Other mine costs3 | (0.3) | | (0.6) | | — | | (1.4) | | (0.3) | |
Cost of sales2 | $ | (32.7) | | $ | (35.4) | | $ | (24.7) | | $ | (99.1) | | $ | (48.1) | |
Sustaining capital expenditures1 | (6.4) | | (8.8) | | (3.8) | | (22.5) | | (6.3) | |
Other costs and adjustments4 | (0.7) | | (0.9) | | (0.4) | | (1.7) | | (0.2) | |
AISC1 | $ | (39.8) | | $ | (45.1) | | $ | (28.9) | | $ | (123.3) | | $ | (54.6) | |
Expansion capital expenditures1 | $ | (1.5) | | $ | (0.7) | | $ | (0.8) | | $ | (2.7) | | $ | (2.6) | |
Performance Measures5 | | | | | |
Cost of sales excluding depreciation6 ($/oz sold) | $ | 1,817 | | $ | 2,463 | | $ | 3,512 | | $ | 2,043 | | $ | 2,205 | |
Cash costs1 ($/oz sold) | $ | 1,803 | | $ | 2,427 | | $ | 3,500 | | $ | 2,015 | | $ | 2,192 | |
AISC1 ($/oz sold) | $ | 2,208 | | $ | 3,147 | | $ | 4,087 | | $ | 2,541 | | $ | 2,501 | |
1.This is a non-GAAP financial measure. See "Non-GAAP Financial Measures".
2.As per note 27 of the consolidated interim financial statements for revenues and cost of sales. Cost of sales is net of depreciation expense.
3.Other mine costs exclude by-product credits.
4.Other costs and adjustments include sustaining lease principal payments and environmental rehabilitation accretion and depletion, partially offset by by-product credits.
5.Cost of sales, cash costs and AISC per ounce sold may not be calculated based on amounts presented in this table due to rounding.
6.Includes non-cash ore stockpile and finished goods inventories NRV write-down of $1.1 million for the third quarter 2022 (second quarter 2022 - $3.3 million; third quarter 2021 - $4.8 million) and $6.1 million for YTD 2022 (YTD 2021 - $7.8 million), which had an impact on cost of sales, excluding depreciation, per ounce sold of $61 for third quarter 2022 (second quarter 2022 - $232; third quarter 2021 - $681) and $126 for YTD 2022 (YTD 2021 - $358).
Operational Insights
•Westwood achieved gold production of 19,000 ounces in the third quarter, higher by 5,000 ounces or 36% compared to the prior quarter, as a result of higher volumes of underground ore at a higher grade. Underground production was on care and maintenance for the majority of the first half of 2021 with the ramp up of underground mining activities beginning in the third quarter of 2021.
•Mining activities totaled 304,000 tonnes in the third quarter, with underground mining activities contributing 61,000 tonnes and the open pit mining at Grand Duc contributing 243,000 tonnes. Mining volumes were 12% higher than the prior quarter due to improved underground mine performance and supplemental tonnes from Grand Duc.
| | | | | |
IAMGOLD CORPORATION Third Quarter 2022 Management’s Discussion and Analysis | 13 |
•Underground development in the third quarter achieved 951 metres of lateral development, 21% lower than the prior quarter due to labour constraints and lower mechanical availability of underground equipment. Development of vertical escape ways and underground rehabilitation progressed in line with planned levels despite challenging ground conditions and impacts from supply chain challenges. Underground mining activity in the third quarter focused on accessing additional stope sequences in the eastern zones in order to secure multiple ore faces to allow for simultaneous exploitation in support of the production plan. Mining activities in the higher-grade western and central underground zones commenced in June 2022.
•Mill throughput was 284,000 tonnes in the third quarter at a head grade of 2.23 g/t Au with average recovery of 94% and plant availability of 91%. Mill throughput was in line with the prior quarter and continues to benefit from successfully executing mill maintenance strategies for improved availability as well as management of highly abrasive material from Grand Duc.
•The COVID-19 situation at site and in the Abitibi District remained stable in the third quarter.
Financial Performance - Q3 2022 Compared to Q2 2022 and Q3 2021
•Cost of sales, excluding depreciation, of $32.7 million was (i) lower by $2.7 million or 8% compared with the prior quarter, primarily due to a lower NRV write-down, and (ii) higher by $8.0 million or 32% compared to the same prior year period as underground mining was ramping up having resumed in June 2021.
•Compared to the second quarter 2022, cost of sales excluding depreciation and cash costs per ounce sold of $1,817 and $1,803, were lower by 26%, respectively, primarily due to higher production volume and sales. AISC per ounce sold of $2,208 was lower by $939 or 30% due to lower cash costs and sustaining capital expenditures.
•Compared to the third quarter 2021, cost of sales, excluding depreciation, cash costs and AISC per ounce sold were lower by 48%, 48% and 46%, respectively, as underground mining was ramping up having resumed in June 2021.
•Sustaining capital expenditures in the third quarter of $6.4 million included underground development and diamond drilling of $4.7 million and other sustaining capital projects of $1.7 million. Expansion capital expenditures of $1.5 million relate to the relocation of certain infrastructure allowing for the expansion of the Grand Duc open pit.
Financial Performance – YTD 2022 Compared to YTD 2021
•Cost of sales, excluding depreciation, of $99.1 million for YTD 2022, was higher by $51.0 million or 106% compared with the same prior year period, as a result of the operations being in care and maintenance until June 2021.
•Cost of sales, excluding depreciation, cash costs and AISC per ounce sold of $2,043, $2,015, and $2,541 for YTD 2022, were lower by 7%, 8% and higher by 2%, respectively, compared to the same prior year period, as a result of the underground mining ramping up after operations being in care and maintenance until June 2021. Sustaining capital was higher as the underground development program also resumed with underground mining.
•Sustaining capital expenditures of $22.5 million for YTD 2022 included underground development and diamond drilling of $19.1 million and other sustaining projects of $3.4 million. Expansion capital expenditures of $2.7 million for YTD 2022 primarily related to advancing Fayolle property activities and supporting the expansion of the Grand Duc open pit.
Outlook
Gold production at the Westwood complex in 2022 is expected to be in the range of 65,000 to 75,000 ounces. Production levels are expected to continue to increase in the fourth quarter based on the underground mine delivering higher volumes of ore in the fourth quarter, in addition to an increase in the grade of the ore sourced from the Grand Duc open pit. The revised guidance range reflects the expectation that development rates will continue ramping up month-over-month. Underground mining activity is expected to continue to open access to new stope sequences in support of the 2023 production plan.
Year-to-date, additional cost pressures emerged as discussed above. Despite these impacts, cash costs per ounce sold are expected to continue to decrease in the fourth quarter 2022 with anticipated increases in production and sales. The current collective bargaining agreement with the Westwood union ends in November and negotiations are underway.
Brownfield Exploration - Westwood Area
Approximately 34,000 metres of underground and surface diamond drilling are planned in 2022. Surface drilling will focus on evaluating the resource potential between and adjacent to the Grand Duc and Doyon pits, while underground infill drilling will focus on supporting the continued ramp up of underground mining operations. Approximately 28,600 metres were completed in the first three quarters of 2022 including approximately 3,200 metres in geotechnical drilling.
Fayolle Property
The Company is evaluating the potential development of the Fayolle deposit located 29 kilometres northwest of the Westwood complex. Detailed engineering, permitting, and environmental studies are ongoing.
Rouyn Gold Project
The Company holds a purchase option with Yorbeau Resources Inc. (“Yorbeau”) for the Rouyn Gold project, located near Rouyn-Noranda. Approximately 5,700 metres of diamond drilling were completed in the first three quarters of 2022 to further delineate the Lac Gamble zone extensions and other selected targets to evaluate their resource potential and to support an initial mineral resource estimate expected to be completed in the first quarter of 2023.
| | | | | |
IAMGOLD CORPORATION Third Quarter 2022 Management’s Discussion and Analysis | 14 |
Côté District, Canada
The Côté District located 125 kilometres southwest of Timmins and 175 kilometres north of Sudbury, Ontario, Canada includes the Côté Gold construction project and the adjacent Gosselin deposit. The project is being developed by a 70:30 joint venture (the "Côté Gold UJV") between IAMGOLD, as the operator, and Sumitomo Metal Mining Co. Ltd. (“SMM”) with the Company effectively owning a 64.75% interest in the associated land package. In July 2020, the Company, together with SMM, announced the decision to proceed with the construction of the project.
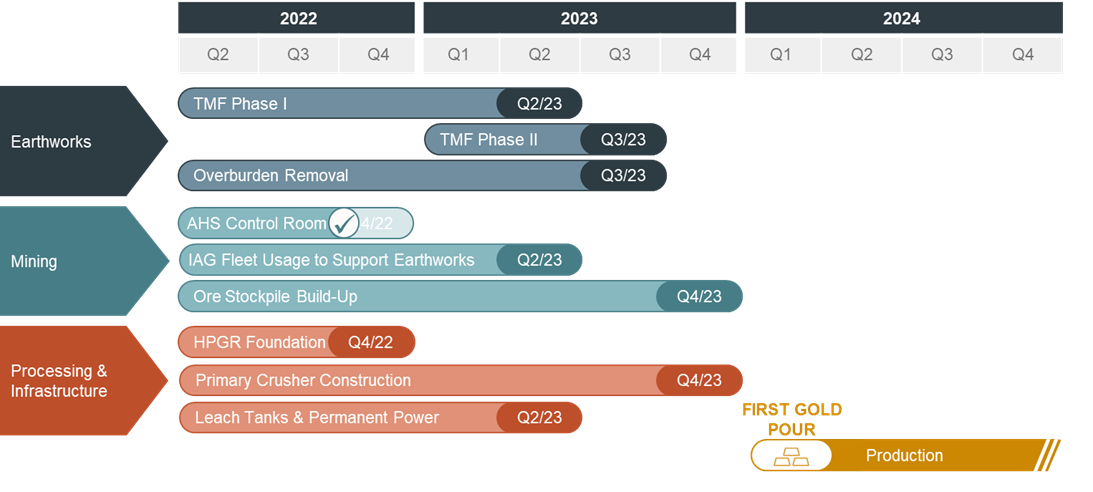
Upcoming Milestones and Schedule Summary
Côté Gold is expected to commence production in early 2024. Construction of the project commenced in the third quarter 2020 and major earthworks commenced in the first quarter 2021. Remaining milestones of note are as follows:
The Company cautions that potential further disruptions, including, without limitation caused by COVID-19, the Ukraine war, inflation, other global supply chain disturbances, weather, labour disputes and the tight labour market could continue to impact the timing of activities, availability of workforce, productivity and supply chain and logistics and, consequently, could further impact the timing of actual commercial production and, consequently, project costs.
Third Quarter Activities Update
As of September 30, 2022, overall, the project was approximately 64.2% complete, with detailed engineering fully complete and shifting to construction field engineering. The following provides an update on project activities:
| | | | | |
| Project Activity | Update |
Health and safety | The project has surpassed 6.9 million hours of no lost time injuries. The project is operating at near peak manpower capacity. COVID-19 impacts have been limited but remain closely monitored and controlled on a case-by-case basis. |
Labour and workforce | Current manpower on site reached approximately 1,500 workers and is nearing peak capacity levels. A temporary camp providing an additional 220 rooms capacity to meet anticipated peak camp load was completed in August and is currently in service. |
| | | | | |
IAMGOLD CORPORATION Third Quarter 2022 Management’s Discussion and Analysis | 15 |
| | | | | |
Earthworks activities | Earthworks activities advanced with several work fronts providing significant progress over the summer months, including the tailings management facility, water realignment channels, polishing pond dam and other water management infrastructure dams. •Côté Lake Dam, Polishing Pond Dam, Dam 4, and Emulsion Plant Pads are complete and work on the East Seepage collection Pond Dam, TMF West Dam and Water Realignment Channel 2 is advancing. • The 2022 fish relocation program progressed with the Polishing Pond fish out completed in September. Smaller water bodies in the West Overburden Expansion areas are expected to be completed by year-end. • Following the installation of water treatment systems in the second quarter to redress higher amounts of freshet water experienced in the spring, the water level in the pit remained at low levels, allowing for overburden excavation to progress. A site water management study to assess current dewatering systems in preparation for the 2023 freshet is underway. Overburden material removal from the pit and access to fresh rock remain a priority. •TMF East Starter Dam work advanced to the north and south plinth, including cleaning and doweling activities of the north plinth, the completion of concrete placement on the south plinth, placement of a geomembrane liner and appropriate granular material, including run of mine material on the dam.
|
Procurement | Heavy mobile equipment continues to arrive on site including CAT 793F haul trucks (11 delivered), 994 loaders (2 delivered) and D10 dozers (4 delivered) at the end of September. The handover and assembly of the Autonomous Control Room was completed in mid September in line with the update project schedule. Equipment delivery is ongoing with inventory being held on site laydown and off-site at warehouses. Some equipment is being held at North American based suppliers to reduce load onsite and off-site storage facilities. Equipment preservation is being executed at present prior to the winter season to align with the required on site schedule requirements. At present there is no material impact on schedule related to supply chain or logistics. |
Processing plant | Processing plant civil works have progressed with the continued placement of pre-cast and cast-in-place concrete, with a number of selected areas well positioned for handover to advance mechanical installation. The primary crusher concrete is complete to the 409 elevation with one more vertical lift remaining to be formed and poured. Work is ongoing at the secondary crusher, HPGR and screening building. SMP work activities in the processing plant are well underway, with the first sections of the ball mill mounted on erection cradles and the pump box set in place. Structural steel and steel deck activities are progressing, including piping. The wet end of the plant has begun SMP work, while the focus remains on exterior building works at the leach tanks, thickeners, and structural steel. Concrete foundations for the HPGR/Secondary Crusher, screening buildings, and fine ore bins have been handed over to SMPEI contractors. |
Infrastructure | The overhead power line has been completed, with the exception of connection to Hydro and the main electrical substation, which is under construction. Stringing and installation of the 13.8 kV network has continued to advance. Hydro One electrical upgrade work has been completed. Erection of tower bases for the autonomous system progressed with 11 out of 13 bases complete. The assay lab structure and cladding has been complete with activities shifting to interior works. Truck shop foundations are 95% complete and structural steel erection is well advanced. The truck wash and warehouse building interior works are well underway. Buried piping installation works continued, although at lower productivity rates, resulting in the addition of a night shift and an increase in crew size to mitigate planned activities, while prioritizing excavation required to complete before the onset of winter. The administration building and offices have been erected and are commissioning. |
Permitting and sustainability | Permitting and sustainability work is ongoing with all remaining non-critical path permitting activities expected to be received during the remainder of the project construction. Community consultations and ongoing implementation of the impact benefit agreements signed with indigenous partners continue. Health, safety and environmental programs and their respective emergency response plans are in development.
|
Operational readiness | Operational readiness advanced in multiple areas with a continued focus on organizational design and hiring strategy deployment, technology selection and implementation, standardization of mine, mill and site maintenance processes and systems, identification and purchase of spare parts for equipment and advancement in contracts for key consumables, and training documentation for autonomous haul trucks. Two waves of autonomous control room operators have now completed their onboarding training. |
| | | | | |
IAMGOLD CORPORATION Third Quarter 2022 Management’s Discussion and Analysis | 16 |
Project Expenditures
The Company's estimated attributable remaining project spend to complete construction and bring Côté Gold into production is $1.0 to $1.1 billion from October 1, 2022, net of leases and working capital assuming a USDCAD rate of 1.25.
The Company had incurred and expended costs of $159.0 million and $158.9 million, respectively, (at an average recorded USDCAD exchange rate of 1.31) in the third quarter 2022 and $924.7 million and $825.4 million, respectively, (at an average recorded USDCAD exchange rate of 1.27) since July 1, 2020, including capital expenditures and non-capital project costs summarized in the table below. The project is in line with the updated technical report.
| | | | | | | | | | | | | | | | | | | | | | |
| | | | | |
| | | | | | | | |
| Q3 2022 | Q2 2022 | Q3 2021 | YTD 2022 | YTD 2021 | Expenditures to date | | |
Capital expenditures1,2 ($ millions) | $ | 162.3 | | $ | 169.6 | | $ | 67.3 | | $ | 410.4 | | $ | 200.4 | | $ | 805.8 | | | |
| Lease funding | (10.7) | | — | | — | | (10.7) | | — | | (10.7) | | | |
Non-capital costs3 | 7.3 | | 2.8 | | 4.3 | | 13.9 | | 11.3 | | 30.3 | | | |
| Expended costs | 158.9 | | 172.4 | | 71.6 | | 413.6 | | 211.7 | | 825.4 | | | |
Working capital adjustment4 | 0.1 | | (23.5) | | 51.1 | | 24.3 | | 80.6 | | 99.3 | | | |
| Incurred costs | $ | 159.0 | | $ | 148.9 | | $ | 122.7 | | $ | 437.9 | | $ | 292.3 | | $ | 924.7 | | | |
| | | | | | | | |
| | | | | | | | |
| | | | | | | | |
1.Capital expenditures prior to July 1, 2020 are not included in the Company’s portion of reported total project costs.
2.Capital expenditures include certain offsets including realized derivative gains of $1.7 million in the third quarter 2022. Capital expenditures exclude the realized gain of $0.2 million on the Target Accrual Redemption Forward ("TARF") and the forward contract with an extendible feature (see “Market Risks – Summary of Hedge Portfolio”).
3.Non-capital costs include exploration and mining costs recorded as stockpiles which totaled $1.0 million in the third quarter 2022.
4.Working capital adjustment mainly consists of work performed not yet invoiced combined with an increase in the accounts payable balance, offset by an increase in sales taxes receivable.
Gosselin Zone
The Gosselin zone is located immediately to the northeast of the Côté Gold deposit. Approximately 16,000 metres of diamond drilling is planned in 2022 to further delineate and expand the Gosselin mineral resources and test selected targets along an interpreted favourable deposit corridor. Approximately 15,000 metres were completed in the first three quarters of 2022.
During the first quarter 2022, the Company announced remaining assay results from its 2021 delineation diamond drilling program at the Gosselin zone confirming expected grades within the modelled resource, and in some cases, the extension of the mineralization zone outside the resources boundaries of the mineralization model (see news release dated January 27, 2022).
Additional technical studies are planned which will include a sampling program to advance future metallurgical test work and mining and infrastructure studies to review alternatives to optimize the inclusion of the Gosselin deposit resources into a future Côté Gold LOM plan.
Chibougamau District, Canada
The Chibougamau District includes the Nelligan Gold project and the Monster Lake project.
Nelligan Gold Project
The Nelligan Gold project is located approximately 40 kilometres south of the Chapais – Chibougamau area in Québec and is operating as a 75:25 earn-in option to joint venture with Vanstar Mining Resources Inc (“Vanstar”). The Company holds an option to earn an additional 5% interest, for an 80% total interest, by completing a feasibility study on the project. Approximately 4,700 metres of diamond drilling was completed in the first three quarters of 2022 to support the completion of an updated resource estimate expected by the end of 2022.
During the third quarter, Vanstar reported assay results from the 2022 drilling program which intersected multiple wide intercepts of gold mineralization, including the following highlights: 69.0 metres grading 2.24 g/t Au, 52.3 metres grading 1.60 g/t Au and 23.8 metres grading 3.21 g/t Au (see Vanstar news release dated July 6, 2022).
| | | | | |
IAMGOLD CORPORATION Third Quarter 2022 Management’s Discussion and Analysis | 17 |
South America
Rosebel District, Suriname
The Rosebel District includes the Rosebel open pit mine located 85 kilometres south of the capital city of Paramaribo, Suriname and the Saramacca open pit satellite mine, a higher grade deposit located 25 kilometres from the Rosebel operations. The Company owns 95% of the gross Rosebel mining concession. Rosebel owns 70% of certain specified concession areas including Saramacca.
Rosebel Mine (IAMGOLD interest – 95%)1
| | | | | | | | | | | | | | | | | |
| | |
| | | | | |
| Q3 2022 | Q2 2022 | Q3 2021 | YTD 2022 | YTD 2021 |
| Key Operating Statistics | | | | | |
Ore mined2 (000s t) | 1,361 | | 1,500 | | 1,432 | | 4,449 | | 3,781 | |
Waste mined2 (000s t) | 12,346 | | 13,965 | | 9,703 | | 37,439 | | 25,569 | |
Material mined2 (000s t) – total | 13,707 | | 15,465 | | 11,135 | | 41,888 | | 29,350 | |
Strip ratio2,3 | 9.1 | | 9.3 | | 6.8 | | 8.4 | | 6.8 | |
| Ore milled (000s t) – Rosebel | 1,139 | | 1,572 | | 1,719 | | 4,266 | | 4,771 | |
Ore milled2 (000s t) – Saramacca | 679 | | 629 | | 956 | | 2,067 | | 2,667 | |
Ore milled2 (000s t) – total | 1,818 | | 2,203 | | 2,675 | | 6,333 | | 7,438 | |
Head grade2,4 (g/t) | 1.06 | | 0.88 | | 0.68 | | 0.90 | | 0.67 | |
Recovery2 (%) | 95 | | 92 | | 82 | | 93 | | 84 | |
Gold production2 (000s oz) – 100% | 58 | | 57 | | 47 | | 170 | | 135 | |
Gold production1 (000s oz) – owner operator | 52 | | 51 | | 42 | | 152 | | 118 | |
| Gold production (000s oz) – attributable 95% | 50 | | 49 | | 40 | | 145 | | 112 | |
Gold sales1 (000s oz) – owner operator | 52 | | 54 | | 36 | | 155 | | 106 | |
Average realized gold price5 ($/oz) | $ | 1,726 | | $ | 1,861 | | $ | 1,779 | | $ | 1,824 | | $ | 1,770 | |
Financial Results ($ millions)1 | | | | | |
Revenues8 | $ | 88.8 | | $ | 101.9 | | $ | 64.0 | | $ | 282.3 | | $ | 188.0 | |
| Operating costs | (60.7) | | (65.9) | | (60.0) | | (184.6) | | (151.2) | |
| Royalties | (6.4) | | (6.8) | | (5.1) | | (19.0) | | (14.5) | |
Cash costs5,6 | $ | (67.1) | | $ | (72.7) | | $ | (65.1) | | $ | (203.6) | | $ | (165.7) | |
Other mine costs7 | (2.1) | | (1.1) | | — | | (5.9) | | — | |
Cost of sales8 | $ | (69.2) | | $ | (73.8) | | $ | (65.1) | | $ | (209.5) | | $ | (165.7) | |
Sustaining capital expenditures5,9 | (26.8) | | (27.7) | | (10.8) | | (75.0) | | (28.9) | |
Other costs and adjustments10 | (0.2) | | (1.1) | | (1.6) | | (0.9) | | (4.6) | |
AISC5 | $ | (96.2) | | $ | (102.6) | | $ | (77.5) | | $ | (285.4) | | $ | (199.2) | |
Expansion capital expenditures5,11 | $ | (2.7) | | $ | (14.7) | | $ | (12.8) | | $ | (23.4) | | $ | (39.3) | |
Performance Measures12 | | | | | |
Cost of sales excluding depreciation13 ($/oz sold) | $ | 1,346 | | $ | 1,349 | | $ | 1,808 | | $ | 1,355 | | $ | 1,559 | |
Cash costs5 ($/oz sold) | $ | 1,305 | | $ | 1,327 | | $ | 1,808 | | $ | 1,316 | | $ | 1,559 | |
AISC5 ($/oz sold) | $ | 1,873 | | $ | 1,874 | | $ | 2,156 | | $ | 1,845 | | $ | 1,875 | |
1.Rosebel at 100% and Saramacca at 70%, as included in the consolidated interim financial statements, unless otherwise stated.
2.Includes Saramacca at 100%.
3.Strip ratio is calculated as waste mined divided by ore mined.
4.Includes head grade / tonne for the third quarter 2022 related to the Rosebel concession of 1.03 g/t and the Saramacca concession of 1.11 g/t (second quarter 2022 - 0.85 g/t and 0.94 g/t respectively; third quarter 2021 – 0.64 g/t and 0.76 g/t respectively).
5.This is a non-GAAP financial measure. See "Non-GAAP Financial Measures".
6.Cash costs include by-product credits.
7.Other mine costs include the add-back of non-cash long-term portion of stockpile inventory NRV write-downs for the third quarter 2022 of $2.1 million (second quarter 2022 - $1.1 million; third quarter 2021 - $nil) and the exclusion of by-product credits.
8.As per note 27 of the consolidated interim financial statements for revenues and cost of sales. Cost of sales is net of depreciation expense.
9.Includes sustaining capitalized stripping for the third quarter 2022 of $15.6 million (second quarter 2022 - $7.3 million; third quarter 2021 - $nil) and YTD 2022 of $35.4 million (YTD 2021 - $nil).
10. Other costs and adjustments include sustaining lease principal payments and environmental rehabilitation accretion and depletion, partially offset by by-product credits.
11. Includes expansion capitalized stripping for the third quarter 2022 of $3.8 million (second quarter 2022 - $11.3 million; third quarter 2021 - $8.4 million) and YTD 2022 of $18.6 million (YTD 2021 - $23.3 million).
12. Cost of sales, cash costs and AISC per ounce sold may not be calculated based on amounts presented in this table due to rounding.
13. Includes non-cash ore stockpile and finished goods inventories NRV write-down of $2.1 million for the third quarter 2022 (second quarter 2022 - $1.1 million; third quarter 2021 - $nil) and $5.8 million for YTD 2022 (YTD 2021 - $15.2 million), which had an impact on cost of sales per ounce sold for third quarter 2022 of $41 (second quarter 2022 - $21 per ounce sold; third quarter 2021 - $245 per ounce sold) and $38 per ounce sold for YTD 2022 (YTD 2021 - $142 per ounce sold).
| | | | | |
IAMGOLD CORPORATION Third Quarter 2022 Management’s Discussion and Analysis | 18 |
Operational Insights
•Rosebel achieved attributable gold production in the third quarter of 50,000 ounces, generally in line with the prior quarter and 10,000 ounces or 25% higher than the same prior year period. Rosebel continues to benefit from improved recovery as a result of mill upgrades and higher head grades, when compared to both prior quarter and the same prior year period, partially offset by lower throughput compared to both the prior quarter and the same prior year period.
•Material mined of 13.7 million tonnes in the third quarter was 11% lower compared with the prior quarter and 23% higher compared to the same prior year period. Mining activity in the third quarter was lower due to reduced waste stripping at Rosebel. Mining activities focused on Saramacca to increase supply of higher grade soft ore and the advancement of waste stripping activities to secure access to higher grade zones. Ore mined at Saramacca remained in line with the prior quarter levels, while ore mined at Rosebel was 15% lower than the prior quarter. Ore from both the Rosebel concession and Saramacca were of higher grade than the prior quarter.
•Mill throughput of 1.8 million tonnes in the third quarter was 17% lower than the prior quarter at an average head grade of 1.06 g/t. Throughput was impacted by planned mill shutdowns. Rosebel contributed 46% of the ore at an average head grade of 1.18 g/t, Saramacca contributed 28% at an average head grade of 1.29 g/t and the remaining 26% was sourced from ore stockpiles with an average head grade of 0.60 g/t. Mill recovery of 95% for the third quarter was higher than the prior quarter, continuing to benefit from improvements to the carbon adsorption/desorption circuit completed at the end of 2021.
•The COVID-19 situation at the site and in Suriname has remained stable during the third quarter.
•The impact of illegal miners disrupting the operations remained stable in the third quarter. The Company is continuing its collaboration efforts with the government task force assigned to manage the security situation at the site as well as with village communities and other stakeholders around the mine site.
•At Saramacca, the dewatering wells and other earthworks activities, including slope remediation, have been substantially completed in the third quarter 2022. The East bypass road continues to progress with bush clearing efforts completed, tree harvesting underway and the completion of road capping on available sections.
•The Collective Labor Agreement (CLA) expired in August and the Company is negotiating with the Union to renew the agreement.
Financial Performance - Q3 2022 Compared to Q2 2022 and Q3 2021
•Cost of sales, excluding depreciation, of $69.2 million was (i) lower by $4.6 million or 6% compared with the prior quarter, primarily due to lower mill throughput partially offset by the impact of inflation, and (ii) higher by $4.1 million or 6% compared with the same prior year period as a result of higher costs due to inflation, partially offset by lower mill throughput, a higher stripping ratio and a lower NRV adjustment.
•Compared to the second quarter 2022, cost of sales, excluding depreciation, cash costs and AISC per ounce sold in the third quarter of $1,346, $1,305 and $1,873, were all in line.
•Compared to the third quarter 2021, cost of sales, excluding depreciation and cash costs per ounce sold were lower by 26% and 28%, respectively, primarily due to higher production, partially offset by higher costs due to inflation. AISC per ounce sold was lower by 13% due to higher ounces sold, partially offset by higher sustaining capital expenditures.
•Total capitalized stripping (sustaining and expansion) in the third quarter of $19.4 million was higher by $0.8 million or 4% and $11.0 million or 131%, compared to the prior quarter and the same prior year period, respectively. Capitalized stripping in the prior quarter was in line and increased compared to the same prior year period due to higher activity levels to access future production phases.
•Sustaining capital expenditures in the third quarter, excluding capitalized stripping, of $11.2 million included capital spares of $3.0 million, mill equipment of $1.7 million, tailings management of $0.8 million, pit development at Saramacca of $0.7 million, mobile equipment of $0.5 million, and other sustaining projects of $4.5 million. Expansion capital expenditures, excluding capitalized stripping, of $1.1 million included the Saramacca project and other expansion projects.
Financial Performance – YTD 2022 Compared to YTD 2021
•Cost of sales, excluding depreciation, of $209.5 million for YTD 2022, was higher by $43.8 million or 26% compared with the same prior year period, primarily as a result of higher production costs and increased mining activities and a lower NRV adjustment.
•Cost of sales, excluding depreciation, cash costs and AISC per ounce sold of $1,355, $1,316, and $1,845, for YTD 2022, were lower by 13%, 16% and 2%, respectively, compared to the same prior year period, primarily due to higher production volume, partially offset by higher production costs. AISC per ounce sold included higher sustaining capital expenditures of $213 per ounce sold.
•Capitalized stripping of $54.0 million for YTD 2022 was higher by $30.7 million or 132% due to activity levels being adversely impacted by COVID-19 during YTD 2021.
•Sustaining capital expenditures, excluding capitalized stripping, of $39.6 million for YTD 2022 included capital spares of $16.6 million, mill equipment of $5.7 million, mobile equipment of $3.7 million, tailings management of $3.7 million, and other sustaining projects of $9.9 million. Expansion capital expenditures, excluding capitalized stripping, of $4.8 million for YTD 2022 primarily included the Saramacca development project.
| | | | | |
IAMGOLD CORPORATION Third Quarter 2022 Management’s Discussion and Analysis | 19 |
Outlook
On October 18, 2022, the Company announced that it had entered into a definitive agreement with Zijin Mining Group Co. Ltd. to sell its interests in the Rosebel mine for cash consideration of $360 million plus working capital adjustments, as well as the release of approximately $41 million of IAMGOLD obligations related to equipment leases, on closing. The transaction is expected to close in the first quarter 2023 or earlier. It is subject to certain regulatory approvals, including approvals from the relevant authorities of the People’s Republic of China, the Government of Suriname, and other customary closing conditions. An after-tax non-cash impairment charge of $74.0 million ($115.8 million before tax) was recorded to align the carrying value of the Rosebel cash generating unit with the purchase price.
Attributable gold production at Rosebel in 2022 is now expected to be in the range of 175,000 to 200,000 ounces, primarily reflecting the continued improvement in mill recoveries. Year-to-date, additional cost pressures emerged as discussed above. Rising oil prices continue to be partially mitigated by the existing hedge program. The Company expects higher power costs to persist, compared to 2021, due to links to the price of gold and oil. The collective labour agreement expired in August 2022 and negotiations for a new agreement have continued, although in the past, these have been prolonged and, at times, disruptive to the operations.
Brownfield Exploration
Approximately 25,000 metres of diamond and RC drilling is planned in 2022 to improve resource confidence, target resource expansions and continue to explore high priority exploration targets on the Rosebel, Saramacca, and surrounding concessions, of which approximately 13,250 metres was completed in the first three quarters of 2022.
Euro Ressources Royalty
EURO Ressources (“EURO”) is a French mining royalty and streaming company listed on the NYSE Euronext of Paris stock exchange under the symbol EUR. EURO's main assets are a 10% royalty on the Rosebel Gold Mine production (excluding Saramaca) in Suriname (the “Rosebel royalty”), a silver stream from a subsidiary of Orezone Gold Corporation, a royalty on the Paul Isnard concessions and marketable securities. IAMGOLD owns 90% of EURO, makes quarterly royalty payments to EURO and receives annual dividends from EURO, net of income taxes in France and withholding taxes. The Rosebel royalty payments from IAMGOLD apply to the first seven million ounces of gold production from Rosebel and are calculated using Afternoon London Price less approximately $300 to $350 per ounce. As of September 30, 2022, Rosebel had produced 5.6 million ounces of gold and 1.4 million ounces of gold remain under the Rosebel royalty agreement.
Exploration
In the third quarter 2022, expenditures for exploration and project studies totaled $6.9 million compared with $11.2 million in the prior quarter and $12.2 million in the same prior year period, of which $5.4 million was expensed and $1.5 million was capitalized. During the first three quarters of 2022, drilling activities on active projects and mine sites totaled approximately 108,000 metres. For additional information regarding the brownfield and greenfield exploration projects, see "Quarterly Updates". The Company's exploration expenditures guidance for 2022 is $35 million.
| | | | | | | | | | | | | | | | | |
| | |
| | | | | |
| ($ millions) | Q3 2022 | Q2 2022 | Q3 2021 | YTD 2022 | YTD 2021 |
| Exploration projects – greenfield | $ | 4.8 | | $ | 7.8 | | $ | 7.4 | | $ | 19.5 | | $ | 22.2 | |
Exploration projects – brownfield1 | 2.1 | | 3.4 | | 4.8 | | 8.6 | | 14.0 | |
| | | | | |
| | | | | |
| | | | | |
| $ | 6.9 | | $ | 11.2 | | $ | 12.2 | | $ | 28.1 | | $ | 36.2 | |
1.Exploration projects - brownfield for the third quarter 2022 included near-mine exploration and resource development of $1.5 million (second quarter 2022 - $1.9 million, third quarter 2021 - $2.4 million, YTD 2022 - $5.2 - million, YTD 2021 $7.1 million).
FINANCIAL CONDITION
Liquidity and Capital Resources
As at September 30, 2022, the Company had $535.6 million in cash and cash equivalents, $0.5 million in short-term investments and net debt1 of $409.3 million. Approximately $100.7 million was available under the Company’s secured revolving credit facility (“Credit Facility”) resulting in liquidity1 at September 30, 2022, of approximately $637 million. The Côté Gold UJV required its joint venture partners to fund, in advance, two months of future expenditures. During the third quarter, the Côté UJV amended this requirement to two months from three months. The Company uses dividends and intercompany loans to repatriate funds from its operations and the timing of dividends may impact the timing and amount of required financing, including the Company's drawdowns under the Credit Facility. As at September 30, 2022, $237.8 million of cash and cash equivalents was held by Côté Gold and Essakane. The company has funded its portion of the Côté UJV funding cash generated from its operations and drawdowns on the Credit Facility. Restricted cash in support of environmental closure costs obligations related to Essakane, Doyon division and Côté Gold project totaled $47.2 million. The following sets out the changes in cash balance from June 30, 2022 to September 30, 2022 and December 31, 2021 to September 30, 2022:
_____________________________
1.This is a non-GAAP financial measure. See "Non-GAAP Financial Measures".
| | | | | |
IAMGOLD CORPORATION Third Quarter 2022 Management’s Discussion and Analysis | 20 |
Current assets as at September 30, 2022, were $1,001.2 million, up $50.1 million compared with December 31, 2021. The increase was due to higher inventories ($46.9 million) and receivables and other current assets ($19.6 million), offset by lower cash and cash equivalents and short term investments ($16.4 million). Current liabilities as at September 30, 2022, were $499.5 million, down $82.2 million compared with December 31, 2021. The decrease was due to a decrease in the current portion of deferred revenue ($141.4 million) in connection with the Company’s 2019 gold sale prepayment arrangement (the “2019 Prepay Arrangement”) being recognized in revenue as it settles in equal monthly physical gold deliveries of 12,500 ounces in 2022, partially offset by an increase in accounts payable and accrued liabilities ($42.6 million) primarily related to Côté Gold and income taxes payable ($12.6 million).
The following table summarizes the Company's long-term debt:
| | | | | | | | | | | |
| September 30 | June 30 | December 31 |
($ millions)1 | 2022 | 2022 | 2021 |
| Credit Facility | $ | 380.0 | | $ | 150.0 | | $ | — | |
| 5.75% senior notes | 447.5 | | 447.4 | | 445.7 | |
| Equipment loans | 17.1 | | 14.6 | | 18.7 | |
| $ | 844.6 | | $ | 612.0 | | $ | 464.4 | |
1.Long-term debt does not include leases of $78.9 million as at September 30, 2022 (June 30, 2022 - $62.0 million; December 31, 2021 - $65.6 million).
1.Includes principal and interest payments for the credit facility, 5.75% senior notes and equipment loans and does not include the repayment of the 2019 Prepay Arrangement and the 2022 Prepay Arrangements (defined below) which will be physically settled in 2022 and 2024, respectively, and leases.
| | | | | |
IAMGOLD CORPORATION Third Quarter 2022 Management’s Discussion and Analysis | 21 |
Credit Facility
The Company has a $500 million Credit Facility, which was entered into in December 2017 and amended including in February 2021, to primarily extend the maturity date from January 31, 2023, to January 31, 2025, for $490 million of the available credit. During the nine months ended September 30, 2022, the Company drew down $380 million on the Credit Facility. As at September 30, 2022, the Company had letters of credit in the amount of $19.3 million issued under the Credit Facility to guarantee certain environmental indemnities and $100.7 million was available under the Credit Facility.
The Credit Facility provides for an interest rate margin above London Interbank Offered Rate, banker’s acceptance prime rate and base rate advances which vary, together with fees related thereto, according to the total Net Debt to EBITDA ratio of the Company. The Credit Facility is secured by certain of the Company's real assets, guarantees by certain of the Company’s subsidiaries and pledges of shares of certain of the Company's subsidiaries. The key terms of the Credit Facility include certain limitations on incremental debt, certain restrictions on distributions and financial covenants including Net Debt to EBITDA and Interest Coverage. The Company entered into an amendment in conjunction with entering into a definitive agreement to sell its interests in the Rosebel mine where the lenders under the credit facility provided consent to release their security over the Rosebel mine at the close of the transaction. The amendment requires that the proceeds from the sale be used for funding the Côté Gold project with certain exceptions.
Senior notes
In September 2020, the Company completed the issuance of $450 million of senior notes at face value with an interest rate of 5.75% per annum (the "Notes"). The Notes are denominated in U.S. dollars and mature on October 15, 2028. Interest is payable in arrears in equal semi-annual installments on April 15 and October 15 of each year, beginning on April 15, 2021, in the amount of approximately $12.9 million for each payment. The Notes are guaranteed by certain of the Company's subsidiaries. The Company incurred transaction costs of $7.5 million which have been capitalized and offset against the carrying amount of the Notes within long-term debt in the consolidated balance sheets and are being amortized using the effective interest rate method.
Leases
At September 30, 2022, the Company had lease obligations of $78.9 million at a weighted average borrowing rate of 5.64%.
On April 29, 2022, the Company, on behalf of the Côté Gold UJV, entered into a master lease agreement with Caterpillar Financial Services Limited to lease certain mobile equipment, expected to be delivered over the course of 2022 and 2023, with a value of approximately $125 million. In connection therewith, SMM entered into a guarantee of 30% of the obligations under such agreement, reflecting its pro rata interest in the Côté Gold UJV. IFRS requires that the Company recognize 100% of the Côté Gold UJV lease liability and right-of-use assets on its balance sheet, including the $5.3 million portion guaranteed by SMM that represents their 30% ownership in the unincorporated joint venture.
Equipment loans
At September 30, 2022, the Company had equipment loans with a carrying value of $17.1 million secured by certain mobile equipment, with interest rates between 5.23% and 5.95% which mature in 2024. The equipment loans are carried at amortized cost on the consolidated balance sheets. On March 31, 2022, the Company entered into an amendment to increase the equipment loan facility by $6.2 million on similar terms. The equipment loan facility has an availability period of six months and it has been fully drawn as at September 30, 2022.
Prepay arrangements
During 2019, the Company entered into the 2019 Prepay Arrangement with a collar range of $1,300 to $1,500 per ounce at a cost of 5.38% per annum. Pursuant to the 2019 Prepay Arrangement, the Company received a cash prepayment of $169.8 million in December 2019 in exchange for delivering 150,000 gold ounces in 2022. During the nine months ended September 30, 2022, 112,500 ounces were delivered into the 2019 Prepay Arrangement and the Company received $22.5 million in cash in relation to the collar.
During 2021, the Company entered into gold sale prepayment arrangements (the "2022 Prepay Arrangements") at a weighted average cost of 4.45% per annum in respect of 150,000 gold ounces. These arrangements have an average forward contract price of $1,753 per ounce on 50,000 gold ounces and a collar range of $1,700 to $2,100 per ounce on 100,000 gold ounces. This will result in a total prepayment to the Company of $236 million over the course of 2022 and the requirement on the part of the Company to physically deliver such ounces over the course of 2024. The 2022 Prepayment Arrangements have the effect of rolling the 2019 Prepay Arrangement from 2022 to 2024 after the completion of the construction of Côté Gold. The Company received $177.0 million during the nine months ended September 30, 2022 pursuant to the 2022 Prepay Arrangements.
Surety bonds and performance bonds
As at September 30, 2022, the Company had (i) C$215.8 million ($156.9 million) of surety bonds, issued pursuant to arrangements with insurance companies, in support of environmental closure costs obligations related to the Doyon division and Côté Gold and (ii) C$39.1 million ($28.5 million) of performance bonds in support of certain obligations related to the construction of Côté Gold.
The Company expects that the surety bonds in support of the Doyon division will have to be increased to support the updated environmental closure cost obligations in the updated closure plan once such closure plan has been approved by the applicable regulatory authorities.
During the third quarter, the Company posted $30.2 million of security for certain of the surety bonds. $10.9 million was posted as cash collateral and $19.3 million was posted through the issuance of a letter of credit under the Credit Facility. The balance of $126.7 million remains uncollateralized.
| | | | | |
IAMGOLD CORPORATION Third Quarter 2022 Management’s Discussion and Analysis | 22 |
Derivative contracts
In addition to the gold sale prepayment arrangements noted above, and in order to mitigate volatility during the construction of Côté Gold, the Company entered into certain derivative contracts in respect of certain of its future gold sales and exchange rates. In addition, the Company manages certain other commodities exposure such as oil through derivatives. See "Market Risk – Summary of Hedge Portfolio" for information relating to the Company’s outstanding derivative contracts including the derivative contracts associated with Côté Gold.
Liquidity Outlook
The remaining attributable spend to complete the construction of the Côté Gold project is estimated to be between $1.0 and $1.1 billion from October 1, 2022, net of leases and working capital (see “Côté Gold Project”). At September 30, 2022, the Company had $536.1 million in cash, cash equivalents and short-term investments (compared to $452.9 million at June 30, 2022) and $100.7 million available for draw down under the Credit Facility. The Côté Gold UJV requires its joint venture partners to fund, in advance, two months of future expenditures. The Company uses dividends and intercompany loans to repatriate funds from its operations and the timing of dividends may impact the timing and amount of required financing, including the Company's drawdowns under the Credit Facility. As at September 30, 2022, $237.8 million of cash and cash equivalents was held by Côté Gold and Essakane.
On October 18, 2022, the Company announced that it had entered into a definitive agreement with Zijin Mining Group Co. Ltd. to sell its interests in the Rosebel mine for cash consideration of $360 million plus working capital adjustments on closing. The transaction is expected to close in the first quarter 2023 or earlier.
Based on the information currently available and prevailing market conditions, which impact project expenditures and operating cash flows, the Company will require additional liquidity in 2023, in addition to the proceeds expected to be received from the sale of Rosebel, to complete construction of the Côté Gold project and continues to seek a financing plan by the end of the year. The Company is actively pursuing various alternatives to increase its liquidity and capital resources including additional secured debt and/or royalties and streams, which could be provided by banks, private capital providers and/or institutional investors and specialist streaming or royalty companies, additional unsecured debt including unsecured and/or convertible notes, sales of common shares and the extension of the 2022 Prepay Arrangement. In addition, the Company continues to progress its strategic alternatives with respect to certain of its development and exploration assets in South America and West Africa (excluding Essakane), that may include the disposition of all or an interest in one or more of such assets.
There can be no assurance that the Company will be successful in achieving financing solutions in time and/or on terms acceptable to the Company or that the strategic evaluations discussed above will result in a transaction. In this case and in order to execute its plans for the foreseeable future, including financing alternatives, the Company has developed certain potential alternatives to defer or reduce its capital spending and various other expenditures. These alternatives may impact future operating and financial performance and/or could extend the Côté Gold project construction timeline and significantly increase project costs, and/or dilute the Company's interest in the Côté Gold project. Reductions in capital expenditures at the Côté Gold project requires approval from the Côté UJV oversight committee.
The Company’s financial results are highly dependent on the price of gold, oil and foreign exchange rates and future changes in these prices will, therefore, impact performance. The Company will be dependent on the cash flows generated from the Côté Gold project to eventually repay its existing and any additional indebtedness that it may incur to fund the remaining construction costs of the Côté Gold project. Readers are encouraged to read the “Caution Regarding Forward Looking Statements” and the “Risk Factors” sections contained in the Company’s 2021 Annual Information Form, which is available on SEDAR at www.sedar.com and the “Caution Regarding Forward Looking Statements” and “Risk and Uncertainties” section of the MD&A.
Contractual Obligations
As at September 30, 2022, contractual obligations with various maturities were approximately $2.1 billion, primarily comprising expected future contractual payments of long-term debt including principal and interest, purchase obligations, capital expenditures obligations, asset retirement obligations and lease obligations, partially offset by cash collateralized letters of credit and restricted cash in support of environmental closure cost obligations for certain mines. Management believes these obligations will be met through available cash resources and net cash from operating activities. The Company entered into derivative contracts for risk management purposes. These derivative contracts are not included in the contractual obligations. Details of these contracts are included in "Market Risk – Summary of Hedge Portfolio".
| | | | | |
IAMGOLD CORPORATION Third Quarter 2022 Management’s Discussion and Analysis | 23 |
Cash Flow
| | | | | | | | | | | | | | | | | |
| | |
| ($ millions) | Q3 2022 | Q2 2022 | Q3 2021 | YTD 2022 | YTD 2021 |
| Net cash from (used in) per consolidated interim financial statements: | | | | | |
| Operating activities | $ | 117.7 | | $ | 81.9 | | $ | 78.5 | | $ | 341.9 | | $ | 217.5 | |
| Investing activities | (228.9) | | (269.2) | | (142.4) | | (658.6) | | (367.4) | |
| Financing activities | 217.4 | | 129.9 | | (11.4) | | 339.8 | | (41.6) | |
| Effects of exchange rate fluctuation on cash and cash equivalents | (21.7) | | (11.0) | | (7.5) | | (32.4) | | (7.9) | |
| Increase (decrease) in cash and cash equivalents | 84.5 | | (68.4) | | (82.8) | | (9.3) | | (199.4) | |
| | | | | |
| | | | | |
| Cash and cash equivalents, beginning of the period | 451.1 | | 519.5 | | 824.9 | | 544.9 | | 941.5 | |
| | | | | |
| | | | | |
| Cash and cash equivalents, end of the period | $ | 535.6 | | $ | 451.1 | | $ | 742.1 | | $ | 535.6 | | $ | 742.1 | |
Operating Activities
Net cash from operating activities for the third quarter 2022 was $117.7 million, an increase of $35.8 million from the prior quarter, primarily due to decrease in income taxes paid ($22.4 million) and a net inflow in non-cash working capital movements ($20.9 million), partially offset by lower net cash earnings ($5.2 million) and lower settlement of derivatives ($1.7 million).
The third quarter 2022 movements in non-cash working capital items and non-current stockpiles resulted in an inflow of $8.9 million and included:
•A decrease in receivables and other current assets balance ($5.7 million), primarily due to receipts for value added taxes and a decrease in prepaid expense;
•An increase in accounts payable and accrued liabilities balance ($23.5 million), primarily due to timing of payment of suppliers; and
•A decrease in inventories and non-current ore stockpiles balance ($20.3 million), due to increase in supplies inventory.
Compared with the third quarter 2021, the increase of $39.2 million in net cash from operating activities was primarily due to proceeds from the 2022 Prepay Arrangements ($59.0 million) and an increase in movements in non-cash working capital items and non-current ore stockpiles ($10.0 million), partially offset by lower net cash earnings ($24.7 million) and lower proceeds from insurance claim ($7.7 million).
Net cash from operating activities for YTD 2022 was $341.9 million, an increase of $124.4 million from the same prior year period, primarily due to proceeds from 2022 Prepay Arrangements ($177.0 million) and an increase of cash inflows from the settlement of derivatives ($21.9 million), partially offset by lower net cash earnings ($48.9 million), an increase in income taxes paid ($21.1 million), and a decrease in proceeds from insurance claim ($9.5 million).
Investing Activities
Net cash used in investing activities for the third quarter 2022 was $228.9 million, a decrease of $40.3 million from the prior quarter, primarily due to a decrease in capital expenditures for property, plant and equipment ($26.1 million) mainly related to the Cóté Gold construction and timing of financing costs paid and capitalized as borrowing costs ($9.8 million).
Compared with the third quarter 2021, net cash used in investing activities increased by $86.5 million, primarily due to an increase in capital expenditures for property, plant and equipment ($90.9 million) mainly related to the Cóté Gold construction and an increase in restricted cash ($10.9 million) related to the posting of security for surety bonds, partially offset by proceeds from the disposal of marketable securities ($15.2 million).
Net cash used in investing activities for YTD 2022 was $658.6 million, an increase of $291.2 million from the same prior year period, primarily due to an increase in capital expenditures for property, plant and equipment ($261.1 million) mainly related to the Cóté Gold construction and an increase in financing costs paid and capitalized as borrowing costs ($8.8 million), partially offset by proceeds from the disposal of marketable securities ($25.1 million). The Company received proceeds from the sale of non-core royalties ($45.9 million) during the same prior year period.
Financing Activities
Net cash from financing activities in the third quarter 2022 was $217.4 million, an increase of $87.5 million from the prior quarter, primarily due to proceeds from the Credit Facility drawdowns ($80.0 million), proceeds from the equipment loans ($4.6 million), and decrease in dividends paid to non-controlling interest ($4.8 million) on the declaration of dividends from subsidiaries.
Compared with the third quarter 2021, net cash from financing activities increased by $228.8 million, primarily due to proceeds from the Credit Facility drawdowns ($230.0 million), proceeds from the equipment loans ($5.3 million), partially offset by an increase in dividends paid to the non-controlling interest ($3.7 million).
Net cash from financing activities for YTD 2022 was $339.8 million, an increase of $381.4 million from the same prior year period, primarily due to proceeds from the Credit Facility drawdowns ($380.0 million).
| | | | | |
IAMGOLD CORPORATION Third Quarter 2022 Management’s Discussion and Analysis | 24 |
Mine-Site Free Cash Flow1
Third quarter 2022 mine site free cash flow was $59.2 million, up $16.4 million, from the prior quarter, primarily due to higher free cash flow at Essakane ($20.2 million) and Westwood ($9.2 million) due to higher sales volume, partially offset by lower free cash flow at Rosebel ($13.0 million) primarily due to changes in working capital and lower average realized gold price.
Third quarter 2022 mine site free cash flow was $59.2 million, up $27.3 million from the same prior year period, primarily due to higher free cash flow at Essakane ($18.7 million) and Westwood ($7.9 million) due to higher sales volume and changes in working capital, partially offset by lower average realized gold price and the impact of inflation. Free cash flow at Rosebel ($0.7 million) was in line with the same prior year period.
Market Trends
Global Financial Market Conditions and Gold Price
The spot price of gold at the end of the third quarter 2022 was $1,672 per ounce and gold traded in a range of $1,622 to $1,811 per ounce during the third quarter 2022.
The price of gold is a key driver of the Company’s profitability. The average and closing spot gold price and the Company’s average realized gold price are set out below. The Company’s hedging strategy is designed to mitigate gold price risk during the Côté Gold construction period. See "Market Risk" for more information.
| | | | | | | | | | | | | | | | | | | |
| | | | |
| | | | | | | |
| | | Q3 2022 | Q2 2022 | Q3 2021 | YTD 2022 | YTD 2021 |
| Average market gold price ($/oz) | | | $ | 1,729 | | $ | 1,871 | | $ | 1,790 | | $ | 1,824 | | $ | 1,800 | |
Average realized gold price1,2 ($/oz) | | | $ | 1,690 | | $ | 1,799 | | $ | 1,787 | | $ | 1,766 | | $ | 1,788 | |
| Closing market gold price ($/oz) | | | $ | 1,672 | | $ | 1,817 | | $ | 1,743 | | $ | 1,672 | | $ | 1,743 | |
1.This is a non-GAAP financial measure. See "Non-GAAP Financial Measures".
2.Excluding the impact of the 2019 Prepay Arrangement the average realized gold price was $1,735 for the third quarter 2022, $1,873 for the second quarter 2022 and $1,829 for YTD 2022.
Inflation
Inflation continues to have an impact on the business. Supply demand imbalances and the Russian invasion of Ukraine continue to be contributing factors causing inflation. While the above-mentioned are important, the relationship between monetary policy and inflation has become increasingly evident as central banks are raising benchmark rates to curb inflation. In the U.S., the Fed hiked the funds rate by 75 bps in September. This is the third consecutive 75 bps rate hike approved by the Fed, bringing the benchmark lending rate target range to 3% to 3.25%. It is the highest fed rate since the 2008 financial crisis.
Currency and Oil Prices
The U.S. dollar is the Company’s functional currency. The Company's revenues are primarily denominated in U.S. dollars. The Company’s main exposures are to the Canadian dollar, euro and oil prices.
The Company's Canadian dollar exposures relate to operational and capital expenditures in Canada. The Company’s hedging strategy was designed to mitigate the risk of exposure to exchange rate volatility of the Canadian dollar. See "Market Risk".
The Company's euro exposures relate to operational and capital expenditures in West Africa. The Company sells a portion of its gold in euros to partially mitigate its exposures.
The Company's oil exposures relate primarily to its mining operations in West Africa and South America. The Company’s hedging strategy was designed to mitigate the risk of oil price appreciation given it is a significant input cost in the production of gold. See "Market Risk".
_____________________________
1.This is a non-GAAP financial measure. See "Non-GAAP Financial Measures".
| | | | | |
IAMGOLD CORPORATION Third Quarter 2022 Management’s Discussion and Analysis | 25 |
| | | | | | | | | | | | | | | | | | | |
| | | |
| | | | | | | |
| | | Q3 2022 | Q2 2022 | Q3 2021 | YTD 2022 | YTD 2021 |
| Average rates | | | | | | | |
| USDCAD | | | 1.3063 | | 1.2767 | | 1.2594 | | 1.2834 | | 1.2513 | |
| EURUSD | | | 1.0067 | | 1.0647 | | 1.1787 | | 1.0638 | | 1.1961 | |
| Closing rates | | | | | | | |
| USDCAD | | | 1.3751 | | 1.2871 | | 1.2674 | | 1.3751 | | 1.2674 |
| EURUSD | | | 0.9787 | | 1.0468 | | 1.1578 | | 0.9787 | | 1.1578 |
| Average Brent price ($/barrel) | | | $ | 98 | | $ | 105 | | $ | 73 | | $ | 102 | | $ | 68 | |
| Closing Brent price ($/barrel) | | | $ | 88 | | $ | 115 | | $ | 79 | | $ | 88 | | $ | 79 | |
| Average WTI price ($/barrel) | | | $ | 91 | | $ | 109 | | $ | 71 | | $ | 98 | | $ | 65 | |
| Closing WTI price ($/barrel) | | | $ | 79 | | $ | 106 | | $ | 75 | | $ | 79 | | $ | 75 | |
Sensitivity Impact
The following table provides estimated cost per ounce sensitivities around certain inputs, excluding the impact of the Company’s hedging program which can affect the Company’s operating results, assuming guided 2022 production and costs levels:
| | | | | | | | | | | | | | |
| Change of | Annualized impact on Cost of Sales $/oz | Annualized impact on Cash Costs1 $/oz | Annualized impact on AISC1 $/oz |
Gold price2 | $100/oz | $6 | $6 | $6 |
| Oil price | $10/barrel | $15 | $15 | $18 |
| USDCAD | $0.10 | $20 | $20 | $30 |
| EURUSD | $0.10 | $15 | $15 | $23 |
1.This is a non-GAAP financial measure. See "Non-GAAP Financial Measures". Cash costs and AISC per ounce of gold sold consist of Essakane, Rosebel and Westwood on an attributable basis of 90%, 95% and 100%, respectively.
2.Gold price sensitivities include royalties and additional costs with a gold price link, which are included in total cost of sales, cash costs and AISC.
Market Risk
Market risk is the risk that the fair value or future cash flows of a financial instrument will fluctuate because of changes in market prices. For hedging activities, it is the risk that the fair value of a derivative might be adversely affected by a change in underlying commodity prices or currency exchange rates and that this in turn affects the Company’s financial condition. The Company establishes trading agreements with counterparties under which there is no requirement to post any collateral or make any margin calls on derivatives. Counterparties cannot require settlement solely because of an adverse change in the fair value of a derivative.
Currency Exchange Rate Risk
The Company’s functional currency is the U.S. dollar which creates currency exchange risk exposure primarily associated with its expenditures denominated in Canadian dollars and euros. To manage this risk, the Company uses various hedging strategies, including holding some of its cash and cash equivalents in Canadian dollar or euro denominated bank accounts creating a natural off-set to the exposure and derivative contracts such as forwards or options. Option contracts can be combined through the use of put option contracts and call option contracts (collar structure), within a range of expiry dates and strike prices.
Oil Contracts and Fuel Market Price Risk
Brent and West Texas Intermediate (“WTI”) are components of diesel and fuel oil which are among the key inputs impacting the Company’s costs. To manage the risk associated with the fluctuation in the costs of these commodities, the Company uses various hedging strategies, such as the use of options. Option contracts can be combined through the use of put option contracts and call option contracts (collar structure), within a range of expiry dates and strike prices.
Gold Contracts and Market Price Risk
The Company’s primary source of revenue is gold. The Company’s hedging strategy is designed to mitigate gold price risk during the Côté Gold construction period. To manage such risk, the Company uses various hedging strategies, such as the use of call option contracts. Option contracts can also include put option contracts and call option contracts (collar structure), within a range of expiry dates and strike prices.
| | | | | |
IAMGOLD CORPORATION Third Quarter 2022 Management’s Discussion and Analysis | 26 |
Summary of Hedge Portfolio
At September 30, 2022, the Company’s outstanding foreign currency and oil derivative contracts were as follows:
| | | | | | | | | | | | | | | |
| 2022 | | 2023 | 2024 | | | |
Foreign Currency1,5 | | | | | | | |
| | | | | | | |
Canadian dollar contracts2 (millions of C$) | 183 | | 425 | 163 | | | |
| Rate range (USDCAD) | 1.28 — 1.48 | | 1.30 — 1.46 | 1.32 | | | |
Hedge ratio3 | 60% | | 30% | 20% | | | |
| | | | | | | |
| | | | | | | |
| | | | | | | |
| | | | | | | |
| | | | | | | |
| | | | | | | |
Commodities4 | | | | | | | |
| Brent oil contracts (thousands of barrels) | 130 | | 428 | 270 | | | |
| Contract price range ($/barrel of crude oil) | 50 — 65 | | 41 — 65 | 41 — 55 | | | |
Hedge ratio3 | 70% | | 56% | 36% | | | |
| | | | | | | |
| WTI oil contracts (thousands of barrels) | 145 | | 473 | 270 | | | |
| Contract price range ($/barrel of crude oil) | 38 — 62 | | 36 — 60 | 38 — 50 | | | |
Hedge ratio3 | 81% | | 64% | 39% | | | |
| | | | | | | |
| | | | | | | |
| | | | | | | |
| | | | | | | |
| | | | | | | |
1.2022 Canadian dollar hedges excludes Canadian dollars on hand which functions as a natural hedge for the Company’s 2022 Canadian dollar expenditures.
2.The Company previously executed Canadian dollar collar options, which consist of Canadian dollar call and put options within the given range in 2022 through 2024. The Company will recognize a gain from the difference between a lower market price and the Canadian dollar call strike price. The Company will incur a loss from the difference between a higher market price and the Canadian dollar put strike price. 2022 includes the TARF and forwards with an extension feature discussed below. The Company estimates the timing of future knockouts on the TARF occurring based on analyst consensus estimates for foreign exchange rates. Includes hedged exposure at Côté Gold in 2022, 2023 and 2024, with a hedge ratio of 80%, 40% and 33%, respectively.
3.The Company calculates hedge ratios based on future estimates of operating and capital expenditures (such as its Canadian dollar operating and capital expenditures at Westwood and its corporate office, and Canadian dollar capital expenditures at Côté Gold during the construction period, future estimated uses of commodities and future estimated production. Outstanding derivative contracts are allocated based on a specified allocation methodology.
4. The Company previously executed Brent and WTI collar options, which consist of Brent and WTI put and call options with strike prices within the given range in 2022 through 2024. The Company will incur a loss from the difference between a lower market price and the put strike price. The Company will recognize a gain from the difference between a higher market price and the call strike price. Includes hedged exposure for WTI at Côté Gold in 2022 and 2023, with a hedge ratio of 74% and 30%, respectively
5. The Company executed subsequent to the quarter end additional USDCAD forward contracts at an average rate of $1.362 for CAD$100 million.
In connection with the construction of Côté Gold, the Company entered into a TARF structure as part of its strategy to manage exposure to the Canadian dollar. The Company has not designated the TARF financial derivative contract as a hedge for accounting purposes, although the Company does consider this arrangement to be an effective economic hedge. The derivative structure includes a termination feature as well as a leverage component. Contractual terms of the TARF include the following:
•There are four underlying contracts with strike prices ranging from 1.30 to 1.31.
•On any monthly option fixing date, if the USDCAD exchange rate is below the strike price, the Company expects to exercise its option and deliver $7.7 million and receive CAD$10 million.
•On any monthly option fixing date, if the USDCAD exchange rate is above the strike price, the Company expects that the counterparty will exercise its option in which case the Company will deliver $15.3 million and receive CAD$20 million.
•The term of the arrangement is 30 months from January 2022 to June 2024. If the contract is exercised for a total of 12 times when the USDCAD is below the strike price, the arrangement will terminate. Each of the four contracts were exercised from January to May and July to August while the USDCAD was below the strike price. Three of the four contracts were exercised in June. None of the four contracts were exercised in September and October. This results in three contracts having four knockouts remaining and one contract having five knockouts remaining.
•The Company realized a gain (loss) for the three and nine months ended September 30, 2022, of $(0.2) million and $1.4 million, respectively, on the TARF which is included in interest income, derivatives and other investment gains (losses) in the consolidated statements of earnings (loss).
In connection with the construction of Côté Gold, the Company entered a forward contract with an extendable feature to purchase CAD$10 million per month during 2022 for a total of $120 million at a forward exchange rate of 1.32 USDCAD. The counterparty has an option, at its sole discretion, to extend the contract for twelve months, which would require the Company to purchase CAD$10 million per month during 2024 at the forward exchange rate. The option expires in November 2023. The Company realized a gain for the three and nine months ended September 30, 2022, of $0.3 million and $2.4 million, respectively, on this contract which is included in interest income, derivatives and other investment gains (losses) in the consolidated statements of earnings (loss).
| | | | | |
IAMGOLD CORPORATION Third Quarter 2022 Management’s Discussion and Analysis | 27 |
At September 30, 2022, the Company’s outstanding gold bullion contracts and gold sale prepayment arrangements were as follows:
| | | | | | | | | | | | | | | | | | |
| Put | Call | 2022 | | 2023 | 2024 |
| Weighted average $/ounce | Thousands of ounces |
| | | | | | |
| Zero cost collars | 1,704 | 2,297 | 10 | | 93 | — |
| Zero cost collars | 1,850 | 1,990 | — | | 75 | — |
| Zero cost collars | 1,850 | 2,175 | — | | 15 | — |
| Zero cost collars | 1,850 | 2,191 | — | | 15 | — |
| Subtotal gold bullion contracts | | | | | | |
| | | | | | |
| | | | | | |
| | | | | | |
| | | | | | |
| | | | | | |
| | | | | | |
| 2019 Prepay Arrangement | 1,300 | 1,500 | 38 | | — | — |
| 2022 Prepay Arrangements – collar | 1,700 | 2,100 | — | | — | 100 |
| 2022 Prepay Arrangements – forward | 1,753 | — | — | | — | 50 |
| Subtotal gold sale prepay arrangements | — | — | 38 | | — | 150 |
| | | | | | |
Total1 | — | — | 48 | | 198 | 150 |
| | | | | | |
| | | | | | |
| | | | | | |
| | | | | | |
| | | | | | |
| | | | | | |
| | | | | | |
1.The Company executed gold collar options, which consist of gold put and call options with strike prices within the given range in 2022 and 2023. The Company will incur a loss from the difference between a higher market price and the call strike price. The Company will recognize a gain from the difference between a lower market price and the put strike price. In the first quarter, the Company executed gold collar options with an average price range of $1,850 to $1,990 for 75,000 ounces. The Company executed additional gold collar options in the second quarter with an average price range of $1,850 to $2,183 for 30,000 ounces.
The Company’s cost metrics were impacted as follows by realized derivative gains and losses:
| | | | | | | | | | | | | | | | | | | |
| Q3 2022 | Q2 2022 | Q3 2021 | YTD 2022 | YTD 2021 | | |
| | | | | | | |
| Cost of sales per ounce sold before hedging | $ | 1,179 | | $ | 1,194 | | $ | 1,270 | | $ | 1,151 | | $ | 1,171 | | | |
| Realized derivative gains per ounce sold | 40 | | 64 | | 22 | | 49 | | 14 | | | |
| Cost of sales per ounce sold | $ | 1,140 | | $ | 1,130 | | $ | 1,247 | | $ | 1,102 | | $ | 1,157 | | | |
| | | | | | | |
| Cash cost per ounce sold before hedging | $ | 1,166 | | $ | 1,183 | | $ | 1,268 | | $ | 1,136 | | $ | 1,169 | | | |
| Realized derivative gains per ounce sold | 40 | | 64 | | 22 | | 49 | | 14 | | | |
| Cash cost per ounce sold | $ | 1,126 | | $ | 1,119 | | $ | 1,245 | | $ | 1,087 | | $ | 1,155 | | | |
| | | $ | — | | | | | |
| AISC per ounce sold before hedging | $ | 1,599 | | $ | 1,670 | | $ | 1,535 | | $ | 1,601 | | $ | 1,407 | | | |
| Realized derivative gains per ounce sold | 40 | | 66 | | 27 | | 51 | | 20 | | | |
| AISC per ounce sold | $ | 1,559 | | $ | 1,604 | | $ | 1,508 | | $ | 1,550 | | $ | 1,387 | | | |
| | | | | | | |
| | | | | | | |
| | | | | | | |
| | | | | | | |
Figures may not be calculated based on amounts presented in this table due to rounding.
Shareholders' Equity
| | | | | | | | |
| Number issued and outstanding (millions) | September 30, 2022 | November 7, 2022 |
| Common shares | 479.0 | | 479.0 | |
Options1 | 4.8 | | 4.8 | |
1.Refer to note 26 of the consolidated interim financial statements for all outstanding equity awards.
QUARTERLY FINANCIAL REVIEW
| | | | | | | | | | | | | | | | | | | | | | | | | | | | | | | | | | | |
| 2022 | 2021 | 2020 | | | |
| ($ millions, except where noted) | Q3 | Q2 | Q1 | Q4 | Q3 | Q2 | Q1 | Q4 | | | |
| Revenues | $ | 343.3 | | $ | 334.0 | | $ | 356.6 | | $ | 294.6 | | $ | 294.1 | | $ | 265.6 | | $ | 297.4 | | $ | 347.5 | | | | |
Net earnings (loss) from continuing operations1 | $ | (109.9) | | $ | (3.5) | | $ | 31.8 | | $ | (204.0) | | $ | (72.5) | | $ | (0.3) | | $ | 21.7 | | $ | 68.0 | | | | |
| Net earnings from discontinued operations | $ | — | | $ | — | | $ | — | | $ | — | | $ | — | | $ | — | | $ | — | | $ | 4.1 | | | | |
| | | | | | | | | | | |
| Net earnings (loss) attributable to equity holders | $ | (108.3) | | $ | (9.6) | | $ | 23.8 | | $ | (194.1) | | $ | (75.3) | | $ | (4.5) | | $ | 19.5 | | $ | 63.1 | | | | |
| Basic and diluted earnings (loss) per share attributable to equity holders | $ | (0.23) | | $ | (0.02) | | $ | 0.05 | | $ | (0.41) | | $ | (0.16) | | $ | (0.01) | | $ | 0.04 | | $ | 0.13 | | | | |
| | | | | | | | | | | |
1.In the third quarter 2022 and the fourth quarter 2021, net losses from continuing operations were higher primarily due to impairment charges recorded in respect of Rosebel.
| | | | | |
IAMGOLD CORPORATION Third Quarter 2022 Management’s Discussion and Analysis | 28 |
DISCLOSURE CONTROLS AND PROCEDURES AND INTERNAL CONTROL OVER FINANCIAL REPORTING
Disclosure Controls and Procedures
The Company’s disclosure controls and procedures are designed to provide reasonable assurance that all relevant information is communicated to senior management to allow timely decisions regarding required disclosure. An evaluation of the effectiveness of the Company’s disclosure controls and procedures, as defined under the rules of the Canadian Securities Administration, was conducted as at December 31, 2021, under the supervision of the Company’s Disclosure Committee and with the participation of management. Based on the results of that evaluation, the Interim CEO and the Interim CFO concluded that the Company’s disclosure controls and procedures were effective as at December 31, 2021, providing reasonable assurance that the information required to be disclosed in the Company’s annual filings, interim filings or other reports filed or submitted by it under securities legislation is recorded, processed, summarized and reported in accordance with securities legislation.
Since the December 31, 2021, evaluation, there have been no material changes to the Company's disclosure controls and procedures and their design remains effective.
Internal Control over Financial Reporting
Internal control over financial reporting is designed to provide reasonable assurance regarding the reliability of the Company’s financial reporting and the preparation of consolidated interim financial statements in compliance with IFRS as issued by the International Accounting Standards Board ("IASB"). The Company’s internal control over financial reporting includes policies and procedures that:
•pertain to the maintenance of records that accurately and fairly reflect the transactions of the Company;
•provide reasonable assurance that transactions are recorded as necessary to permit preparation of consolidated interim financial statements in accordance with IFRS as issued by the IASB;
•ensure the Company’s receipts and expenditures are made only in accordance with authorization of management and the Company’s directors; and
•provide reasonable assurance regarding prevention or timely detection of unauthorized transactions that could have a material effect on the consolidated interim financial statements.
An evaluation of the effectiveness of the Company’s internal control over financial reporting, including an evaluation of material changes that may have materially affected or are reasonably likely to have materially affected the internal controls over financial reporting based on the criteria established in Internal Control - Integrated Framework (2013) issued by the Committee of Sponsoring Organizations of the Treadway Commission, was conducted as of December 31, 2021 by the Company’s management, including the Interim CEO and the Interim CFO. Based on this evaluation, management, including the Interim CEO and the Interim CFO, has concluded that the Company’s internal control over financial reporting was effective as of December 31, 2021.
There have been no material changes in the Company's internal control over financial reporting or in other factors that could affect internal controls during the first nine months of 2022 and their design remains effective.
Limitations of Control and Procedures
The Company’s management, including the Interim CEO and the Interim CFO, believe that any disclosure controls and procedures and internal controls over financial reporting, no matter how well designed, can have inherent limitations. Therefore, even those systems determined to be effective can provide only reasonable assurance that the objectives of the control system are met.
CRITICAL JUDGMENTS, ESTIMATES AND ASSUMPTIONS
The Company’s management makes judgments in its process of applying the Company’s accounting policies in the preparation of its consolidated interim financial statements. In addition, the preparation of financial data requires that the Company’s management make assumptions and estimates of effects of uncertain future events on the carrying amounts of the Company’s assets and liabilities at the end of the reporting period and the reported amounts of revenues and expenses during the reporting period. Actual results may differ from those estimates as the estimation process is inherently uncertain. Estimates are reviewed on an ongoing basis based on historical experience and other factors that are considered to be relevant under the circumstances. Revisions to estimates and the resulting effects on the carrying amounts of the Company’s assets and liabilities are accounted for prospectively.
The Company’s financing plans and certain other potential alternative plans to defer or reduce its capital spending and various other expenditures, in the event it does not achieve its financing plans, and the ability of the Company to execute them involve certain assumptions that represent significant judgment by the Company (see “Liquidity and Capital Resources - Liquidity Outlook”).
The critical judgments, estimates and assumptions applied in the preparation of the Company's consolidated interim financial statements are reflected in note 3 of the Company's audited annual consolidated financial statements for the year ended December 31, 2021.
| | | | | |
IAMGOLD CORPORATION Third Quarter 2022 Management’s Discussion and Analysis | 29 |
Qualified Person and Technical Information
The technical and scientific information relating to exploration activities disclosed in this document was prepared under the supervision of and verified and reviewed by Craig MacDougall, P.Geo., Executive Vice President, Growth, IAMGOLD. Mr. MacDougall is a “qualified person” as defined by NI 43-101.
Data verification involves data input and review by senior project geologists at site, scheduled weekly and monthly reporting to senior exploration management and the completion of project site visits by senior exploration management to review the status of ongoing project activities and data underlying reported results. All drilling results for exploration projects or supporting resource and reserve estimates referenced in this MD&A have been previously reported in news release disclosures either by the Company or the project operator as the case may be (see referenced news releases) and have been prepared in accordance with NI 43-101. The sampling and assay data from drilling programs are monitored through the implementation of a quality assurance - quality control (QA-QC) program designed to follow industry best practice. Drill core (HQ and NQ size) samples are selected by the project geologists and sawn in half with a diamond saw at the project site. Half of the core is typically retained at the site for reference purposes. Generally, sample intervals are 1.0 to 1.5 metres in length and reverse circulation holes are sampled at 1.0 metre intervals at the drill rig. Samples are prepared and analyzed at site for the Company's producing mines and at accredited regional laboratories for the Company's exploration projects, using analysis techniques such as standard fire assay with a 50 gram charge; fire assay with gravimetric finish, or LeachWELL rapid cyanide leach with fire assay with a 50 gram charge.
NEW ACCOUNTING STANDARDS
For a discussion of new accounting standards adopted and new accounting standards issued but not yet effective that may impact the Company, refer to note 3 of the Company’s consolidated interim financial statements.
RISKS AND UNCERTAINTIES
The Company is subject to various business, financial, operational and other risks, uncertainties, contingencies and other factors which could materially adversely affect the Company’s future business, operations, and financial condition and could cause such future business, operations and financial condition to differ materially from the forward-looking statements and information contained in this MD&A and as described under the heading "Cautionary Statement Regarding Forward-Looking Information". Readers of this MD&A should consider the information included or incorporated by reference in this document and the Company’s consolidated interim financial statements and related notes for the three and six months ended June 30, 2022. The nature of the Company’s activities and the locations in which it operates mean that the Company’s business generally is exposed to significant risk factors, known and unknown, many of which are beyond its control. Managing these risks is a key component of the Company’s business strategy and is supported by a risk management culture and an effective enterprise risk management (“ERM”) system. The Company’s view of risks is not static. An important component of the ERM approach is to ensure key risks which are evolving or emerging are appropriately identified, managed and incorporated into existing ERM assessment, measurement, monitoring and reporting processes.
The principal risks and uncertainties to the Company’s business, financial condition, and results of operations that were identified by management as new or elevated in the third quarter 2022 are described above under "Market Risk" and below. Readers are cautioned that no ERM framework or system can ensure that all risks to the Company, at any point in time, are accurately identified, assessed, managed or effectively controlled and mitigated. As such, there may be additional new or elevated risks to the Company in the third quarter 2022 that are not described above under “Market Risk” or below.
For a comprehensive discussion of the risk factors that may affect the Company, its business operations and financial performance, refer to the risk disclosure contained in each of the Company’s annual information form dated February 23, 2022 ("AIF") and supplemented by the consolidated financial statements and the MD&A for the quarter-ended March 31, 2022, as filed with Canadian securities regulatory authorities at www.sedar.com and filed under Form 40-F with the United States Securities Exchange Commission at www.sec.gov, which is hereby incorporated by reference herein.
Security and Political Instability
The political and security environment remains volatile in the Sahel region of Burkina Faso, particularly where the Company’s Essakane mine is located. The country experienced a military coup in January 2022 and a second coup in September. As a result, the Company believes there is an elevated risk to its operations, assets and personnel in the region for the foreseeable future. Supply chains and transit routes on national roads leading to and from the mine site remain particularly exposed to elevated risks of militant attacks. The Company continues to adjust its operating activities in response to the prevailing security situation, including working with the local government, as the safety and security of the Company’s personnel and physical assets are of paramount concern. An actual, potential or threatened terrorist attack on the Essakane mine and/or personnel and/or supplies on travel routes could have a material adverse effect on the Company’s business, operations, and financial condition.
Talent Retention and Attraction
The Company’s ability to effectively manage its operation, exploration and corporate teams depends in large part on its ability to attract, develop and retain the best talent in key roles and as senior leaders within the organization. The Company’s governance model has undergone change during the year leading to both voluntary and involuntary departures in key positions across the organization. Tight labour markets and negative market sentiment regarding the Company’s current liquidity and share price position could impact the Company’s ability in the future to replace certain positions in the areas of mine management, finance and technical services should shortages occur; accordingly, in this event, without adequate personnel in certain roles, the Company’s ability to achieve its results may be compromised.
| | | | | |
IAMGOLD CORPORATION Third Quarter 2022 Management’s Discussion and Analysis | 30 |
Liquidity
The Company’s share of remaining costs to complete construction and bring Côté Gold into production increased and will result in the Company requiring additional financing, in addition to its existing Credit Facility to complete the construction of Côté Gold. The availability of capital to the Company and the cost of capital are subject to general economic conditions and lender and investor interest in the Company and its projects. The cost of capital has increased in recent months due to the ongoing conflict in Ukraine and related inflationary and market pressures. There can be no certainty that the Company will be successful in obtaining additional financing arrangements or any extension of or amendments to its current financing arrangements on terms and/or conditions that are favourable to the Company, or at all. Failure to obtain the financing necessary to execute the Company’s capital expenditure plans may result in a delay or indefinite postponement of exploration, development or production at any or all of the Company’s properties including the development of Côté Gold. A significant increase in the level of indebtedness of the Company could potentially have adverse consequences, including on the Company’s ability to repay its obligations and there can be no assurance that it will be able to continue to do so. If an event of default under the Credit Facility occurs, the Company would be unable to draw down further on the Credit Facility and the lenders could elect to declare all principal amounts outstanding thereunder at such time, together with accrued interest, to be immediately due. An event of default under the Credit Facility may also give rise to an event of default under existing and future debt/financing agreements and, in such an event, the Company may not have sufficient funds to repay amounts owing under such agreements. The inability of the Company to increase its liquidity and capital resources could have a material adverse effect on its business, financial condition and results of operations.
Asset Valuations
At the end of each reporting period, in accordance with IFRS, the Company reviews the carrying amount of its property, plant and equipment, exploration and evaluation assets and cash generating units ("CGUs") to determine whether there is any indication of impairment or reversal of previously recognized impairment. When an indicator is identified, the Company will perform an impairment test. An impairment test requires the Company to determine the recoverable amount of the CGU. The recoverable amount is determined as the higher of the CGU’s fair value less costs of disposal and value-in-use. If the carrying amount of the CGU exceeds its recoverable amount, an impairment charge is recorded against long-lived assets in the CGU.
Should the Company execute some or all of the potential alternatives to defer or reduce its capital spending and various other expenditures as part of its financing plans (see “Liquidity and Capital resources - Liquidity Outlook”), the Company will have to perform a further assessment to determine if there is an indicator of impairment resulting from these plans.
Management uses various assumptions and estimates to determine the recoverable amount of a CGU which are subject to risks and uncertainties, particularly in market conditions where higher volatility exists, and may be partially or totally outside of the Company’s control. Therefore, it is reasonably possible that changes could occur with evolving economic and market conditions, which may affect the fair value of the Company’s property, plant and equipment, exploration and evaluation assets and CGUs resulting in either an impairment charge or reversal of previously recognized impairment. Certain of management’s assumptions and estimates may be subjective and it is possible that actual future cash flows could be significantly different than those estimated.
NON-GAAP1 FINANCIAL MEASURES
The Company uses certain non-GAAP financial measures in its MD&A which are described in the following section. The Company believes that, in addition to conventional financial measures prepared in accordance with IFRS, certain investors use these non-GAAP financial measures to assess the performance of the Company. These non-GAAP financial measures do not have any standardized meaning prescribed by IFRS, may not be comparable to similar measures presented by other companies and should not be considered in isolation or as a substitute for measures of performance prepared in accordance with IFRS. The definitions of these measures, the reconciliation to the amounts presented in the interim consolidated interim financial statements, and the reasons for the presentation of these measures are included below. The non-GAAP financial measures are consistent with those presented previously and there have been no changes to the basis of calculation, except for the change to the presentation of cash cost per ounce sold described in more detail below.
Average Realized Gold Price per Ounce Sold
Average realized gold price per ounce sold is intended to enable management to understand the average realized price of gold sold in each reporting period after removing the impact of non-gold revenues and by-product credits, which, in the Company's case, are not significant and to enable investors to understand the Company’s financial performance based on the average realized proceeds of selling gold production in the reporting period.
| | | | | | | | | | | | | | | | | |
| | |
| | | | | |
| ($ millions, except where noted) | Q3 2022 | Q2 2022 | Q3 2021 | YTD 2022 | YTD 2021 |
| | | | | |
| Revenues | $ | 343.3 | | $ | 334.0 | | $ | 294.1 | | $ | 1,033.9 | | $ | 857.1 | |
| | | | | |
| | | | | |
| By-product credits and other revenues | (0.5) | | (0.9) | | (0.4) | | (1.4) | | (1.0) | |
| Revenues | $ | 342.8 | | $ | 333.1 | | $ | 293.7 | | $ | 1,032.5 | | $ | 856.1 | |
| Sales (000s oz) – 100% | 203 | | 185 | | 165 | | 584 | | 479 | |
Average realized gold price per ounce1,2,3 ($/oz) | $ | 1,690 | | $ | 1,799 | | $ | 1,787 | | $ | 1,766 | | $ | 1,788 | |
| | | | | |
| | | | | |
| | | | | |
| | | | | |
| | | | | |
| | | | | |
| | | | | |
1.Average realized gold price per ounce sold may not be calculated based on amounts presented in this table due to rounding.
2.Average realized gold price per ounce sold is calculated based on sales from the Company's Westwood, Rosebel and Essakane mines.
3.Average realized gold price per ounce sold includes 37,500 ounces at $1,500 per ounce as delivered in accordance with the 2019 Prepay Arrangement.
__________________________
1.GAAP - Generally accepted accounting principles.
| | | | | |
IAMGOLD CORPORATION Third Quarter 2022 Management’s Discussion and Analysis | 31 |
Cash Costs, Cash Costs per Ounce Sold, AISC and AISC per Ounce Sold
The Company reports cash costs, cash costs per ounce sold, AISC and AISC per ounce sold in order to provide investors with information about key measures used by management to monitor performance of mine sites in commercial production and its ability to generate positive cash flow.
Cash costs include mine site operating costs such as mining, processing, administration, royalties, production taxes and realized derivative gains or losses, exclusive of depreciation, reclamation, capital expenditures and exploration and evaluation costs. AISC include cost of sales exclusive of depreciation expense, sustaining capital expenditures, which are required to maintain existing operations, capitalized exploration, sustaining lease principal payments, environmental rehabilitation accretion and depreciation, by-product credits and corporate general and administrative costs. These costs are then divided by the Company’s attributable gold ounces sold by mine sites in commercial production in the period to arrive at the cash costs per ounce sold and the AISC per ounce sold. The Company reports the AISC measure with and without a deduction for by-product credits and reports the measure for the Essakane, Rosebel and Westwood mines.
Prior to the first quarter 2022, for cash costs, the Company excluded costs related to certain taxes and permits, provisions, prior period operating costs and community development. Commencing with the first quarter 2022, these costs are no longer excluded. These changes have been completed in order to better align with peer companies. All comparative periods have been restated and updated accordingly.
The following table provides a reconciliation of cash costs and cash costs per ounce sold on an attributable basis to cost of sales as per the consolidated interim financial statements.
| | | | | | | | | | | | | | | | | |
| | |
| | | | | |
| ($ millions, except where noted) | Q3 2022 | Q2 2022 | Q3 2021 | YTD 2022 | YTD 2021 |
| | | | | |
Cost of sales1 | $ | 313.6 | | $ | 284.6 | | $ | 287.2 | | $ | 873.8 | | $ | 778.1 | |
Depreciation expense1 | (84.3) | | (78.1) | | (85.1) | | (237.4) | | (228.8) | |
Cost of sales1, excluding depreciation expense | $ | 229.3 | | $ | 206.5 | | $ | 202.1 | | $ | 636.4 | | $ | 549.3 | |
| | | | | |
| Adjust for: | | | | | |
| | | | | |
| | | | | |
| | | | | |
| | | | | |
Stockpiles and finished goods adjustment | (2.1) | | (1.1) | | — | | (5.8) | | — | |
| Other mining costs | (0.5) | | (0.9) | | (0.3) | | (2.4) | | (1.0) | |
Cost attributed to non-controlling interests2 | (16.1) | | (13.4) | | (14.5) | | (42.9) | | (41.8) | |
| Cash costs – attributable | $ | 210.6 | | $ | 191.1 | | $ | 187.3 | | $ | 585.3 | | $ | 506.5 | |
| | | | | |
Total gold sales3 (000 oz) – attributable | 187 | | 170 | | 150 | | 538 | | 438 | |
Cash costs4 ($/oz sold) – attributable | $ | 1,126 | | $ | 1,119 | | $ | 1,245 | | $ | 1,087 | | $ | 1,155 | |
1.As per note 27 of the consolidated interim financial statements for cost of sales and depreciation expense.
2.Adjustments for the consolidation of Essakane (90%) and Rosebel (95%) to their attributable portion of cost of sales.
3.Consists of Essakane, Rosebel and Westwood on an attributable basis of 90%, 95% and 100%, respectively.
4.Cash costs per ounce sold may not be calculated based on amounts presented in this table due to rounding.
The following table provides a reconciliation of AISC and AISC per ounce sold on an attributable basis to cost of sales as per the consolidated interim financial statements.
| | | | | | | | | | | | | | | | | |
| | |
| | | | | |
| ($ millions, attributable, except where noted) | Q3 2022 | Q2 2022 | Q3 2021 | YTD 2022 | YTD 2021 |
Cost of sales1 | $ | 313.6 | | $ | 284.6 | | $ | 287.2 | | $ | 873.8 | | $ | 778.1 | |
Depreciation expense1 | (84.3) | | (78.1) | | (85.1) | | (237.4) | | (228.8) | |
Cost of sales1, excluding depreciation expense | $ | 229.3 | | $ | 206.5 | | $ | 202.1 | | $ | 636.4 | | $ | 549.3 | |
| | | | | |
| Adjust for: | | | | | |
| | | | | |
Sustaining capital expenditures1 | 71.1 | | 67.1 | | 26.4 | | 214.8 | | 64.0 | |
| | | | | |
Corporate general and administrative costs2 | 10.0 | | 14.4 | | 11.2 | | 37.3 | | 31.4 | |
| Stockpiles and finished goods adjustment | (2.1) | | (1.1) | | — | | (5.8) | | — | |
Other costs3 | 4.6 | | 5.3 | | 3.4 | | 10.6 | | 10.1 | |
Cost attributable to non-controlling interests4 | (21.5) | | (18.2) | | (16.4) | | (58.9) | | (46.8) | |
| | | | | |
| AISC – attributable | $ | 291.4 | | $ | 274.0 | | $ | 226.7 | | $ | 834.4 | | $ | 608.0 | |
| | | | | |
Total gold sales5 (000s oz) – attributable | 187 | | 170 | | 150 | | 538 | | 438 | |
AISC6 ($/oz sold) – attributable | $ | 1,559 | | $ | 1,604 | | $ | 1,508 | | $ | 1,550 | | $ | 1,387 | |
AISC excluding by-product credits6 ($/oz sold) – attributable | $ | 1,562 | | $ | 1,609 | | $ | 1,510 | | $ | 1,554 | | $ | 1,389 | |
1.As per note 27 of the consolidated interim financial statements for cost of sales and depreciation expense.
2.Corporate general and administrative costs exclude depreciation expense.
3.Other costs include sustaining lease principal payments, environmental rehabilitation accretion and depletion, prior period operating costs, partially offset by by-product credits.
4.Adjustments for the consolidation of Essakane (90%) and Rosebel (95%) to their attributable portion of cost of sales.
5.Consists of Essakane, Rosebel and Westwood on an attributable basis of 90%, 95% and 100%, respectively.
6.AISC per ounce sold may not be calculated based on amounts presented in this table due to rounding.
| | | | | |
IAMGOLD CORPORATION Third Quarter 2022 Management’s Discussion and Analysis | 32 |
The Company presents its sustaining capital expenditures in its AISC to reflect the capital related to producing and selling gold from its mine operations. The distinctions between sustaining and expansion capital used by the Company align with the guidelines set out by the World Gold Council. Expansion capital is capital expenditures incurred at new projects and capital expenditures related to major projects or expansion at existing operations where these projects will materially benefit the operations. Starting in 2022, a higher portion of stripping costs are categorized as sustaining capital versus expansion capital, due to the particular areas that are scheduled to be mined and the stage of the life of mine aligning with Word Gold Council guidelines. This non-GAAP financial measure provides investors with transparency regarding the capital expenditures required to support the ongoing operations at its mines, relative to its total capital expenditures.
| | | | | | | | | | | | | | | | | |
| | | |
| | | | | |
| ($ millions, except where noted) | Q3 2022 | Q2 2022 | Q3 2021 | YTD 2022 | YTD 2021 |
| | | | | |
| | | | | |
| Capital expenditures for property, plant and equipment | $ | 229.6 | | $ | 255.7 | | $ | 138.7 | | $ | 653.6 | | $ | 392.5 | |
| Capital expenditures for exploration and evaluation assets | 0.4 | | 0.4 | | 0.7 | | 1.2 | | 1.7 | |
| $ | 230.0 | | $ | 256.1 | | $ | 139.4 | | $ | 654.8 | | $ | 394.2 | |
Capital expenditures – sustaining | 71.1 | | 67.1 | | 26.4 | | 214.8 | | 64.0 | |
Capital expenditures – expansion | $ | 158.9 | | $ | 189.0 | | $ | 113.0 | | $ | 440.0 | | $ | 330.2 | |
| | | | | |
| | | | | |
| | | | | |
| | | | | |
| | | | | | | | | | | | | | | | | |
| | | |
| | | | | |
| ($ millions, except where noted) | Q3 2022 | Q2 2022 | Q3 2021 | YTD 2022 | YTD 2021 |
| Essakane | $ | 37.6 | | $ | 31.1 | | $ | 11.6 | | $ | 116.4 | | $ | 28.3 | |
| Rosebel | 26.8 | | 27.7 | | 10.8 | | 75.0 | | 28.9 | |
| Westwood | 6.4 | | 8.8 | | 3.8 | | 22.5 | | 6.3 | |
| $ | 70.8 | | $ | 67.6 | | $ | 26.2 | | $ | 213.9 | | $ | 63.5 | |
| Corporate | 0.3 | | (0.5) | | 0.2 | | 0.9 | | 0.5 | |
Capital expenditures – sustaining | $ | 71.1 | | $ | 67.1 | | $ | 26.4 | | $ | 214.8 | | $ | 64.0 | |
| | | | | |
| | | | | |
| | | | | |
| | | | | |
| | | | | |
| | | | | |
| | | | | |
| | | | | | | | | | | | | | | | | |
| | | |
| | | | | |
| ($ millions, except where noted) | Q3 2022 | Q2 2022 | Q3 2021 | YTD 2022 | YTD 2021 |
| Essakane | $ | 1.0 | | $ | 0.5 | | $ | 27.2 | | $ | 2.5 | | $ | 60.3 | |
| Rosebel | 2.7 | | 14.7 | | 12.8 | | 23.4 | | 39.3 | |
| Westwood | 1.5 | | 0.7 | | 0.8 | | 2.7 | | 2.6 | |
| $ | 5.2 | | $ | 15.9 | | $ | 40.8 | | $ | 28.6 | | $ | 102.2 | |
| | | | | |
Côté Gold (70%) | 151.5 | | 169.6 | | 67.3 | | 399.6 | | 200.4 | |
| Boto Gold | 2.2 | | 3.5 | | 4.9 | | 11.8 | | 27.6 | |
| | | | | |
Capital expenditures – expansion | $ | 158.9 | | $ | 189.0 | | $ | 113.0 | | $ | 440.0 | | $ | 330.2 | |
| | | | | |
| | | | | |
| | | | | |
| | | | | |
| | | | | |
| | | | | |
| | | | | |
| | | | | |
IAMGOLD CORPORATION Third Quarter 2022 Management’s Discussion and Analysis | 33 |
EBITDA and Adjusted EBITDA
EBITDA (earnings before income taxes, depreciation and amortization of finance costs), is an indicator of the Company’s ability to produce operating cash flow to fund working capital needs, service debt obligations and fund capital expenditures.
Adjusted EBITDA represents EBITDA excluding certain impacts such as changes in estimates of asset retirement obligations at closed sites, unrealized (gain) loss on non-hedge derivatives, impairment charges and reversal of impairment charges, write-down of assets and foreign exchange (gain) loss which are non-cash items and certain cash items that are non-recurring or temporary in nature as such items are not indicative of recurring operating performance. Management believes this additional information is useful to investors in understanding the Company’s ability to generate operating cash flow by excluding from the calculation these non-cash amounts and cash amounts that are not indicative of the recurring performance of the underlying operations for the periods presented.
The following table provides a reconciliation of EBITDA and Adjusted EBITDA to the consolidated interim financial statements:
| | | | | | | | | | | | | | | | | | |
| ($ millions, except where noted) | Q3 2022 | Q2 2022 | Q3 2021 | YTD 2022 | YTD 2021 | |
| Earnings (loss) before income taxes | $ | (129.1) | | $ | 21.6 | | $ | (70.1) | | $ | (49.1) | | $ | (27.0) | | |
| Add: | | | | | | |
| Depreciation | 84.7 | | 78.5 | | 85.4 | | 238.5 | | 230.1 | | |
| Finance costs | 3.1 | | 1.3 | | 4.3 | | 5.6 | | 17.4 | | |
| EBITDA | $ | (41.3) | | $ | 101.4 | | $ | 19.6 | | $ | 195.0 | | $ | 220.5 | | |
| Adjusting items: | | | | | | |
| | | | | | |
| Unrealized loss on non-hedge derivatives | 17.2 | | 3.4 | | 14.2 | | 15.7 | | 7.5 | | |
| Insurance recoveries | — | | — | | — | | (1.2) | | (10.2) | | |
| Write-down of assets | 0.3 | | 0.7 | | 0.7 | | 2.4 | | 2.2 | | |
| NRV write-down of stockpiles/finished goods | 3.2 | | 4.5 | | 13.6 | | 12.0 | | 23.0 | | |
| Foreign exchange loss | 10.8 | | 1.4 | | 5.9 | | 15.6 | | 5.2 | | |
| Gain on sale of royalties | — | | — | | — | | — | | (45.9) | | |
| Restructuring costs | — | | — | | — | | — | | 1.0 | | |
| Covid-19 expenses, net of subsidy | — | | — | | 4.2 | | — | | 13.6 | | |
| Care and maintenance costs at Westwood | — | | — | | — | | — | | 24.5 | | |
| Fair value of deferred consideration from sale of Sadiola | 0.6 | | (0.4) | | — | | (0.2) | | — | | |
| Impairment charge | 115.8 | | — | | — | | 115.8 | | — | | |
| Gain on sale of investment in INV Metal Inc. | — | | — | | (16.1) | | — | | (16.1) | | |
| Changes in estimates of asset retirement obligations at closed sites | (3.5) | | — | | 40.4 | | (3.5) | | 40.4 | | |
| Other | — | | (1.0) | | — | | (1.0) | | — | | |
| | | | | | |
| | | | | | |
| | | | | | |
| | | | | | |
| | | | | | |
| | | | | | |
| | | | | | |
| | | | | | |
| | | | | | |
| Adjusted EBITDA | $ | 103.1 | | $ | 110.0 | | $ | 82.5 | | $ | 350.6 | | $ | 265.7 | | |
1.COVID-19 expenses included in operating costs for 2022 financial year.
| | | | | |
IAMGOLD CORPORATION Third Quarter 2022 Management’s Discussion and Analysis | 34 |
Adjusted Net Earnings (Loss) Attributable to Equity Holders
Adjusted net earnings attributable to equity holders represents net earnings (loss) attributable to equity holders excluding certain impacts, net of taxes, such as changes in estimates of asset retirement obligations at closed sites, unrealized (gain) loss on non-hedge derivatives and warrants, impairment charges and reversal of impairment charges, write-down of assets and foreign exchange (gain) loss which are non-cash items and certain cash items that are non-recurring or temporary in nature as such items are not indicative of recurring operating performance. This measure is not necessarily indicative of net earnings (loss) or cash flows as determined under IFRS. Management believes this measure better reflects the Company’s performance for the current period and is a better indication of its expected performance in future periods. As such, the Company believes that this measure is useful to investors in assessing the Company’s underlying performance. The following table provides a reconciliation of earnings (loss) before income taxes and non-controlling interests as per the consolidated statements of earnings (loss) of $(129.1) million, to adjusted net earnings (loss) attributable to equity holders of the Company of $(13.7) million in the third quarter 2022.
| | | | | | | | | | | | | | | | | |
| | |
| | | | | |
| ($ millions, except where noted) | Q3 2022 | Q2 2022 | Q3 2021 | YTD 2022 | YTD 2021 |
| Earnings (loss) before income taxes and non-controlling interests | $ | (129.1) | | $ | 21.6 | | $ | (70.1) | | $ | (49.1) | | $ | (27.0) | |
| Adjusting items: | | | | | |
| Unrealized loss on non-hedge derivatives | 17.2 | | 3.4 | | 14.2 | | 15.7 | | 7.5 | |
| Insurance recoveries | — | | — | | — | | (1.2) | | (10.2) | |
| Write-down of assets | 0.3 | | 0.7 | | 0.7 | | 2.4 | | 2.2 | |
| NRV write-down of stockpiles/finished goods | 4.0 | | 5.2 | | 16.2 | | 14.5 | | 27.4 | |
| Foreign exchange loss | 10.8 | | 1.4 | | 5.9 | | 15.6 | | 5.2 | |
| Gain on sale of royalties | — | | — | | — | | — | | (45.9) | |
| Restructuring costs | — | | — | | — | | — | | 1.0 | |
| Covid-19 expenses, net of subsidy | — | | — | | 4.2 | | — | | 13.6 | |
| Care and maintenance costs at Westwood | — | | — | | — | | — | | 24.5 | |
| Fair value of deferred consideration from sale of Sadiola | 0.6 | | (0.4) | | — | | (0.2) | | — | |
| | | | | |
| Impairment charge | 115.8 | | — | | — | | 115.8 | | — | |
| Gain on sale of investment in INV Metal Inc. | — | | — | | (16.1) | | — | | (16.1) | |
| | | | | |
| Changes in estimates of asset retirement obligations at closed sites | (3.5) | | — | | 40.4 | | (3.5) | | 40.4 | |
| | | | | |
| | | | | |
| | | | | |
| | | | | |
| | | | | |
| | | | | |
| | | | | |
| | | | | |
| | | | | |
| | | | | |
| | | | | |
| | | | | |
| | | | | |
| | | | | |
| | | | | |
| | | | | |
| Other | — | | (1.0) | | — | | (1.0) | | — | |
| Adjusted earnings (loss) before income taxes and non-controlling interests | $ | 16.1 | | $ | 30.9 | | $ | (4.6) | | $ | 109.0 | | $ | 22.6 | |
| Income taxes | 19.2 | | (25.1) | | (2.4) | | (32.5) | | (24.1) | |
| Tax on foreign exchange translation of deferred income tax balances | (8.9) | | (6.4) | | (2.4) | | (15.7) | | (4.4) | |
| Tax impact of adjusting items | (41.7) | | 0.4 | | (7.9) | | (42.2) | | (2.4) | |
| Non-controlling interests | 1.6 | | (6.1) | | (2.8) | | (12.5) | | (9.2) | |
| Adjusted net earnings (loss) attributable to equity holders | $ | (13.7) | | $ | (6.3) | | $ | (20.1) | | $ | 6.1 | | $ | (17.5) | |
| Adjusted net earnings (loss) per share attributable to equity holders | $ | (0.03) | | $ | (0.01) | | $ | (0.04) | | $ | 0.01 | | $ | (0.04) | |
| | | | | |
| | | | | |
| | | | | |
| | | | | |
| | | | | |
| | | | | |
| | | | | |
| | | | | |
| | | | | |
| | | | | |
| | | | | |
| Basic weighted average number of common shares outstanding (millions) | 479.0 | | 478.9 | | 476.8 | | 478.5 | | 476.4 | |
1.COVID-19 expenses included in operating costs for 2022 financial year.
| | | | | |
IAMGOLD CORPORATION Third Quarter 2022 Management’s Discussion and Analysis | 35 |
Net Cash from Operating Activities before Changes in Working Capital
The Company makes reference to net cash from operating activities before changes in working capital which is calculated as net cash from operating activities less non-cash working capital items and non-current ore stockpiles. Working capital can be volatile due to numerous factors, including a build-up or reduction of inventories. Management believes that this non-GAAP measure, which excludes these non-cash items, provides investors with the ability to better evaluate the operating cash flow performance of the Company.
The following table provides a reconciliation of net cash from operating activities before changes in working capital to net cash from operating activities:
| | | | | | | | | | | | | | | | | |
| | |
| | | | | |
| ($ millions, except where noted) | Q3 2022 | Q2 2022 | Q3 2021 | YTD 2022 | YTD 2021 |
| | | | | |
| | | | | |
| Net cash from operating activities | $ | 117.7 | | $ | 81.9 | | $ | 78.5 | | $ | 341.9 | | $ | 217.5 | |
| Adjusting items from non-cash working capital items and non-current ore stockpiles | | | | | |
| Receivables and other current assets | (5.7) | | 8.9 | | (0.3) | | 1.5 | | (26.0) | |
| Inventories and non-current ore stockpiles | 20.3 | | 17.7 | | 13.0 | | 20.4 | | 35.9 | |
| Accounts payable and accrued liabilities | (23.5) | | (14.6) | | (11.6) | | (27.2) | | (10.4) | |
| Net cash from operating activities before changes in working capital | $ | 108.8 | | $ | 93.9 | | $ | 79.6 | | $ | 336.6 | | $ | 217.0 | |
| | | | | |
| | | | | |
| | | | | |
| | | | | |
Mine-Site Free Cash Flow
Mine-site free cash flow is calculated as cash flow from mine-site operating activities less mine-site related property, plant and equipment expenditures. The Company believes this measure is useful to investors in assessing the Company's ability to operate its mine sites without reliance on additional borrowing or usage of existing cash.
| | | | | | | | | | | | | | | | | |
| | |
| | | | | |
| ($ millions, except where noted) | Q3 2022 | Q2 2022 | Q3 2021 | YTD 2022 | YTD 2021 |
| Net cash from operating activities | $ | 117.7 | | $ | 81.9 | | $ | 78.5 | | $ | 341.9 | | $ | 217.5 | |
| Add: | | | | | |
| Operating cash flow used by non-mine site activities | 17.5 | | 44.4 | 20.4 | 89.9 | | 69.8 |
| Cash flow from operating mine-sites | $ | 135.2 | | $ | 126.3 | | $ | 98.9 | | $ | 431.8 | | $ | 287.3 | |
| | | | | |
| Capital expenditures | $ | 230.0 | | $ | 256.1 | | $ | 139.4 | | $ | 654.8 | | $ | 394.2 | |
| Less: | | | | | |
| Capital expenditures from construction and development projects and corporate | (154.0) | | (172.6) | | (72.4) | | (412.3) | | (228.5) | |
| Capital expenditures from operating mine-sites | $ | 76.0 | | $ | 83.5 | | $ | 67.0 | | $ | 242.5 | | $ | 165.7 | |
| | | | | |
| Mine-site free cash flow | $ | 59.2 | | $ | 42.8 | | $ | 31.9 | | $ | 189.3 | | $ | 121.6 | |
| | | | | |
| | | | | |
| | | | | |
| | | | | |
| | | | | |
| | | | | |
| | | | | |
Liquidity and Net Cash (Debt)
Liquidity is defined as cash and cash equivalents, short-term investments and the credit available under the Credit Facility. Net cash (debt) is calculated as cash, cash equivalents and short-term investments less long-term debt, lease liabilities and the drawn portion of the Credit Facility. The Company believes this measure provides investors with additional information regarding the liquidity position of the Company.
| | | | | | | | | | | |
| September 30 | June 30 | December 31 |
| ($ millions, except where noted) | 2022 | 2022 | 2021 |
| Cash and cash equivalents | $ | 535.6 | | $ | 451.1 | | $ | 544.9 | |
| Short-term investments | 0.5 | | 1.8 | | 7.6 | |
| Available Credit Facility | 100.7 | | 348.7 | | 498.3 | |
| Liquidity | $ | 636.8 | | $ | 801.6 | | $ | 1,050.8 | |
| | | | | | | | | | | |
| September 30 | June 30 | December 31 |
| ($ millions, except where noted) | 2022 | 2022 | 2021 |
| Cash and cash equivalents | $ | 535.6 | | $ | 451.1 | | $ | 544.9 | |
| Short-term investments | 0.5 | | 1.8 | | 7.6 | |
| Lease liabilities | (78.9) | | (62.0) | | (65.6) | |
Long-term debt1 | (847.2) | | (614.7) | | (468.9) | |
| Drawn letters of credit issued under Credit Facility | (19.3) | | (1.3) | | (1.7) | |
| Net cash (debt) | $ | (409.3) | | $ | (225.1) | | $ | 16.3 | |
1.Includes principal amount of the Notes of $450.0 million, Credit Facility of $380.0 million and equipment loans of $17.2 million (June 30, 2022 - $450 million, $150.0 million and $14.7 million, respectively and December 31, 2021 - $450 million, $nil and $18.9 million, respectively). Excludes deferred transaction costs and embedded derivative on the Notes.
| | | | | |
IAMGOLD CORPORATION Third Quarter 2022 Management’s Discussion and Analysis | 36 |
CAUTIONARY STATEMENT ON FORWARD-LOOKING INFORMATION
All information included in this MD&A, including any information as to the Company’s future financial or operating performance and other statements that express management’s expectations or estimates of future performance, including statements in respect of the prospects and/or development of the Company’s projects, other than statements of historical fact, constitutes forward-looking information or forward-looking statements within the meaning of applicable securities laws (collectively referred to herein as “forward-looking statements”) and such forward-looking statements are based on expectations, estimates and projections as of the date of this MD&A. For example, forward-looking statements in this MD&A include, without limitation, those under the headings “Outlook”, “Quarterly Updates”, "Exploration", “Liquidity and Capital Resources” and "Market Trends" and include, but are not limited to, statements with respect to: the estimation of mineral reserves and mineral resources and the realization of such estimates; operational and financial performance including the Company’s guidance for and actual results of production, costs and capital and other expenditures such as exploration and including depreciation expense and effective tax rate; the updated costs and schedule to complete construction of the Côté Gold project; the updated LOM plan, ramp up assumptions and other project metrics including operating costs in the 2022 Technical Report; expected benefits from the operational improvements and de-risking strategies implemented or to be implemented by the Company; mine development activities; the Company's capital allocation; the composition of the Company’s portfolio of assets including its operating mines, development and exploration projects; requirements for additional capital and the ability to achieve the successful completion of one or more financing alternatives; the implementation of a fully funded financing plan to facilitate the completion of the construction of the Côté Gold project on the updated schedule and costs estimates; the conclusion of one or more of the ongoing strategic evaluation processes; the completion of sales of one or more of the Company’s assets or an interest therein; permitting timelines and the expected receipt of permits; the impacts of COVID-19; the impacts of the war in Ukraine; inflation; global supply chain constraints; the ability to secure alternative sources of consumables of comparable quality and on reasonable terms; workforce and contractor availability, labour costs and other labour impacts including arising from expected collective bargaining processes and arrangements; the impacts of weather; the future price of gold and other commodities; foreign exchange rates and currency fluctuations; impairment assessments and assets carrying values estimates; safety and security concerns in the jurisdictions in which the Company operates and the impact thereof on the Company’s operational and financial performance and financial condition; and government regulation of mining operations. Forward-looking statements are generally identifiable by the use of words such as “may”, “will”, “should”, “continue”, “expect”, "budget", "forecast", “anticipate”, “estimate”, “believe”, “intend”, “plan”, "schedule", “guidance”, “outlook”, “potential”, "transformational", "best-in-class", "top-tier", “seek”, “targets”, "suspended", "superior return(s)", "superior shareholder return(s)", "cover", “strategy”, "superior" or “project” or the negative of these words or other variations on these words or comparable terminology.
The Company cautions the reader that forward-looking statements are necessarily based upon a number of estimates and assumptions that, while considered reasonable by management, are inherently subject to significant business, financial, operational and other risks, uncertainties, contingencies and other factors, including those described below, which could cause actual results, performance or achievements of the Company to be materially different from results, performance or achievements expressed or implied by such forward-looking statements and, as such, undue reliance must not be placed on them. Forward-looking statements are also based on numerous material factors and assumptions, including as described in this MD&A, including with respect to: the Company's present and future business strategies; operations performance within expected ranges; anticipated future production and cash flows; local and global economic conditions and the environment in which the Company will operate in the future; the price of gold, copper, silver and other key commodities; projected mineral grades; international exchanges rates; anticipated capital and operating costs; the availability and timing of required governmental and other approvals for the construction of the Company's projects.
Risks, uncertainties, contingencies and other factors that could cause actual results, performance or achievements of the Company to be materially different from results, performance or achievements expressed or implied by such forward-looking statements include, without limitation: the failure to close the expected sale of the Rosebel mine, because of the failure to receive regulatory or any other approval, satisfy any condition precedent or otherwise, and the Company not receiving the expected material cash consideration as an essential part of the comprehensive financing package being pursued to fund the significant shortfall in funding the development and construction of the Côté Gold project and other material near-term liquidity needs, the Company's business strategies; political and legal risks; the ongoing impacts of COVID-19 (and its variants) and the war in Ukraine on the Company and its workforce, the availability of labour and contractors, key inputs for the Company and global supply chains; the volatility of the Company's securities; litigation; contests over title to properties, particularly title to undeveloped properties; mine closure and rehabilitation risks; management of certain of the Company's assets by other companies or joint venture partners; the lack of availability of insurance covering all of the risks associated with a mining company's operations; business risks, including pandemics, adverse environmental conditions and hazards; unexpected geological conditions; potential shareholder dilution; potential activist engagements; increasing competition in the mining sector; ability to successfully integrate acquired assets; the profitability of the Company being highly dependent on the condition and results of the mining industry as a whole, and the gold mining industry in particular; changes in the global prices for gold, copper, silver or certain other commodities (such as diesel and electricity); consolidation in the gold mining industry; legal, litigation, legislative, political or economic risks and new developments in the jurisdictions in which the Company carries on business; government actions taken in response to COVID-19, including new variants of COVID-19, and any worsening thereof; changes in taxes, including mining tax regimes; the failure to obtain in a timely manner from authorities key permits, authorizations or approvals necessary for exploration, development or operation, operating or technical difficulties in connection with mining or development activities, including geotechnical difficulties and major equipment failure, such as a conveyor belt breakdown; seismicity, such as the seismic event that occurred at Westwood mine on October 30, 2020; the inability to participate in any gold price increase above the cap in any collar transaction entered into in conjunction with a gold sale prepayment arrangement; the availability of capital; the level of liquidity and capital resources; access to capital markets and financing; the Company's level of indebtedness; the Company's ability to satisfy covenants under its credit facilities; movements in interest rates; adverse changes
| | | | | |
IAMGOLD CORPORATION Third Quarter 2022 Management’s Discussion and Analysis | 37 |
in the Company’s credit rating; the Company's choices in capital allocation; effectiveness of the Company's ongoing cost containment efforts; the ability to execute on the Company's de-risking activities and measures to improve operations; risks related to third-party contractors, including reduced control over aspects of the Company's operations and/or the failure and/or the effectiveness of contractors to perform; risks arising from holding derivative instruments; changes in U.S. dollar and other currency exchange rates, interest rates or gold lease rates; capital and currency controls in foreign jurisdictions; assessment of carrying values for the Company’s assets, including the ongoing potential for material impairment and/or write-downs of such assets; the speculative nature of exploration and development, including the risks of diminishing quantities or grades of reserves; the fact that reserves and resources, expected metallurgical recoveries, capital and operating costs are estimates which may require revision; the presence of unfavourable content in ore deposits, including clay and coarse gold; inaccuracies in life of mine plans; failure to meet operational targets; equipment malfunctions; security risks, including civil unrest, war or terrorism and disruptions to the Company’s supply chain as a result of such security risks; information systems security threats and cybersecurity; laws and regulations governing the protection of the environment; employee relations and labour disputes; the maintenance of tailings storage facilities and the potential for a major spill or failure of the tailings facilities due to uncontrollable events, such as extreme weather or seismic events; potential for failure of the hydrostatic plug at the Westwood mine; lack of reliable infrastructure, including access to roads, bridges, power sources and water supplies; physical and regulatory risks related to climate change; unpredictable weather patterns and challenging weather at mine sites, such as the unusual levels of rain at the Rosebel mine in 2021 and 2022; attraction and retention of key employees and other qualified personnel; availability and increasing costs associated with mining inputs and labour, negotiations with respect to new, reasonable collective labour agreements may not be agreed to; the availability of qualified contractors and the ability of contractors to timely complete projects on acceptable terms; the relationship with the communities surrounding the Company's operations and projects; indigenous rights or claims; illegal mining; the potential direct or indirect operational impacts resulting from external factors, including infectious diseases or pandemics, such as the COVID-19 outbreak, or adverse weather conditions; and the inherent risks involved in the exploration, development and mining business generally. Please see the Company’s AIF or Form 40-F available on www.sedar.com or www.sec.gov/edgar.shtml for a comprehensive discussion of the risks faced by the Company and which may cause actual results, performance or achievements of the Company to be materially different from results, performance or achievements expressed or implied by forward-looking statements.
Although the Company has attempted to identify important factors that could cause actual results to differ materially from those contained in forward-looking statements, there may be other factors that cause results not to be as anticipated, estimated or intended. The Company disclaims any intention or obligation to update or revise any forward-looking statements whether as a result of new information, future events or otherwise except as required by applicable law.
| | | | | |
IAMGOLD CORPORATION Third Quarter 2022 Management’s Discussion and Analysis | 38 |