The fund seeks the highest total return over time consistent with an emphasis on both capital growth and income.
This table describes the fees and expenses that you may pay if you buy, hold, and sell shares of the fund. You may also incur brokerage commissions and other charges when buying or selling shares of the fund, which are not reflected in the table or example below.
Shareholder Fees - T. Rowe Price Target 2055 Fund - USD ($) |
Investor Class |
I Class |
Advisor Class |
|
|---|---|---|---|---|
| Maximum account fee | $ 20 | [1] | none | none |
| [1] | Subject to certain exceptions, accounts with a balance of less than $10,000 are charged an annual $20 fee. |
Annual Fund Operating Expenses - T. Rowe Price Target 2055 Fund |
Investor Class |
I Class |
Advisor Class |
|||
|---|---|---|---|---|---|---|
| Management fees | [2] | 0.63% | [1] | 0.45% | 0.63% | [1] |
| Distribution and service (12b-1) fees | none | none | 0.25% | |||
| Other expenses | none | none | none | |||
| Total annual fund operating expenses | 0.63% | [1] | 0.45% | 0.88% | [1] | |
| [1] | Restated to reflect current fees. |
| [2] | The management fee will decline over time in accordance with a predetermined contractual fee schedule, which is set forth under “The Management Fee” in section 2 of the fund’s prospectus, with any annual decrease occurring after the end of the fund’s fiscal year. The fee schedule can only be changed with approval by the fund’s Board of Directors, and, if required by SEC rules, the fund’s shareholders. |
Expense Example - T. Rowe Price Target 2055 Fund - USD ($) |
Investor Class |
I Class |
Advisor Class |
|---|---|---|---|
| 1 Year | $ 64 | $ 46 | $ 90 |
| 3 Years | 201 | 144 | 280 |
| 5 Years | 349 | 249 | 485 |
| 10 Years | $ 773 | $ 554 | $ 1,072 |
taxable account. These costs, which are not reflected in annual fund operating expenses or in the example, affect the fund’s performance. During the most recent fiscal year, the fund’s portfolio turnover rate was 32.2% of the average value of its portfolio.
The fund pursues its objective(s) by investing in a diversified portfolio of other T. Rowe Price stock and bond mutual funds that represent various asset classes and sectors. The fund’s allocation among T. Rowe Price mutual funds will change over time in relation to its target retirement date.
The fund is managed based on the specific retirement year (target date 2055) included in its name and assumes a retirement age of 65. The target date refers to the approximate year an investor in the fund would plan to retire and likely stop making new investments in the fund. The fund is primarily designed for an investor who anticipates retiring at or about the target date and who plans to withdraw the value of the account in the fund gradually after retirement. However, if an investor retires earlier or later than age 65, the fund may not be an appropriate investment even if the investor retires on or near the fund’s target date.
Over time, the allocation to asset classes and funds will change according to a predetermined “glide path” shown in the following chart (the left axis indicates the overall neutral allocation to stocks with the remainder of the allocation to bonds). The glide path represents the shifting of asset classes over time and shows how the fund’s asset mix becomes more conservative–both prior to and after retirement–as time elapses. This reflects the need for reduced market risks as retirement approaches and the need for lower portfolio volatility after retiring. Although the glide path is meant to dampen the fund’s potential volatility as retirement approaches, the fund is not designed for a lump sum redemption at the retirement date. The fund pursues an asset allocation strategy that promotes asset accumulation prior to retirement, but it is intended to also serve as a post-retirement investment vehicle with allocations designed to support an income stream made up of regular withdrawals throughout retirement along with some portfolio growth that exceeds inflation. After the target date, the fund is designed to balance longevity and inflation risks along with the need for some income, although it does not guarantee a particular level of income.
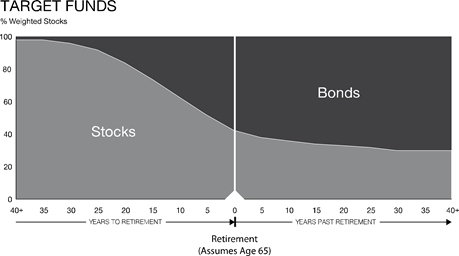
The glide path provides for a neutral allocation to stocks at the target date of 42.5%. The fund’s overall exposure to stocks will continue to decline until approximately 30 years after its target date, when its neutral allocations to stocks and bonds will remain unchanged. There are no maturity restrictions within the fund’s overall allocation to bonds, although the bond funds in which the fund invests may impose specific limits on maturity or credit quality. The allocations are referred to as “neutral” allocations because they are strategic and do not reflect any tactical decisions made by T. Rowe Price to overweight or underweight a particular asset class or sector based on its market outlook. The target allocations assigned to the broad asset classes (Stocks and Bonds), which reflect these tactical decisions resulting from market outlook, are not expected to vary from the neutral allocations set forth in the glide path by more than plus (+) or minus (-) five percent (5%). The target allocations and actual allocations may differ due to significant market movements or cash flows.
The following table illustrates how the portfolio is generally expected to be allocated between the asset classes and the underlying T. Rowe Price mutual funds that are used to represent the broad asset classes and specific sectors. The fund invests in the Z Class of each of its underlying funds. T. Rowe Price is contractually obligated to waive and/or bear all of the Z Class’ expenses, with certain limited exceptions. The fund’s overall allocation to stocks is represented by a diversified mix of U.S. and international stock funds that employ both growth and value investment approaches and consist of large-cap, mid-cap, and small-cap stocks. The fund’s overall allocation to bonds is represented by a “core” fixed income component designed to have lower overall volatility and a “diversifying” fixed income component designed to respond to a variety of market conditions and improve risk adjusted returns. The information in the table represents the neutral allocations for the fund as of October 1, 2022. The fund’s shareholder reports set forth its actual allocations between stock funds and bond funds and to the individual T. Rowe Price mutual funds. T. Rowe Price may periodically rebalance or modify the asset mix of the underlying funds and change the underlying fund investments.
Target 2055 Fund | |||||||
Asset Class |
| Sector(s) | Neutral Allocation | Underlying Fund(s) | |||
|
|
|
|
|
|
|
|
Stocks | 97.10 | % | Inflation Focused Stocks | 4.86 | % | Real Assets | |
|
|
| International Developed Market Stocks | 23.52 |
| International Stock, | |
|
|
|
|
|
| International Value Equity, and/or | |
|
|
|
|
|
| Overseas Stock | |
|
|
| International Emerging Market Stocks | 4.15 |
| Emerging Markets Discovery Stock and/or | |
|
|
|
|
|
| Emerging Markets Stock | |
|
|
| U.S. Large-Cap Stocks | 51.65 |
| Equity Index 500, | |
|
|
|
|
|
| Growth Stock, | |
|
|
|
|
|
| U.S. Equity Research | |
|
|
|
|
|
| U.S. Large-Cap Core, and/or | |
|
|
|
|
|
| Value | |
|
|
| U.S. Mid-Cap Stocks | 6.46 |
| Mid-Cap Growth, | |
|
|
|
|
|
| Mid-Cap Index, and/or | |
|
|
|
|
|
| Mid-Cap Value | |
|
|
| U.S. Small-Cap Stocks | 6.46 |
| New Horizons, | |
|
|
|
|
|
| Small-Cap Index, | |
|
|
|
|
|
| Small-Cap Stock, and/or | |
|
|
|
|
|
| Small-Cap Value | |
Bonds | 2.90 |
| Core Fixed Income | 2.03 |
| Dynamic Global Bond, | |
|
|
|
|
|
| International Bond (USD Hedged), and/or | |
|
|
|
|
|
| New Income | |
|
|
| Diversifying Fixed Income | 0.87 |
| Emerging Markets Bond, | |
|
|
|
|
|
| Floating Rate, | |
|
|
|
|
|
| High Yield, | |
|
|
|
|
|
| Limited Duration Inflation Focused Bond, | |
|
|
|
|
|
| U.S. Treasury Long-Term Index, and/or | |
|
|
|
|
|
| U.S. Treasury Money | |
|
|
|
|
|
|
|
|
As with any fund, there is no guarantee that the fund will achieve its objective(s). The fund’s share price fluctuates, which means you could lose money by investing in the fund. You may experience losses, including losses near, at, or after the target retirement date. There is no guarantee that the fund will provide adequate income at and through your retirement. The principal risks of investing in this fund, which may be even greater in bad or uncertain market conditions, are summarized as follows:
Active management/Asset allocation The fund’s overall level of risk will directly correspond to the risks of the underlying funds in which it invests. By investing in many underlying funds, the fund has partial exposure to the risks of different areas of the market. However, the selection of the underlying funds and the allocation of the fund’s assets among the various asset
classes, market sectors, and investment styles represented by those underlying funds could cause the fund to underperform other funds with a similar benchmark or investment objective(s).
Investments in other funds The fund bears the risk that its underlying funds will fail to successfully employ their investment strategies. One or more underlying fund’s underperformance or failure to meet its investment objective(s) as intended could cause the fund to underperform similarly managed funds.
Market conditions The value of the fund’s investments may decrease, sometimes rapidly or unexpectedly, due to factors affecting an issuer held by an underlying fund, particular industries, or the overall securities markets. A variety of factors can increase the volatility of an underlying fund’s holdings and markets generally, including political or regulatory developments, recessions, inflation, rapid interest rate changes, war, military conflict, or acts of terrorism, natural disasters, and outbreaks of infectious illnesses or other widespread public health issues such as the coronavirus pandemic and related governmental and public responses (including sanctions). Certain events may cause instability across global markets, including reduced liquidity and disruptions in trading markets, while some events may affect certain geographic regions, countries, sectors, and industries more significantly than others. Government intervention in markets may impact interest rates, market volatility, and security pricing. These adverse developments may cause broad declines in market value due to short-term market movements or for significantly longer periods during more prolonged market downturns.
Stock exposure An underlying stock fund’s share price can fall because of weakness in the overall stock markets, a particular industry, or specific holdings. Stocks generally fluctuate in value more than bonds and may decline significantly over short time periods. There is a chance that stock prices overall will decline because stock markets tend to move in cycles, with periods of rising and falling prices. The value of an underlying stock fund may decline due to general weakness or volatility in the stock markets, adverse conditions impacting a particular industry or market sector, or factors affecting an investment style or market capitalization targeted by the fund.
International investing Investing in underlying funds that hold the securities of non-U.S. issuers involves special risks not typically associated with investing in underlying funds that hold securities of U.S. issuers. Non-U.S. securities tend to be more volatile and have lower overall liquidity than investments in U.S. securities and may lose value because of adverse local, political, social, or economic developments overseas, or due to changes in the exchange rates between foreign currencies and the U.S. dollar. In addition, investments outside the U.S. are subject to settlement practices and regulatory and financial reporting standards that differ from those of the U.S. The risks of investing outside the U.S. are heightened for any investments in emerging markets, which are susceptible to greater volatility than investments in developed markets.
Emerging markets Investing in underlying funds that hold securities of issuers in emerging market countries involves greater risk and overall volatility than investing in underlying funds
that hold securities of issuers in the U.S. and other developed markets. Emerging market countries tend to have economic structures that are less diverse and mature, less developed legal and regulatory regimes, and political systems that are less stable, than those of developed countries. In addition to the risks normally associated with investing outside the U.S., emerging markets are more susceptible to governmental interference, political and economic uncertainty, local taxes and restrictions on an underlying fund’s investments, less efficient trading markets with lower overall liquidity, and more volatile currency exchange rates.
Market capitalization Because the fund invests in certain underlying funds that focus on a particular market capitalization, its share price may be negatively affected if investing in that market capitalization falls out of favor. Small- and mid-cap companies often have less experienced management, more limited financial resources, and less publicly available information than large-cap companies, and tend to be more sensitive to changes in overall economic conditions. As a result, investments in small-cap and mid-cap companies are likely to be more volatile than investments in large-cap companies. However, large-cap companies may not be able to attain the high growth rates of successful smaller companies, especially during strong economic periods, and they may be less capable of responding quickly to competitive challenges and industry changes.
Investment style Because the fund invests in certain underlying funds that focus on growth stocks and certain underlying funds that focus on value stocks, its share price may be negatively affected if either investing approach falls out of favor. Growth stocks tend to be more volatile than the overall stock market and are more sensitive to changes in current or expected earnings. Value stocks carry the risk that investors will not recognize their intrinsic value for a long time (or at all) or that they are actually appropriately priced at a low level.
Inflation To the extent the fund invests in underlying funds that are designed to provide protection against the impact of inflation, those investments could adversely affect the fund’s performance when inflation or expectations of inflation are low. During such periods, the values of an underlying fund’s investments in inflation-linked securities or stocks designed to outperform the overall stock market during periods of high or rising inflation could fall and result in losses for the fund, causing the fund to lag the performance of similarly managed funds.
Bond exposure An underlying bond fund’s share price can fall because of various factors affecting bonds or due to general weakness in the overall bond markets. The fund invests in underlying funds with varying levels of credit risk, interest rate risk, inflation risk, and liquidity risk. At times, participants in bond markets may develop concerns about the ability of certain issuers to make timely principal and interest payments, or they may develop concerns about the ability of financial institutions that make markets in certain debt instruments to facilitate an orderly market. Those concerns could cause increased volatility and reduced liquidity in particular securities or in the overall bond markets and the related derivatives markets, which could hamper an underlying fund’s ability to sell the bonds in which it invests or to find and purchase suitable investments.
Liquidity An underlying fund may not be able to meet requests to redeem shares without significant dilution of the remaining shareholders’ interests in the fund. A particular investment or an entire market segment may become less liquid or even illiquid, sometimes abruptly, which could limit a fund’s ability to purchase or sell holdings in a timely manner at a desired price. Reduced liquidity can result from a number of events, such as limited trading activity, reductions in bond inventory, and rapid or unexpected changes in interest rates. Large redemptions may also have a negative impact on an underlying fund’s overall liquidity.
Cybersecurity breaches The fund could be harmed by intentional cyberattacks and other cybersecurity breaches, including unauthorized access to the fund’s assets, customer data and confidential shareholder information, or other proprietary information. In addition, a cybersecurity breach could cause one of the fund’s service providers or financial intermediaries to suffer unauthorized data access, data corruption, or loss of operational functionality.
The following performance information provides some indication of the risks of investing in the fund. The fund’s performance information represents only past performance (before and after taxes) and is not necessarily an indication of future results.
The following bar chart illustrates how much returns can differ from year to year by showing calendar year returns and the best and worst calendar quarter returns during those years for the fund’s Investor Class. Returns for other share classes vary since they have different expenses.
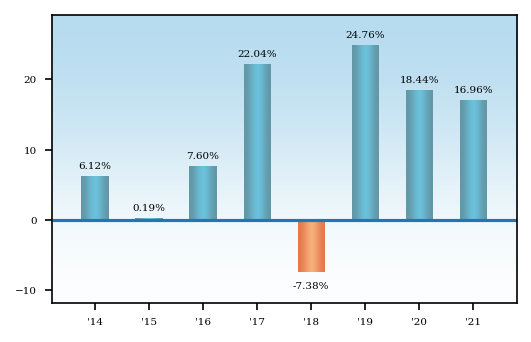
The fund’s return for the six months ended 6/30/22 was -20.61%.
Quarter Ended | Total Return | Quarter Ended | Total Return | |||||
Best Quarter | 6/30/20 | 19.73% | Worst Quarter | 3/31/20 | -19.76% |
The following table shows the average annual total returns for each class of the fund that has been in operation for at least one full calendar year, and also compares the returns with the
returns of a relevant broad-based market index, as well as with the returns of one or more comparative indexes that have investment characteristics similar to those of the fund, if applicable.
In addition, the table shows hypothetical after-tax returns to demonstrate how taxes paid by a shareholder may influence returns. After-tax returns are calculated using the historical highest individual federal marginal income tax rates and do not reflect the impact of state and local taxes. Actual after-tax returns depend on an investor’s tax situation and may differ from those shown. After-tax returns shown are not relevant to investors who hold their fund shares through tax-deferred arrangements, such as a 401(k) account or an IRA. After-tax returns are shown only for the Investor Class and will differ for other share classes.
Average Annual Total Returns - T. Rowe Price Target 2055 Fund |
Label |
1 Year |
5 Years |
Since Inception |
Inception Date |
||
|---|---|---|---|---|---|---|---|
| Investor Class | 16.96% | 14.33% | 11.62% | Aug. 20, 2013 | |||
| Investor Class | After Taxes on Distributions | 15.78% | 13.19% | 10.56% | ||||
| Investor Class | After Taxes on Distributions and Sales | 10.48% | 11.20% | 9.19% | ||||
| I Class | 17.23% | 14.50% | 14.85% | Feb. 26, 2016 | |||
| Advisor Class | 16.73% | 14.06% | 11.35% | Aug. 20, 2013 | |||
| S&P Target Date 2055 Index | S&P Target Date 2055 Index (reflects no deduction for fees, expenses, or taxes) | ||||||
| S&P Target Date 2055 Index | [1] | 10.90% | |||||
| S&P Target Date 2055 Index | 18.19% | 13.18% | 13.95% | [2] | |||
| Combined Index Portfolio | [3] | Combined Index Portfolio (reflects no deduction for fees, expenses, or taxes) | |||||
| Combined Index Portfolio | [1] | 11.75% | |||||
| Combined Index Portfolio | 18.56% | 14.49% | 15.04% | [2] | |||
| [1] | Return since 8/20/13. |
| [2] | Return since 2/26/16. |
| [3] | Combined Index Portfolio is a blended benchmark composed of 97.20% stocks (68.04% Russell 3000 Index and 29.16% MSCI All Country World Index ex USA Net), and 2.80% bonds (Bloomberg U.S. Aggregate Bond Index). The indices and percentages may vary over time. |