The fund seeks total return, and secondarily, current income.
This table describes the fees and expenses that you may pay if you buy, hold, and sell shares of the fund. You may also incur brokerage commissions and other charges when buying or selling shares of the fund, which are not reflected in the table or example below.
Shareholder Fees - T. Rowe Price U.S. High Yield Fund - USD ($) |
Investor Class |
I Class |
Advisor Class |
|
|---|---|---|---|---|
| Maximum account fee | $ 20 | [1] | none | none |
| [1] | Subject to certain exceptions, accounts with a balance of less than $10,000 are charged an annual $20 fee. |
Annual Fund Operating Expenses - T. Rowe Price U.S. High Yield Fund |
Investor Class |
I Class |
Advisor Class |
|||
|---|---|---|---|---|---|---|
| Management fees | 0.56% | 0.56% | 0.56% | |||
| Distribution and service (12b-1) fees | none | none | 0.25% | [1] | ||
| Other expenses | 0.22% | 0.09% | [2] | 0.24% | ||
| Total annual fund operating expenses | 0.78% | 0.65% | 1.05% | [3] | ||
| Fee waiver/expense reimbursement | (0.03%) | [4] | (0.04%) | [2] | (0.15%) | [1],[5] |
| Total annual fund operating expenses after fee waiver/expense reimbursement | 0.75% | [4] | 0.61% | [2] | 0.90% | [3],[5] |
| [1] | Restated to show maximum 12b-1 fee rate of 0.25%. Actual rate for the prior fiscal year was 0.19%. |
| [2] | T. Rowe Price Associates, Inc., has contractually agreed (through September 30, 2023) to pay the operating expenses of the fund’s I Class excluding management fees; interest; expenses related to borrowings, taxes, and brokerage; nonrecurring, extraordinary expenses; and acquired fund fees and expenses (“I Class Operating Expenses”), to the extent the I Class Operating Expenses exceed 0.05% of the class’ average daily net assets. The agreement may only be terminated at any time after September 30, 2023, with approval by the fund’s Board of Directors. Any expenses paid under this agreement (and a previous limitation of 0.05%) are subject to reimbursement to T. Rowe Price Associates, Inc., by the fund whenever the fund’s I Class Operating Expenses are below 0.05%. However, no reimbursement will be made more than three years from the date such amounts were initially waived or reimbursed. The fund may only make repayments to T. Rowe Price Associates, Inc., if such repayment does not cause the I Class Operating Expenses (after the repayment is taken into account) to exceed the lesser of: (1) the limitation on I Class Operating Expenses in place at the time such amounts were waived or (2) the current expense limitation on I Class Operating Expenses. |
| [3] | Restated to reflect current fees. |
| [4] | T. Rowe Price Associates, Inc., has contractually agreed (through September 30, 2023) to waive its fees and/or bear any expenses (excluding interest; expenses related to borrowings, taxes, and brokerage; nonrecurring, extraordinary expenses; and acquired fund fees and expenses) that would cause the class’ ratio of expenses to average daily net assets to exceed 0.75%. The agreement may only be terminated at any time after September 30, 2023, with approval by the fund’s Board of Directors. Fees waived and expenses paid under this agreement (and a previous limitation of 0.79%) are subject to reimbursement to T. Rowe Price Associates, Inc., by the fund whenever the class’ expense ratio is below 0.75%. However, no reimbursement will be made more than three years from the date such amounts were initially waived or reimbursed. The fund may only make repayments to T. Rowe Price Associates, Inc., if such repayment does not cause the class’ expense ratio (after the repayment is taken into account) to exceed the lesser of: (1) the expense limitation in place at the time such amounts were waived or (2) the class’ current expense limitation. |
| [5] | T. Rowe Price Associates, Inc., has contractually agreed (through September 30, 2023) to waive its fees and/or bear any expenses (excluding interest; expenses related to borrowings, taxes, and brokerage; nonrecurring, extraordinary expenses; and acquired fund fees and expenses) that would cause the class’ ratio of expenses to average daily net assets to exceed 0.90%. The agreement may only be terminated at any time after September 30, 2023, with approval by the fund’s Board of Directors. Fees waived and expenses paid under this agreement (and a previous limitation of 0.94%) are subject to reimbursement to T. Rowe Price Associates, Inc., by the fund whenever the class’ expense ratio is below 0.90%. However, no reimbursement will be made more than three years from the date such amounts were initially waived or reimbursed. The fund may only make repayments to T. Rowe Price Associates, Inc., if such repayment does not cause the class’ expense ratio (after the repayment is taken into account) to exceed the lesser of: (1) the expense limitation in place at the time such amounts were waived or (2) the class’ current expense limitation. |
Expense Example - T. Rowe Price U.S. High Yield Fund - USD ($) |
Investor Class |
I Class |
Advisor Class |
|---|---|---|---|
| 1 Year | $ 77 | $ 62 | $ 92 |
| 3 Years | 246 | 204 | 319 |
| 5 Years | 430 | 358 | 565 |
| 10 Years | $ 963 | $ 807 | $ 1,269 |
The fund normally invests at least 80% of its net assets (including any borrowings for investment purposes) in U.S. high yield instruments. U.S. high yield instruments, commonly referred to as “junk” bonds, are debt instruments that are, at the time of purchase, rated below investment grade by a credit rating agency (i.e., Baa3 by Moody’s Investors Service, Inc. or below BBB- by S&P Global Ratings or Fitch Ratings, Inc.), or, if not rated by any major credit rating agency, deemed by T. Rowe Price to be below investment grade. The fund generally relies on a classification by Bloomberg or another unaffiliated data provider to determine whether a holding is economically tied to the U.S.
Most assets will typically be invested in U.S. issued instruments and U.S. dollar-denominated instruments. The fund may also invest up to 20% of its total assets in non-U.S. dollar-denominated foreign instruments.
The fund focuses its investments on high yield corporate bonds but may also invest in other income producing instruments including bank loans, convertible securities, and preferred stocks. The fund may purchase securities of any maturity or duration, and its weighted average maturity and duration will vary with market conditions.
In selecting investments, the fund relies extensively on rigorous credit research and analysis. In selecting bonds, the portfolio manager generally evaluates the income provided by the bond and the bond’s appreciation potential, as well as the issuer’s ability to make income and principal payments.
As with any fund, there is no guarantee that the fund will achieve its objective(s). The fund’s share price fluctuates, which means you could lose money by investing in the fund. The principal risks of investing in this fund, which may be even greater in bad or uncertain market conditions, are summarized as follows:
Credit quality An issuer of a debt instrument could suffer an adverse change in financial condition that results in a payment default (failure to make scheduled interest or principal payments), rating downgrade, or inability to meet a financial obligation. Securities that are rated below investment grade carry greater risk of default and should be considered speculative.
Junk investing Investments in bonds that are rated below investment grade, commonly referred to as junk bonds, and loans that are rated below investment grade, expose the fund to greater volatility and credit risk than investments in securities that are rated investment grade. Issuers of junk bonds and loans are usually not as strong financially and are more likely to suffer an adverse change in financial condition that would result in the inability to meet a financial obligation. As a result, bonds and loans rated below investment grade carry a higher risk of default and should be considered speculative.
Fixed income markets Economic and other market developments can adversely affect the fixed income securities markets. At times, participants in these markets may develop concerns about the ability of certain issuers of debt instruments to make timely principal and interest payments, or they may develop concerns about the ability of financial institutions that make markets in certain debt instruments to facilitate an orderly market. Those concerns could cause increased volatility and reduced liquidity in particular securities or in the overall fixed income markets and the related derivatives markets. A lack of liquidity or other adverse credit market conditions may hamper the fund’s ability to sell the debt instruments in which it invests or to find and purchase suitable debt instruments.
Market conditions The value of the fund’s investments may decrease, sometimes rapidly or unexpectedly, due to factors affecting an issuer held by the fund, particular industries, or the
overall securities markets. A variety of factors can increase the volatility of the fund’s holdings and markets generally, including political or regulatory developments, recessions, inflation, rapid interest rate changes, war, military conflict, or acts of terrorism, natural disasters, and outbreaks of infectious illnesses or other widespread public health issues such as the coronavirus pandemic and related governmental and public responses (including sanctions). Certain events may cause instability across global markets, including reduced liquidity and disruptions in trading markets, while some events may affect certain geographic regions, countries, sectors, and industries more significantly than others. Government intervention in markets may impact interest rates, market volatility, and security pricing. These adverse developments may cause broad declines in market value due to short-term market movements or for significantly longer periods during more prolonged market downturns.
Covenant lite loans Because covenant lite loans contain few or no financial maintenance covenants, they may not include terms that permit the lender of the loan to monitor the borrower’s financial performance and, if certain criteria are breached, declare a default, which would allow the lender to restructure the loan or take other action intended to help mitigate losses. As a result, the fund could experience relatively greater difficulty or delays in enforcing its rights on its holdings of covenant lite loans than its holdings of loans or securities with financial maintenance covenants, which may result in losses, especially during a downturn in the credit cycle.
Bank loans Investments in bank loans expose the fund to additional risks beyond those normally associated with more traditional debt instruments. The fund’s ability to receive payments in connection with a loan depends primarily on the financial condition of the borrower and whether or not a loan is secured by collateral, although there is no assurance that the collateral securing a loan will be sufficient to satisfy the loan obligation. In addition, bank loans often have contractual restrictions on resale, which can delay the sale and adversely impact the sale price. Transactions involving bank loans may have significantly longer settlement periods than more traditional investments (settlement can take longer than 7 days) and often involve borrowers whose financial condition is troubled or highly leveraged, which increases the risk that the fund may not receive its proceeds in a timely manner or that the fund may incur losses in order to pay redemption proceeds to its shareholders. In addition, loans are not registered under the federal securities laws like stocks and bonds, so investors in loans have less protection against improper practices than investors in registered securities.
Interest rates The prices of, and the income generated by, debt instruments held by the fund may be affected by changes in interest rates. A rise in interest rates typically causes the price of a fixed rate debt instrument to fall and its yield to rise. Conversely, a decline in interest rates typically causes the price of a fixed rate debt instrument to rise and the yield to fall. The prices and yields of inflation-linked bonds are directly impacted by the rate of inflation as well as changes in interest rates. Generally, funds with longer weighted average maturities and durations carry greater interest rate risk. Changes in monetary policy made by central banks and/or governments, such as the discontinuation and replacement of benchmark rates, are likely to affect the interest rates or yields of the securities in which the fund invests.
Callable bonds While a rise in interest rates is the principal source of interest rate risk for bond funds, falling rates bring the possibility that a bond may be “called,” or redeemed before maturity, and that the proceeds may need to be reinvested in lower-yielding securities.
Foreign investing Investments in the securities of non-U.S. issuers may be adversely affected by local, political, social, and economic conditions overseas; greater volatility; reduced liquidity; or decreases in foreign currency values relative to the U.S. dollar. The risks of investing outside the U.S. are heightened for any investments in emerging markets, which are susceptible to greater volatility than investments in developed markets.
Liquidity The fund may not be able to meet requests to redeem shares issued by the fund without significant dilution of the remaining shareholders’ interests in the fund. In addition, the fund may not be able to sell a holding in a timely manner at a desired price. Reduced liquidity in the bond markets can result from a number of events, such as limited trading activity, reductions in bond inventory, and rapid or unexpected changes in interest rates. Markets with lower overall liquidity could lead to greater price volatility and limit the fund’s ability to sell a holding at a suitable price.
Convertible securities and preferred stocks Convertible securities and preferred stocks carry credit and interest rate risk, along with other risks associated with both equity and fixed income securities, and convertible securities may be called back by the issuer prior to maturity at a price that is disadvantageous to the fund.
Portfolio turnover High portfolio turnover may adversely affect the fund’s performance and increase transaction costs, which could increase the fund’s expenses. High portfolio turnover may also result in the distribution of higher capital gains when compared with a fund with less active trading policies, which could have an adverse tax impact if the fund’s shares are held in a taxable account.
Active management The fund’s overall investment program and holdings selected by the fund’s investment adviser may underperform the broad markets, relevant indices, or other funds with similar objectives and investment strategies.
Cybersecurity breaches The fund could be harmed by intentional cyberattacks and other cybersecurity breaches, including unauthorized access to the fund’s assets, customer data and confidential shareholder information, or other proprietary information. In addition, a cybersecurity breach could cause one of the fund’s service providers or financial intermediaries to suffer unauthorized data access, data corruption, or loss of operational functionality.
The following performance information provides some indication of the risks of investing in the fund by showing its performance history, which includes performance information from when the fund operated as the Henderson High Yield Opportunities Fund (Predecessor Fund). On May 22, 2017, the fund acquired all of the assets, subject to the liabilities, of the Predecessor Fund through a tax-free reorganization (Reorganization). As a result of the Reorganization, shareholders of the Predecessor Fund’s Class A and Class C shares received Advisor Class
shares of the fund, and shareholders of the Predecessor Fund’s Class I and Class R6 shares received I Class shares of the fund. In addition, as a result of the Reorganization, the fund’s Advisor Class adopted the Predecessor Fund’s Class A performance and accounting history, and the fund’s I Class adopted the Predecessor Fund’s Class I performance and accounting history. The fund has substantially similar investment objectives and strategies as the Predecessor Fund, and the fund is managed by the same portfolio manager as the Predecessor Fund. The performance information represents only past performance (before and after taxes) and is not necessarily an indication of future results.
The following bar chart illustrates how much returns can differ from year to year by showing calendar year returns and the best and worst calendar quarter returns during those years for the Advisor Class (and, prior to the Reorganization, the Predecessor Fund’s Class A). The returns in the bar chart may have been different if the expenses for the fund’s Advisor Class had been in effect during the periods prior to the Reorganization. In addition, the performance information presented prior to the Reorganization was calculated using the Predecessor Fund’s valuation methodologies, which differ in some respects from those of the fund. Returns for the fund’s Investor Class and I Class vary since they have different expenses (returns for the Predecessor Fund’s other share classes also varied since they had different expenses).
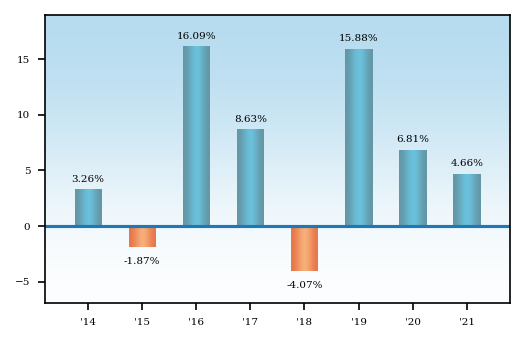
The fund’s return for the six months ended 6/30/22 was -16.86%.
Quarter Ended | Total Return | Quarter Ended | Total Return | |||||
Best Quarter | 6/30/20 | 12.51% | Worst Quarter | 3/31/20 | -14.55% |
The following table reflects the average annual returns of the fund (including information prior to May 22, 2017, when the fund operated as the Predecessor Fund), and also compares the returns with a relevant broad-based market index. The performance information for the fund’s Advisor Class and I Class includes performance information for the Predecessor Fund’s Class A and Class I, respectively, and has not been adjusted to reflect the fees and expenses of the Advisor Class or I Class. The returns presented in the table may have been different if the
expenses for each of the fund’s Advisor Class and I Class had been in effect during the periods prior to the Reorganization. The fund’s Investor Class performance information does not include performance information prior to the Reorganization since the Investor Class commenced operations in 2017 and did not assume the performance history of the Predecessor Fund. The Investor Class would have had similar performance to the fund’s Advisor Class because they share the same portfolio; however, its performance, had it existed over the periods shown, would have been higher since the Investor Class has had lower expenses than the Advisor Class for the periods presented.
In addition, the table shows hypothetical after-tax returns to demonstrate how taxes paid by a shareholder may influence returns. After-tax returns are calculated using the historical highest individual federal marginal income tax rates and do not reflect the impact of state and local taxes. Actual after-tax returns depend on an investor’s tax situation and may differ from those shown. After-tax returns shown are not relevant to investors who hold their fund shares through tax-deferred arrangements, such as a 401(k) account or an IRA. After-tax returns are shown only for the Advisor Class and will differ for other share classes.
Average Annual Total Returns - T. Rowe Price U.S. High Yield Fund |
Label |
1 Year |
5 Years |
Since Inception |
Inception Date |
||
|---|---|---|---|---|---|---|---|
| Investor Class | 4.82% | 5.84% | May 19, 2017 | ||||
| I Class | 4.98% | 6.51% | 6.51% | [1] | Apr. 30, 2013 | ||
| Advisor Class | 4.66% | 6.19% | 6.22% | Apr. 30, 2013 | |||
| Advisor Class | After Taxes on Distributions | 2.24% | 3.64% | 3.54% | ||||
| Advisor Class | After Taxes on Distributions and Sales | 2.82% | 3.62% | 3.55% | ||||
| ICE BofA US High Yield Constrained Index | ICE BofA US High Yield Constrained Index (reflects no deduction for fees, expenses, or taxes) | ||||||
| ICE BofA US High Yield Constrained Index | [2] | 5.43% | |||||
| ICE BofA US High Yield Constrained Index | 5.35% | 6.08% | 5.62% | [3] | |||
| [1] | Reflects the performance information from the inception date of the Predecessor Fund (April 30, 2013). |
| [2] | Return since 4/30/13. |
| [3] | Return since 5/19/17. |