
EXHIBIT 99.2
www.thorindustries.com FISCAL YEAR & FOURTH QUARTER FISCAL 2022 FINANCIAL RESULTS
FORWARD - LOOKING STATEMENTS This presentation includes certain statements that are “forward - looking” statements within the meaning of the U . S . Private Securities Litigation Reform Act of 1995 , Section 27 A of the Securities Act of 1933 , as amended, and Section 21 E of the Securities Exchange Act of 1934 , as amended . These forward - looking statements are made based on management’s current expectations and beliefs regarding future and anticipated developments and their effects upon THOR, and inherently involve uncertainties and risks . These forward - looking statements are not a guarantee of future performance . We cannot assure you that actual results will not differ materially from our expectations . Factors which could cause materially different results include, among others : the impact of inflation on the cost of our products as well as on general consumer demand ; the effect of raw material and commodity price fluctuations, and/or raw material, commodity or chassis supply constraints ; the impact of war, military conflict, terrorism and/or cyber - attacks, including state - sponsored or ransom attacks ; the impact of sudden or significant adverse changes in the cost and/or availability of energy or fuel, including those caused by geopolitical events, on our costs of operation, on raw material prices, on our independent dealers or on retail customers ; the dependence on a small group of suppliers for certain components used in production, including chassis ; interest rate fluctuations and their potential impact on the general economy and, specifically, on our profitability and on our independent dealers and consumers ; the extent and impact from the continuation of the COVID - 19 pandemic, along with the responses to contain the spread of the virus, or its variants, by various governmental entities or other actors, which may have negative effects on retail customer demand, our independent dealers, our supply chain, our labor force, our production or other aspects of our business ; the ability to ramp production up or down quickly in response to rapid changes in demand while also managing costs and market share ; the level and magnitude of warranty and recall claims incurred ; the ability of our suppliers to financially support any defects in their products ; legislative, regulatory and tax law and/or policy developments including their potential impact on our independent dealers, retail customers or on our suppliers ; the costs of compliance with governmental regulation ; the impact of an adverse outcome or conclusion related to current or future litigation or regulatory investigations ; public perception of and the costs related to environmental, social and governance matters ; legal and compliance issues including those that may arise in conjunction with recently completed transactions ; lower consumer confidence and the level of discretionary consumer spending ; the impact of exchange rate fluctuations ; restrictive lending practices which could negatively impact our independent dealers and/or retail consumers ; management changes ; the success of new and existing products and services ; the ability to maintain strong brands and develop innovative products that meet consumer demands ; the ability to efficiently utilize existing production facilities ; changes in consumer preferences ; the risks associated with acquisitions, including : the pace and successful closing of an acquisition, the integration and financial impact thereof, the level of achievement of anticipated operating synergies from acquisitions, the potential for unknown or understated liabilities related to acquisitions, the potential loss of existing customers of acquisitions and our ability to retain key management personnel of acquired companies ; a shortage of necessary personnel for production and increasing labor costs and related employee benefits to attract and retain production personnel in times of high demand ; the loss or reduction of sales to key independent dealers ; disruption of the delivery of units to independent dealers ; increasing costs for freight and transportation ; the ability to protect our information technology systems from data breaches, cyber - attacks and/or network disruptions ; asset impairment charges ; competition ; the impact of losses under repurchase agreements ; the impact of the strength of the U . S . dollar on international demand for products priced in U . S . dollars ; general economic, market and political conditions in the various countries in which our products are produced and/or sold ; the impact of changing emissions and other related climate change regulations in the various jurisdictions in which our products are produced, used and/or sold ; changes to our investment and capital allocation strategies or other facets of our strategic plan ; and changes in market liquidity conditions, credit ratings and other factors that may impact our access to future funding and the cost of debt . These and other risks and uncertainties are discussed more fully in Item 1 A of our Annual Report on Form 10 - K for the year ended July 31 , 2022 . We disclaim any obligation or undertaking to disseminate any updates or revisions to any forward - looking statements contained in this presentation or to reflect any change in our expectations after the date hereof or any change in events, conditions or circumstances on which any statement is based, except as required by law . 2
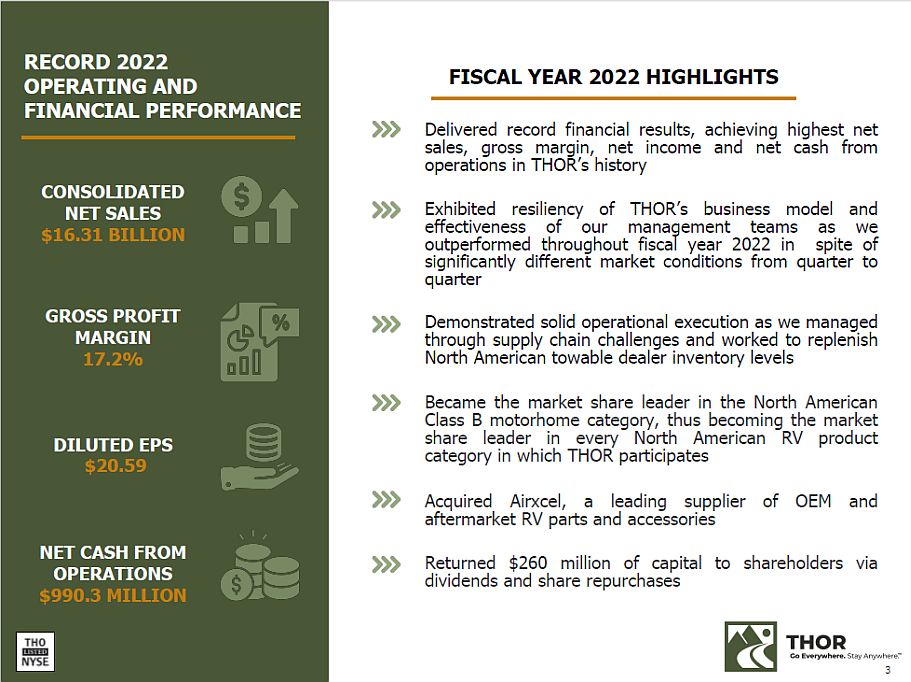
CONSOLIDATED NET SALES $16.31 BILLION Delivered record financial results, achieving highest net sales, gross margin, net income and net cash from operations in THOR’s history Exhibited resiliency of THOR’s business model and effectiveness of our management teams as we outperformed throughout fiscal year 2022 in spite of significantly different market conditions from quarter to quarter Demonstrated solid operational execution as we managed through supply chain challenges and worked to replenish North American towable dealer inventory levels Became the market share leader in the North American Class B motorhome category, thus becoming the market share leader in every North American RV product category in which THOR participates Acquired Airxcel, a leading supplier of OEM and aftermarket RV parts and accessories Returned $260 million of capital to shareholders via dividends and share repurchases GROSS PROFIT MARGIN 17.2% DILUTED EPS $20.59 RECORD 2022 OPERATING AND FINANCIAL PERFORMANCE NET CASH FROM OPERATIONS $990.3 MILLION FISCAL YEAR 2022 HIGHLIGHTS 3
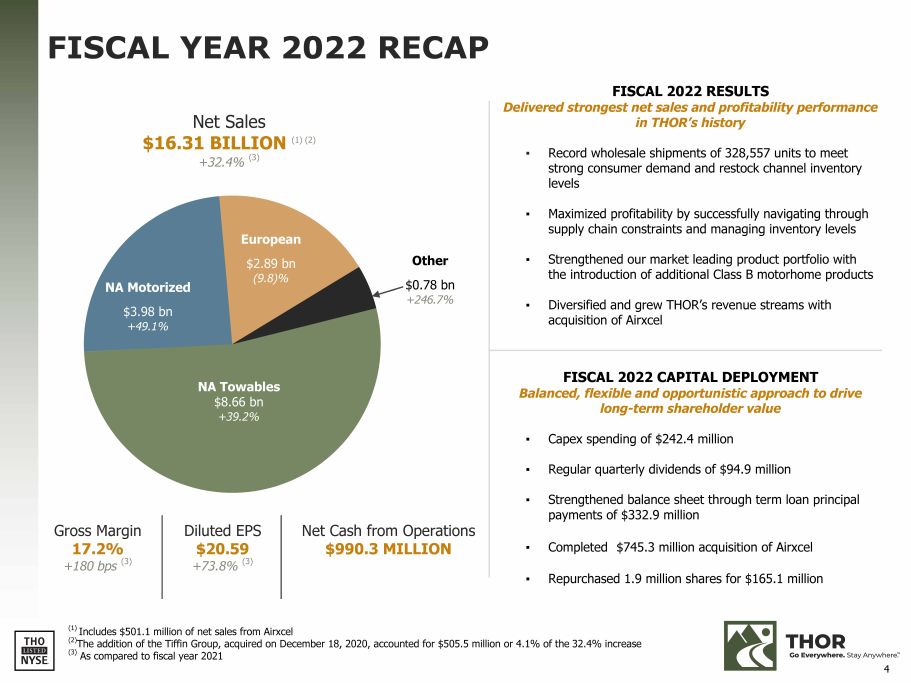
FISCAL YEAR 2022 RECAP European $2.89 bn (9.8)% NA Motorized $3.98 bn +49.1% NA Towables $8.66 bn +39.2% Other $0.78 bn +246.7% Gross Margin 17.2% +180 bps (3) Diluted EPS $20.59 +73.8% (3) Net Sales $16.31 BILLION (1) (2) +32.4% (3) Net Cash from Operations $990.3 MILLION (1) Includes $501.1 million of net sales from Airxcel (2) The addition of the Tiffin Group, acquired on December 18, 2020, accounted for $505.5 million or 4.1% of the 32.4% increase (3) As compared to fiscal year 2021 4 FISCAL 2022 CAPITAL DEPLOYMENT Balanced, flexible and opportunistic approach to drive long - term shareholder value ▪ Capex spending of $242.4 million ▪ Regular quarterly dividends of $94.9 million ▪ Strengthened balance sheet through term loan principal payments of $332.9 million ▪ Completed $745.3 million acquisition of Airxcel ▪ Repurchased 1.9 million shares for $165.1 million FISCAL 2022 RESULTS Delivered strongest net sales and profitability performance in THOR’s history ▪ Record wholesale shipments of 328,557 units to meet strong consumer demand and restock channel inventory levels ▪ Maximized profitability by successfully navigating through supply chain constraints and managing inventory levels ▪ Strengthened our market leading product portfolio with the introduction of additional Class B motorhome products ▪ Diversified and grew THOR’s revenue streams with acquisition of Airxcel
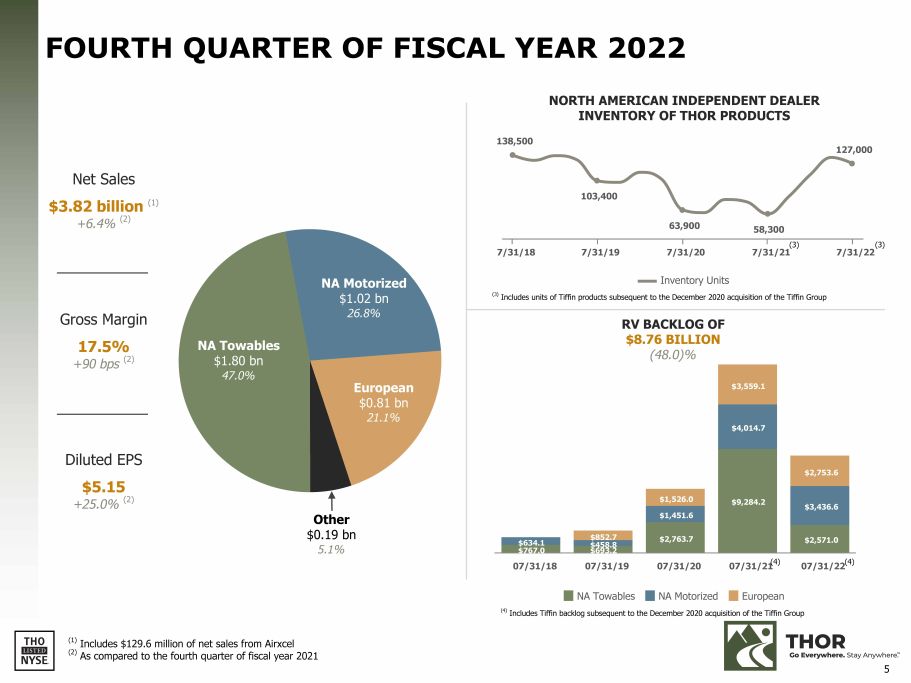
$767.0 $693.2 $2,763.7 $9,284.2 $2,571.0 $634.1 $458.8 $1,451.6 $4,014.7 $3,436.6 $852.7 $1,526.0 $3,559.1 $2,753.6 NA Towables NA Motorized European (4) Includes Tiffin backlog subsequent to the December 2020 acquisition of the Tiffin Group 07/31/18 07/31/19 07/31/20 European $0.81 bn 21.1% NA Motorized $1.02 bn 26.8% NA Towables $1.80 bn 47.0% Other $0.19 bn 5.1% 103,400 63,900 58,300 7/31/18 7/31/19 7/31/20 7/31/22 NORTH AMERICAN INDEPENDENT DEALER INVENTORY OF THOR PRODUCTS 138,500 127,000 RV BACKLOG OF $8.76 BILLION (48.0)% Inventory Units (3) Includes units of Tiffin products subsequent to the December 2020 acquisition of the Tiffin Group 5 (1) Includes $129.6 million of net sales from Airxcel (2) As compared to the fourth quarter of fiscal year 2021 FOURTH QUARTER OF FISCAL YEAR 2022 Gross Margin 17.5% +90 bps (2) Diluted EPS $5.15 +25.0% (2) Net Sales $3.82 billion (1) +6.4% (2) (3) (3) 7/31/21 07/31/22 (4) 07/31/21 (4)
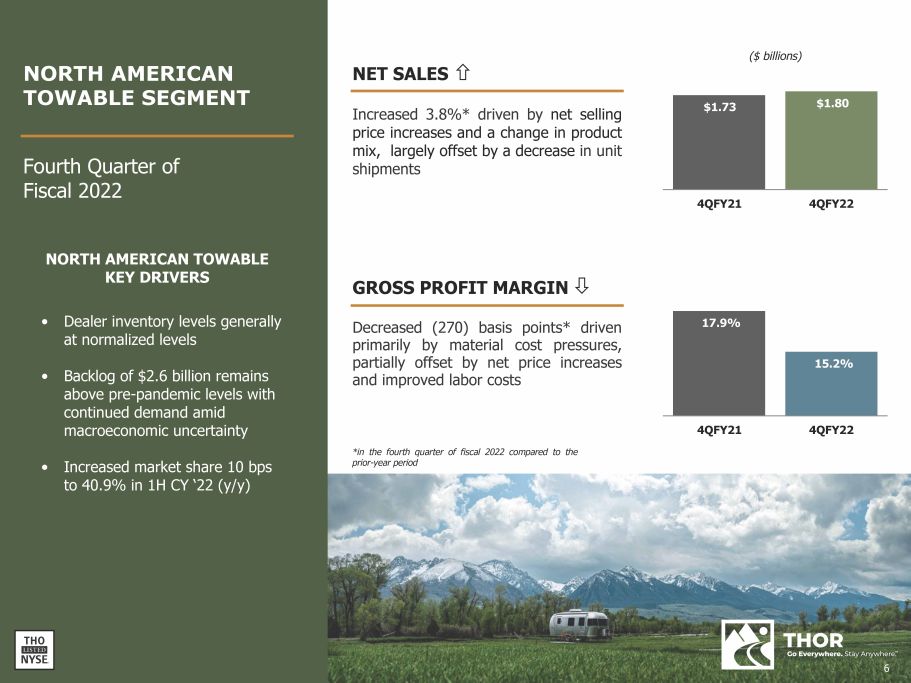
($ billions) $1.73 $1.80 4QFY21 4QFY22 17.9% 15.2% 4QFY21 4QFY22 NET SALES Increased 3 . 8 % * driven by net selling price increases and a change in product mix, largely offset by a decrease in unit shipments GROSS PROFIT MARGIN Decreased ( 270 ) basis points* driven primarily by material cost pressures, partially offset by net price increases and improved labor costs NORTH AMERICAN TOWABLE KEY DRIVERS • Dealer inventory levels generally at normalized levels • Backlog of $2.6 billion remains above pre - pandemic levels with continued demand amid macroeconomic uncertainty • Increased market share 10 bps to 40.9% in 1H CY ‘22 (y/y) Fourth Quarter of Fiscal 2022 *in the fourth quarter of fiscal 2022 compared to the prior - year period NORTH AMERICAN TOWABLE SEGMENT 6
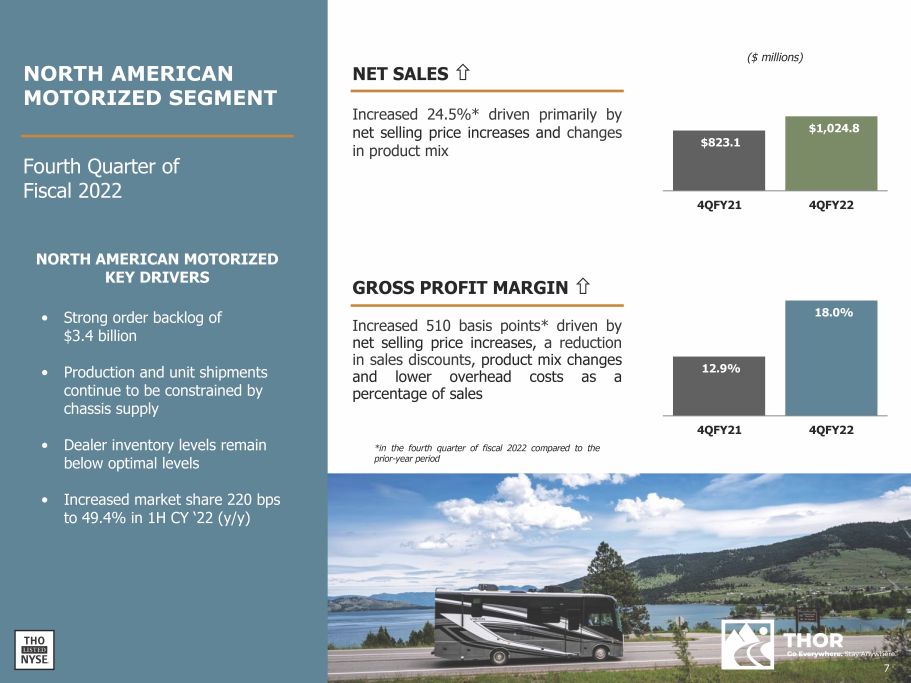
NET SALES Increased 24 . 5 % * driven primarily by net selling price increases and changes in product mix ($ millions) $823.1 $1,024.8 4QFY21 4QFY22 12.9% 18.0% 4QFY21 4QFY22 GROSS PROFIT MARGIN Increased 510 basis points* driven by net selling price increases, a reduction in sales discounts, product mix changes and lower overhead costs as a percentage of sales *in the fourth quarter of fiscal 2022 compared to the prior - year period NORTH AMERICAN MOTORIZED KEY DRIVERS • Strong order backlog of $3.4 billion • Production and unit shipments continue to be constrained by chassis supply • Dealer inventory levels remain below optimal levels • Increased market share 220 bps to 49.4% in 1H CY ‘22 (y/y) Fourth Quarter of Fiscal 2022 7 NORTH AMERICAN MOTORIZED SEGMENT
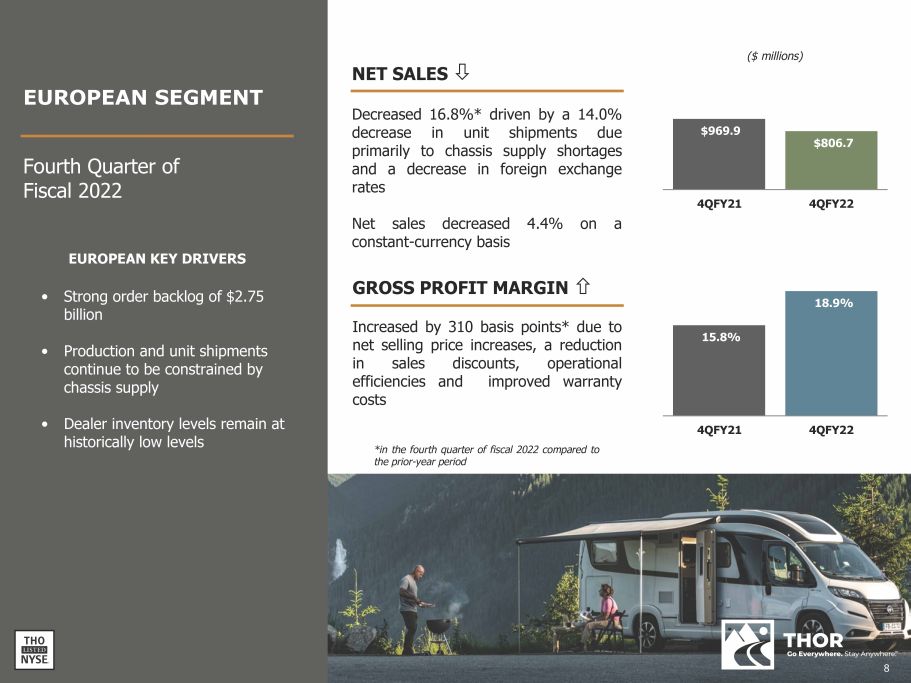
EUROPEAN KEY DRIVERS • Strong order backlog of $2.75 billion • Production and unit shipments continue to be constrained by chassis supply • Dealer inventory levels remain at historically low levels NET SALES Decreased 16.8%* driven by a 14.0% decrease in unit shipments due supply shortages foreign exchange primarily to chassis and a decrease in rates Net sales decreased 4.4% on a constant - currency basis GROSS PROFIT MARGIN Increased by 310 basis points* due to net selling price increases, a reduction in sales discounts, operational efficiencies and improved warranty costs ($ millions) $969.9 $806.7 4QFY21 4QFY22 15.8% 18.9% 4QFY21 4QFY22 *in the fourth quarter of fiscal 2022 compared to the prior - year period EUROPEAN SEGMENT Fourth Quarter of Fiscal 2022 8
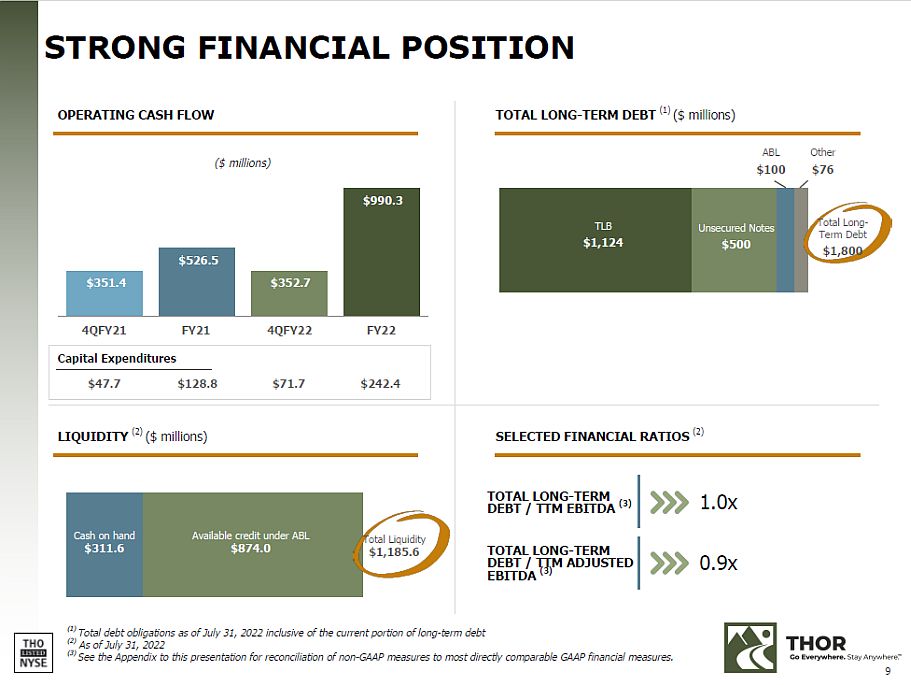
TOTAL LONG - TERM DEBT / TTM EBITDA (3) 1.0x TOTAL LONG - TERM DEBT / TTM ADJUSTED EBITDA (3) 0.9x STRONG FINANCIAL POSITION ($ millions) $351.4 $526.5 $352.7 $990.3 4QFY22 FY22 OPERATING CASH FLOW TOTAL LONG - TERM DEBT (1) ($ millions) (1) Total debt obligations as of July 31, 2022 inclusive of the current portion of long - term debt (2) As of July 31, 2022 (3) See the Appendix to this presentation for reconciliation of non - GAAP measures to most directly comparable GAAP financial measures. LIQUIDITY (2) ($ millions) SELECTED FINANCIAL RATIOS (2) TLB $1,124 Unsecured Notes $500 ABL $100 Other $76 Total Long - Term Debt $1,800 Cash on hand $311.6 Available credit under ABL $874.0 Total Liquidity $1,185.6 4QFY21 FY21 Capital Expenditures $47.7 $128.8 $71.7 $242.4 9
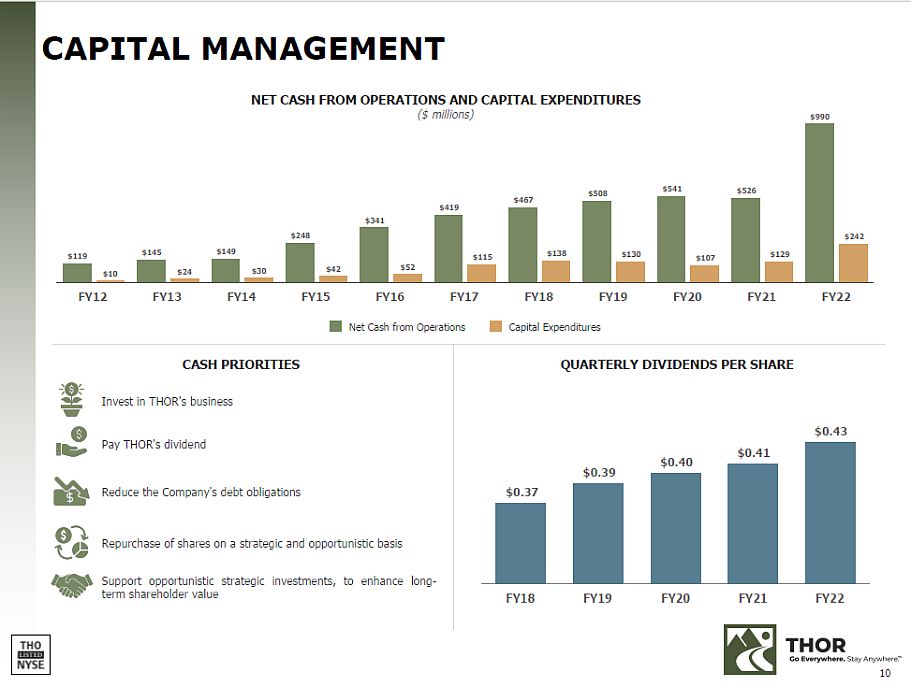
$119 $145 $149 $248 $341 $419 $467 $508 $541 $526 $990 $10 $24 $30 $42 $52 $115 $138 $130 $107 $129 $242 FY16 FY17 Net Cash from Operations FY18 FY19 Capital Expenditures FY12 FY13 FY14 FY15 FY20 FY21 FY22 CAPITAL MANAGEMENT CASH PRIORITIES Invest in THOR's business Pay THOR's dividend Reduce the Company's debt obligations Repurchase of shares on a strategic and opportunistic basis Support opportunistic strategic investments, to enhance long - term shareholder value NET CASH FROM OPERATIONS AND CAPITAL EXPENDITURES ($ millions) $0.37 $0.39 $0.40 $0.41 $0.43 FY18 FY19 FY20 FY21 FY22 QUARTERLY DIVIDENDS PER SHARE 10
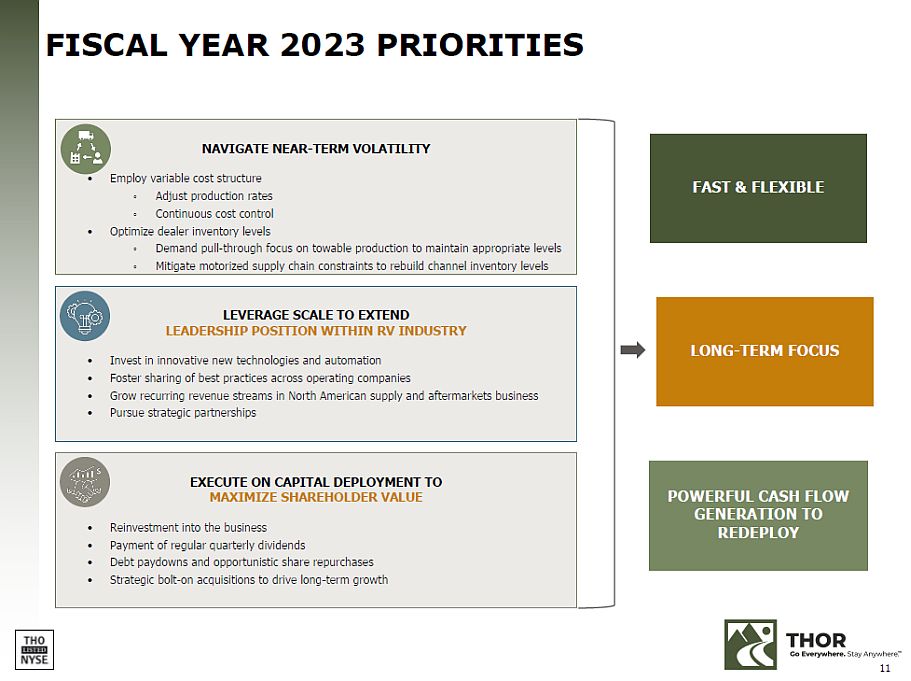
FISCAL YEAR 2023 PRIORITIES NAVIGATE NEAR - TERM VOLATILITY • Employ variable cost structure ◦ Adjust production rates ◦ Continuous cost control • Optimize dealer inventory levels ◦ Demand pull - through focus on towable production to maintain appropriate levels ◦ Mitigate motorized supply chain constraints to rebuild channel inventory levels LEVERAGE SCALE TO EXTEND LEADERSHIP POSITION WITHIN RV INDUSTRY • Invest in innovative new technologies and automation • Foster sharing of best practices across operating companies • Grow recurring revenue streams in North American supply and aftermarkets business • Pursue strategic partnerships EXECUTE ON CAPITAL DEPLOYMENT TO MAXIMIZE SHAREHOLDER VALUE • Reinvestment into the business • Payment of regular quarterly dividends • Debt paydowns and opportunistic share repurchases • Strategic bolt - on acquisitions to drive long - term growth FAST & FLEXIBLE LONG - TERM FOCUS POWERFUL CASH FLOW GENERATION TO REDEPLOY 11
APPENDIX 12
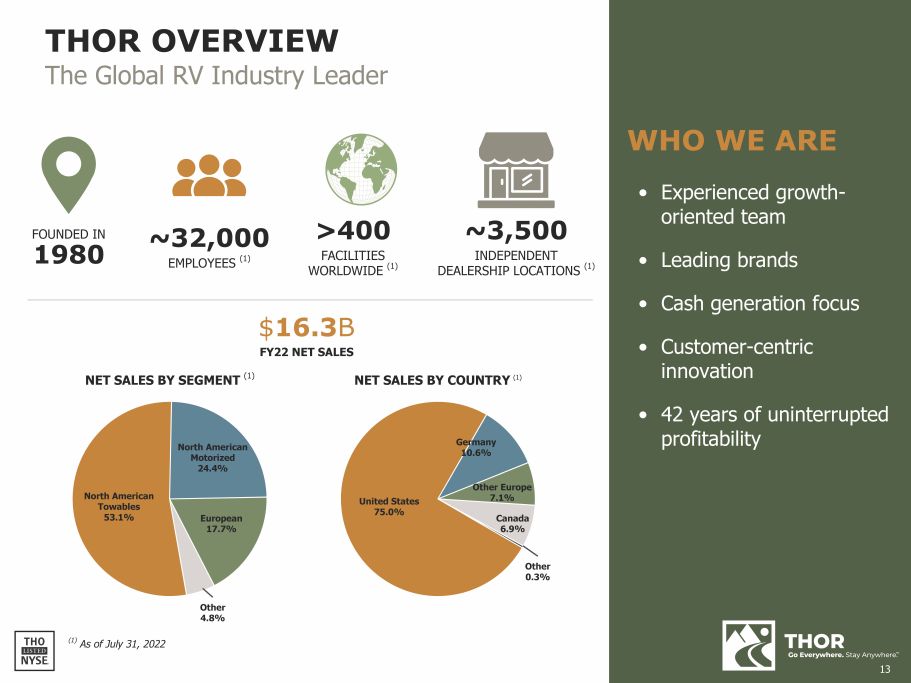
THOR OVERVIEW The Global RV Industry Leader WHO WE ARE • Experienced growth - oriented team • Leading brands • Cash generation focus • Customer - centric innovation • 42 years of uninterrupted profitability FOUNDED IN 1980 ~32,000 EMPLOYEES (1) >400 WORLDWIDE FACILITIES (1) ~3,500 INDEPENDENT DEALERSHIP LOCATIONS (1) NET SALES BY SEGMENT (1) NET SALES BY COUNTRY (1) $ 16.3 B FY22 NET SALES Other 4.8% (1) As of July 31, 2022 United States 75.0% Germany 10.6% Other Europe 7.1% Canada 6.9% Other 0.3% North American Towables 53.1% North American Motorized 24.4% European 17.7% 13
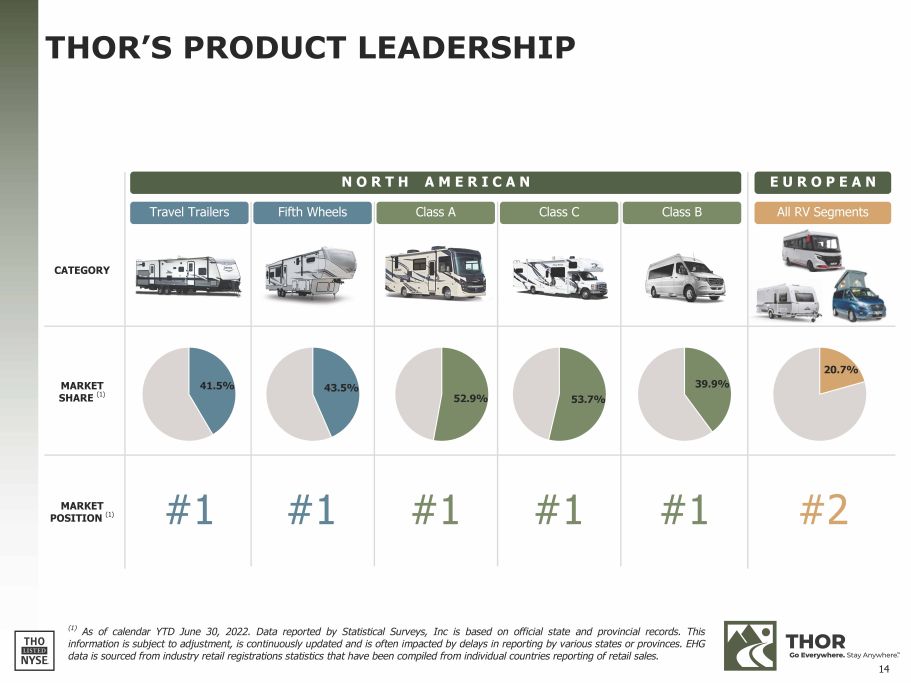
THOR’S PRODUCT LEADERSHIP ( 1 ) As of calendar YTD June 30 , 2022 . Data reported by Statistical Surveys, Inc is based on official state and provincial records . This information is subject to adjustment, is continuously updated and is often impacted by delays in reporting by various states or provinces . EHG data is sourced from industry retail registrations statistics that have been compiled from individual countries reporting of retail sales . CATEGORY N O R T H A M E R I C A N E U R O P E A N All RV Segments Travel Trailers Fifth Wheels Class A Class C Class B MARKET SHARE (1) 41.5% 43.5% 52.9% 53.7% 39.9% 20.7% MARKET POSITION (1) #1 #1 #1 #1 #1 #2 14
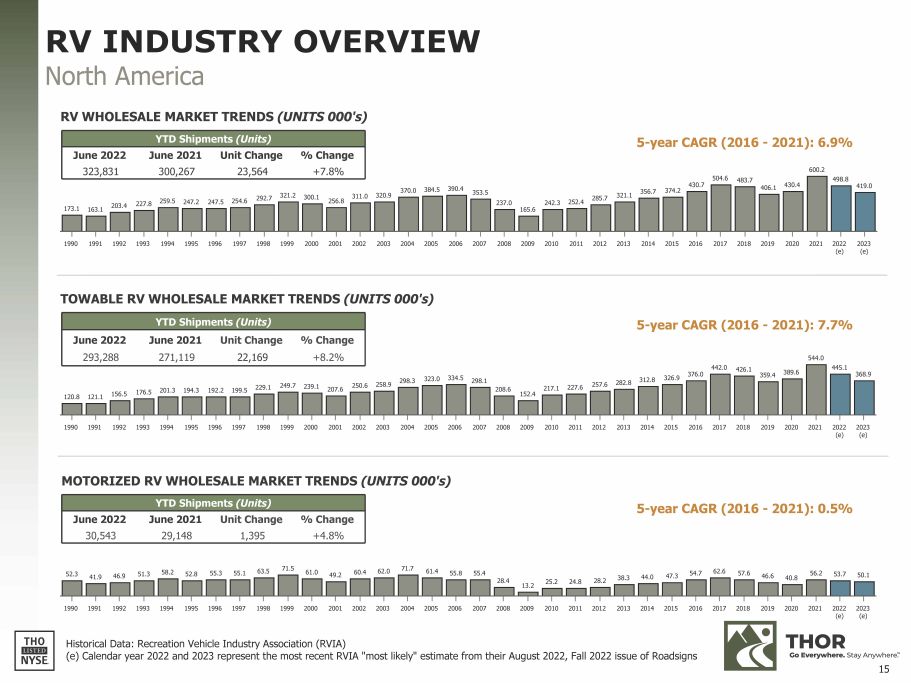
120.8 121.1 156.5 176.5 201.3 194.3 192.2 199.5 229.1 249.7 239.1 298.3 207.6 250.6 258.9 323.0 334.5 298.1 208.6 217.1 227.6 152.4 257.6 282.8 312.8 326.9 442.0 376.0 426.1 359.4 389.6 544.0 445.1 368.9 1990 1991 1992 1993 1994 1995 1996 1997 1998 1999 2000 2001 2002 2003 2004 2005 2006 2007 2008 2009 2010 2011 2012 2013 2014 2015 2016 2017 2018 2019 2020 2021 2022 2023 (e) (e) 173.1 163.1 203.4 227.8 259.5 247.2 247.5 254.6 292.7 321.2 300.1 256.8 311.0 320.9 370.0 384.5 390.4 353.5 237.0 165.6 242.3 252.4 285.7 321.1 430.7 356.7 374.2 504.6 483.7 406.1 430.4 600.2 498.8 419.0 1990 1991 1992 1993 1994 1995 1996 1997 1998 1999 2000 2001 2002 2003 2004 2005 2006 2007 2008 2009 2010 2011 2012 2013 2014 2015 2016 2017 2018 2019 2020 2021 2022 2023 (e) (e) TOWABLE RV WHOLESALE MARKET TRENDS (UNITS 000's) YTD Shipments (Units) June 2022 323,831 June 2021 300,267 Unit Change 23,564 % Change +7.8% YTD Shipments (Units) June 2022 June 2021 Unit Change % Change 293,288 271,119 22,169 +8.2% 52.3 41.9 46.9 51.3 58.2 52.8 55.3 55.1 63.5 71.5 61.0 49.2 60.4 62.0 71.7 61.4 13.2 25.2 24.8 28.2 38.3 44.0 47.3 54.7 62.6 57.6 46.6 40.8 56.2 53.7 50.1 55.8 55.4 28.4 2006 2007 2008 1990 1991 1992 1993 1994 1995 1996 1997 1998 1999 2000 2001 2002 2003 2004 2005 2009 2010 2011 2012 2013 2014 2015 2016 2017 2018 2019 2020 2021 2022 2023 (e) (e) YTD Shipments (Units) June 2022 June 2021 Unit Change % Change 30,543 29,148 1,395 +4.8% Historical Data: Recreation Vehicle Industry Association (RVIA) 5 - year CAGR (2016 - 2021): 6.9% 5 - year CAGR (2016 - 2021): 7.7% 5 - year CAGR (2016 - 2021): 0.5% RV INDUSTRY OVERVIEW North America RV WHOLESALE MARKET TRENDS (UNITS 000's) MOTORIZED RV WHOLESALE MARKET TRENDS (UNITS 000's) (e) Calendar year 2022 and 2023 represent the most recent RVIA "most likely" estimate from their August 2022, Fall 2022 issue of Roadsigns 15
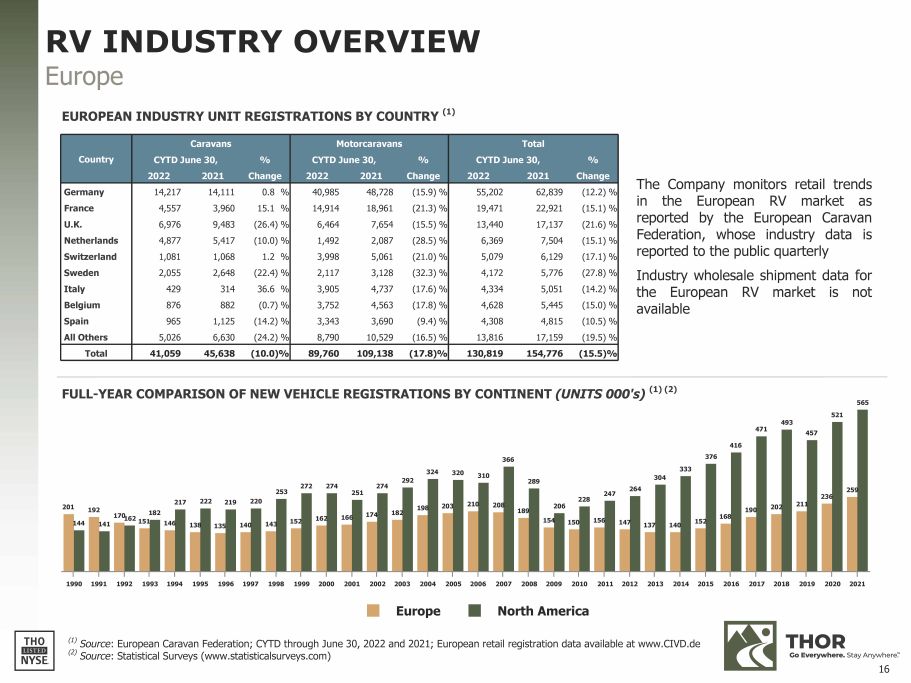
Country Caravans CYTD June 30, 2022 2021 % Change Motorcaravans CYTD June 30, 2022 2021 % Change Total CYTD June 30, 2022 2021 % Change Germany 14,217 14,111 0.8 % 40,985 48,728 (15.9) % 55,202 62,839 (12.2) % France 4,557 3,960 15.1 % 14,914 18,961 (21.3) % 19,471 22,921 (15.1) % U.K. 6,976 9,483 (26.4) % 6,464 7,654 (15.5) % 13,440 17,137 (21.6) % Netherlands 4,877 5,417 (10.0) % 1,492 2,087 (28.5) % 6,369 7,504 (15.1) % Switzerland 1,081 1,068 1.2 % 3,998 5,061 (21.0) % 5,079 6,129 (17.1) % Sweden 2,055 2,648 (22.4) % 2,117 3,128 (32.3) % 4,172 5,776 (27.8) % Italy 429 314 36.6 % 3,905 4,737 (17.6) % 4,334 5,051 (14.2) % Belgium 876 882 (0.7) % 3,752 4,563 (17.8) % 4,628 5,445 (15.0) % Spain 965 1,125 (14.2) % 3,343 3,690 (9.4) % 4,308 4,815 (10.5) % All Others 5,026 6,630 (24.2) % 8,790 10,529 (16.5) % 13,816 17,159 (19.5) % Total 41,059 45,638 (10.0)% 89,760 109,138 (17.8)% 130,819 154,776 (15.5)% The Company monitors retail trends in the European RV market as reported by the European Caravan Federation, whose industry data is reported to the public quarterly Industry wholesale shipment data for the European RV market is not available 201 192 146 138 135 140 143 152 162 166 174 182 198 203 210 208 189 154 150 156 147 137 140 152 168 190 202 211 236 259 144 141 170 162 151 182 217 222 219 220 253 272 274 251 274 292 324 320 310 366 289 206 228 247 264 304 333 376 416 471 493 457 521 565 1990 1991 1992 1993 1994 1995 1996 1997 1998 1999 2000 2001 2002 2003 2004 2005 2006 2007 2008 2009 2010 2011 2012 2013 2014 2015 2016 2017 2018 2019 2020 2021 Europe North America (1) Source : European Caravan Federation; CYTD through June 30, 2022 and 2021; European retail registration data available at www.CIVD.de FULL - YEAR COMPARISON OF NEW VEHICLE REGISTRATIONS BY CONTINENT (UNITS 000's) (1) (2) RV INDUSTRY OVERVIEW Europe EUROPEAN INDUSTRY UNIT REGISTRATIONS BY COUNTRY (1) (2) Source : Statistical Surveys (www.statisticalsurveys.com) 16
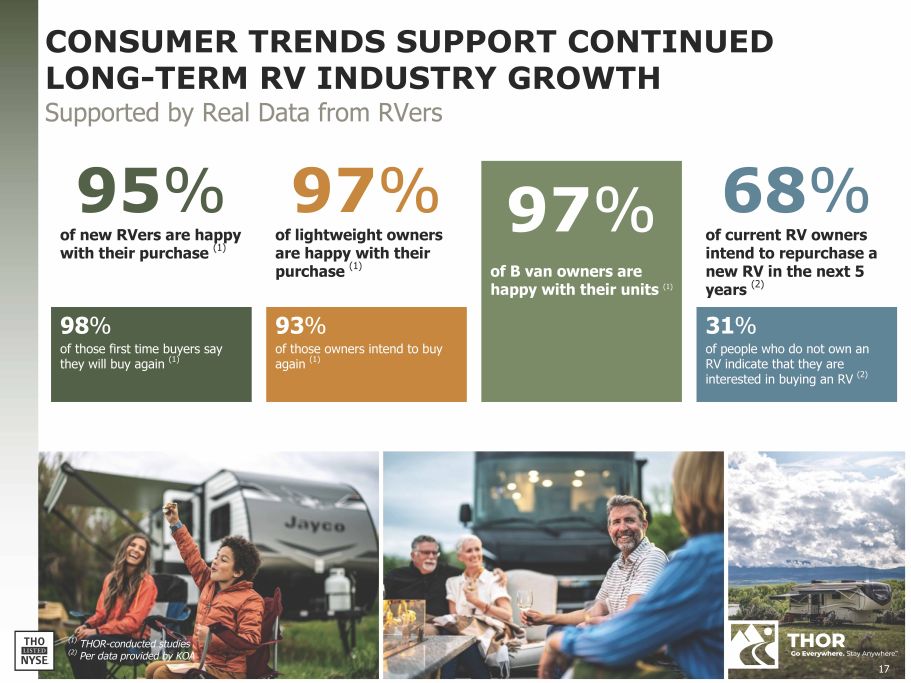
CONSUMER TRENDS SUPPORT CONTINUED LONG - TERM RV INDUSTRY GROWTH (2) Per data provided by KOA 17 Supported by Real Data from RVers 97 % of B van owners are happy with their units (1) 97 % of lightweight owners are happy with their purchase (1) 93 % of those owners intend to buy again (1) 95 % of new RVers are happy with their purchase (1) 98 % of those first time buyers say they will buy again (1) 68 % of current RV owners intend to repurchase a new RV in the next 5 years (2) 31 % of people who do not own an RV indicate that they are interested in buying an RV (2) (1) THOR - conducted studies
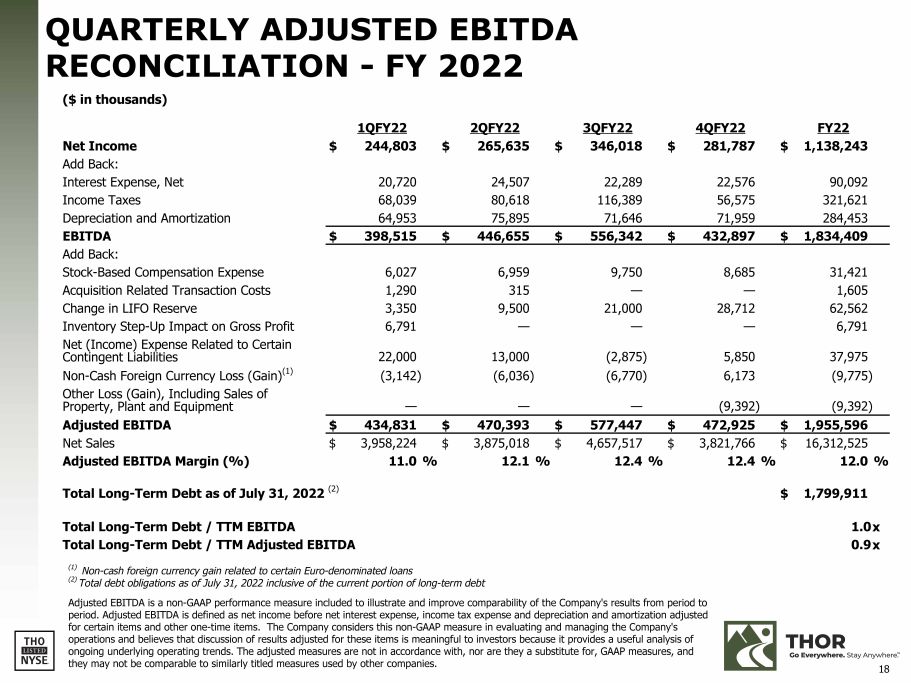
18 QUARTERLY ADJUSTED EBITDA RECONCILIATION - FY 2022 ($ in thousands) Net Income 1QFY22 $ 244,803 2QFY22 $ 265,635 3QFY22 $ 346,018 4QFY22 $ 281,787 FY22 $ 1,138,243 Add Back: Interest Expense, Net 20,720 24,507 22,289 22,576 90,092 Income Taxes 68,039 80,618 116,389 56,575 321,621 Depreciation and Amortization 64,953 75,895 71,646 71,959 284,453 EBITDA $ 398,515 $ 446,655 $ 556,342 $ 432,897 $ 1,834,409 Add Back: Stock - Based Compensation Expense 6,027 6,959 9,750 8,685 31,421 Acquisition Related Transaction Costs 1,290 315 — — 1,605 Change in LIFO Reserve 3,350 9,500 21,000 28,712 62,562 Inventory Step - Up Impact on Gross Profit 6,791 — — — 6,791 Net (Income) Expense Related to Certain Contingent Liabilities 22,000 13,000 (2,875) 5,850 37,975 Non - Cash Foreign Currency Loss (Gain) (1) (3,142) (6,036) (6,770) 6,173 (9,775) Other Loss (Gain), Including Sales of Property, Plant and Equipment — — — (9,392) (9,392) Adjusted EBITDA $ 434,831 $ 470,393 $ 577,447 $ 472,925 $ 1,955,596 Net Sales $ 3,958,224 $ 3,875,018 $ 4,657,517 $ 3,821,766 $ 16,312,525 Adjusted EBITDA Margin (%) 11.0 % 12.1 % 12.4 % 12.4 % 12.0 % Total Long - Term Debt as of July 31, 2022 (2) $ 1,799,911 Total Long - Term Debt / TTM EBITDA Total Long - Term Debt / TTM Adjusted EBITDA (1) Non - cash foreign currency gain related to certain Euro - denominated loans (2) Total debt obligations as of July 31, 2022 inclusive of the current portion of long - term debt Adjusted EBITDA is a non - GAAP performance measure included to illustrate and improve comparability of the Company's results from period to period. Adjusted EBITDA is defined as net income before net interest expense, income tax expense and depreciation and amortization adjusted for certain items and other one - time items. The Company considers this non - GAAP measure in evaluating and managing the Company's operations and believes that discussion of results adjusted for these items is meaningful to investors because it provides a useful analysis of ongoing underlying operating trends. The adjusted measures are not in accordance with, nor are they a substitute for, GAAP measures, and they may not be comparable to similarly titled measures used by other companies. 1.0 x 0.9 x

www.thorindustries.com INVESTOR RELATIONS CONTACT Michael Cieslak, CFA mcieslak@thorindustries.com (574) 294 - 7724