
Patterson-UTI Energy, Inc. Barclays CEO Energy-Power Conference September 6-7, 2022
Forward Looking Statements This material and any oral statements made in connection with this material include "forward-looking statements" within the meaning of the Securities Act of 1933 and the Securities Exchange Act of 1934. Statements made which provide the Company’s or management’s intentions, beliefs, expectations or predictions for the future are forward-looking statements and are inherently uncertain. The opinions, forecasts, projections or other statements other than statements of historical fact, including, without limitation, plans and objectives of management of the Company are forward-looking statements. It is important to note that actual results could differ materially from those discussed in such forward-looking statements. Important factors that could cause actual results to differ materially include the risk factors and other cautionary statements contained from time to time in the Company’s SEC filings, which may be obtained by contacting the Company or the SEC. These filings are also available through the Company’s web site at http://www.patenergy.com or through the SEC’s Electronic Data Gathering and Analysis Retrieval System (EDGAR) at http://www.sec.gov. We undertake no obligation to publicly update or revise any forward-looking statement. Statements made in this presentation include non-U.S. GAAP financial measures. The required reconciliations to U.S. GAAP financial measures are included on our website and/or at the end of this presentation.
Market Update Market fundamentals are strong as demand is increasing and industry supply is constrained Strong demand for drilling and pressure pumping equipment and services Customers indicating demand for more rigs than PTEN can provide this year Recent oil price volatility has not had an impact on customer conversations Leading edge rig dayrates and frac stage pricing continue to improve Term contracts increasing backlog of future drilling revenue Contracts signed since July 1, 2022 have added approximately $335 million of drilling revenue backlog… …including contracts with a major operator for five rigs under three-year contract terms Approximately $690 million of future dayrate drilling revenue from U.S. term contracts as of August 31, 2022 We believe strong market demand for pressure pumping will allow us to continue to improve pricing We continue to operate 12 frac spreads We have reached agreements with a number of customers during the third quarter for better pricing
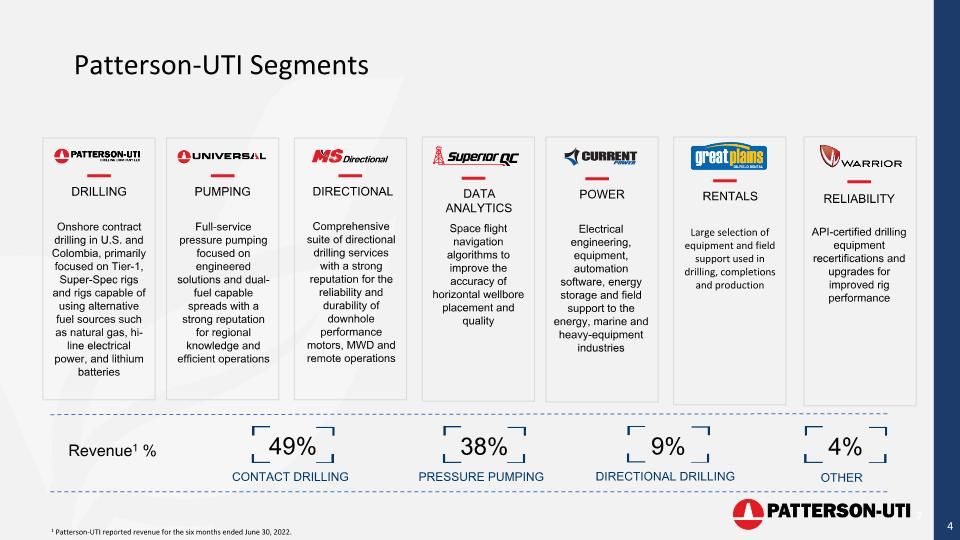
Patterson-UTI Segments 2 DRILLING PUMPING Onshore contract drilling in U.S. and Colombia, primarily focused on Tier-1, Super-Spec rigs and rigs capable of using alternative fuel sources such as natural gas, hi-line electrical power, and lithium batteries Full-service pressure pumping focused on engineered solutions and dual-fuel capable spreads with a strong reputation for regional knowledge and efficient operations DIRECTIONAL Comprehensive suite of directional drilling services with a strong reputation for the reliability and durability of downhole performance motors, MWD and remote operations RELIABILITY API-certified drilling equipment recertifications and upgrades for improved rig performance Large selection of equipment and field support used in drilling, completions and production RENTALS DATA ANALYTICS Space flight navigation algorithms to improve the accuracy of horizontal wellbore placement and quality POWER Electrical engineering, equipment, automation software, energy storage and field support to the energy, marine and heavy-equipment industries Revenue1 % 38% PRESSURE PUMPING 49% CONTACT DRILLING 4% 9% DIRECTIONAL DRILLING 1 Patterson-UTI reported revenue for the six months ended June 30, 2022. OTHER
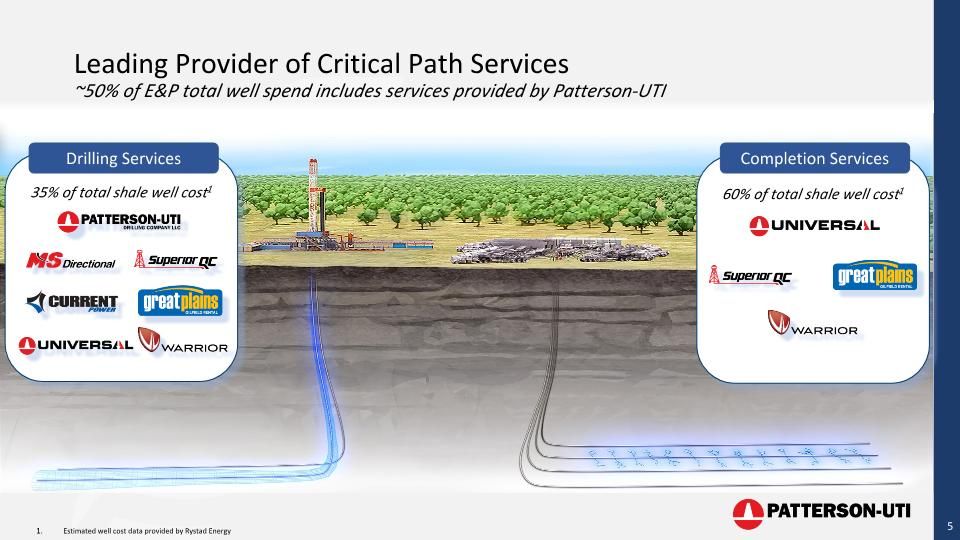
35% of total shale well cost1 Drilling Services 60% of total shale well cost1 Completion Services Estimated well cost data provided by Rystad Energy Leading Provider of Critical Path Services ~50% of E&P total well spend includes services provided by Patterson-UTI
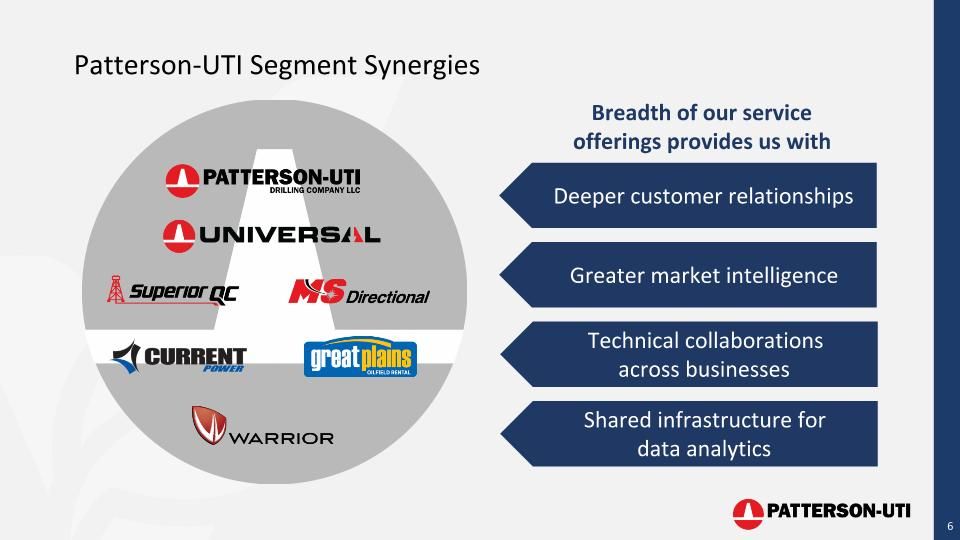
Patterson-UTI Segment Synergies Deeper customer relationships Breadth of our service offerings provides us with Greater market intelligence Technical collaborations across businesses Shared infrastructure for data analytics
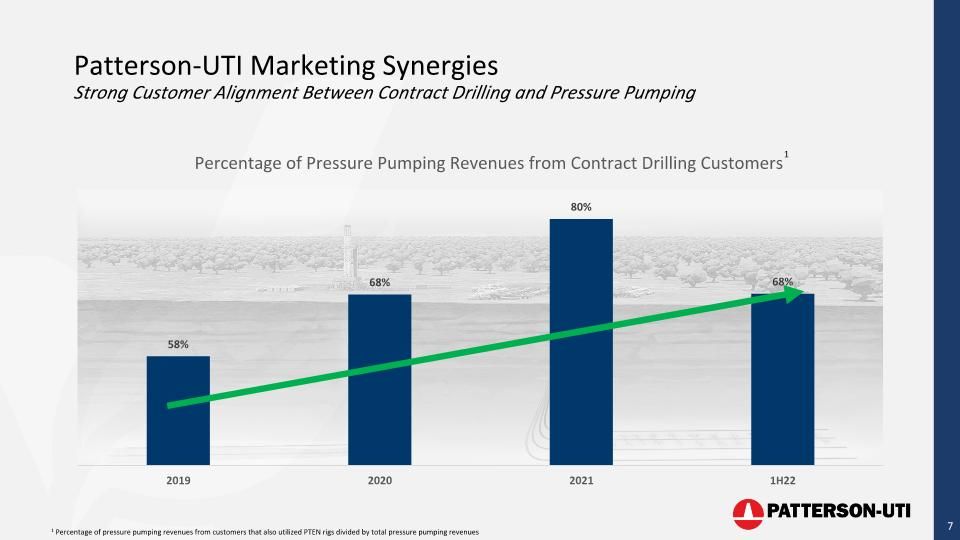
Patterson-UTI Marketing Synergies Strong Customer Alignment Between Contract Drilling and Pressure Pumping 1 Percentage of pressure pumping revenues from customers that also utilized PTEN rigs divided by total pressure pumping revenues 1
Contract Drilling
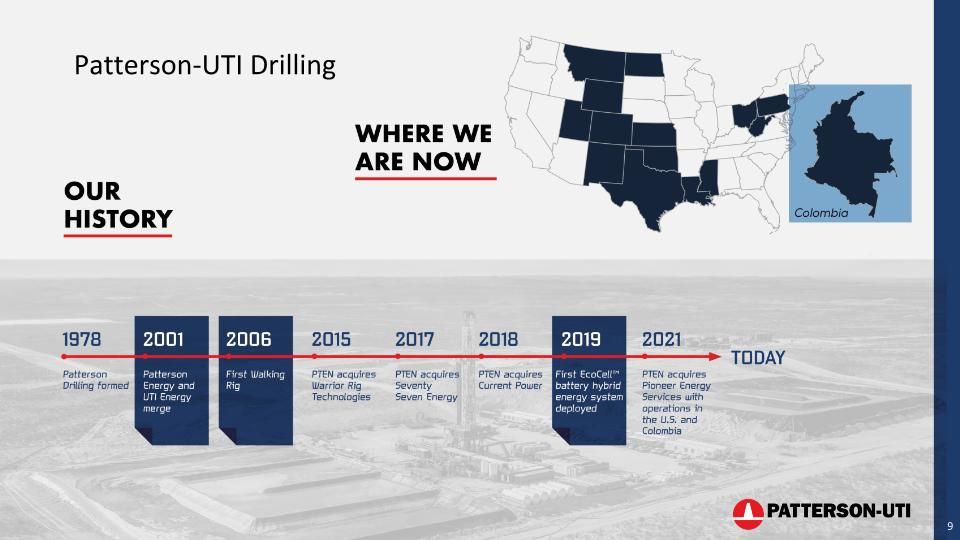
Patterson-UTI Drilling
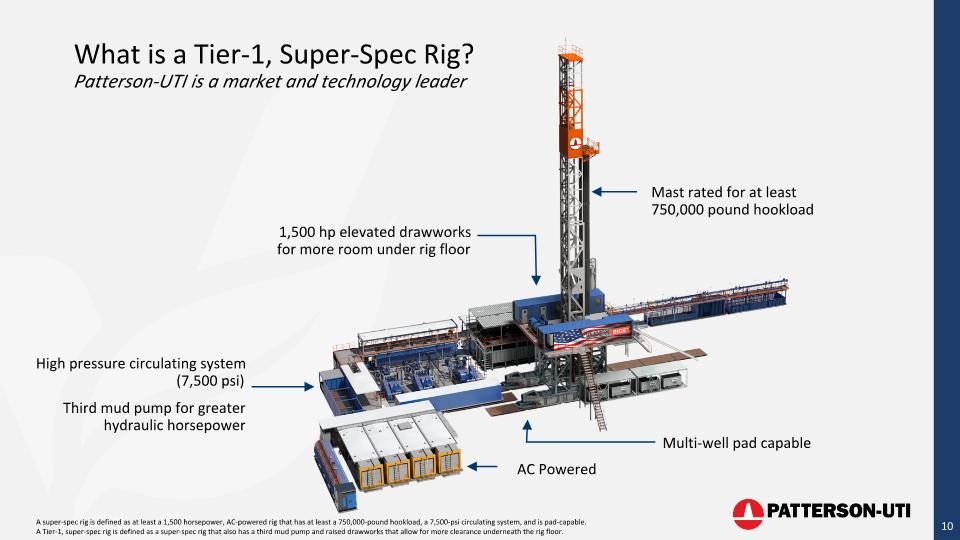
What is a Tier-1, Super-Spec Rig? Patterson-UTI is a market and technology leader 1,500 hp elevated drawworks for more room under rig floor Mast rated for at least 750,000 pound hookload High pressure circulating system (7,500 psi) Third mud pump for greater hydraulic horsepower Multi-well pad capable AC Powered A super-spec rig is defined as at least a 1,500 horsepower, AC-powered rig that has at least a 750,000-pound hookload, a 7,500-psi circulating system, and is pad-capable. A Tier-1, super-spec rig is defined as a super-spec rig that also has a third mud pump and raised drawworks that allow for more clearance underneath the rig floor.
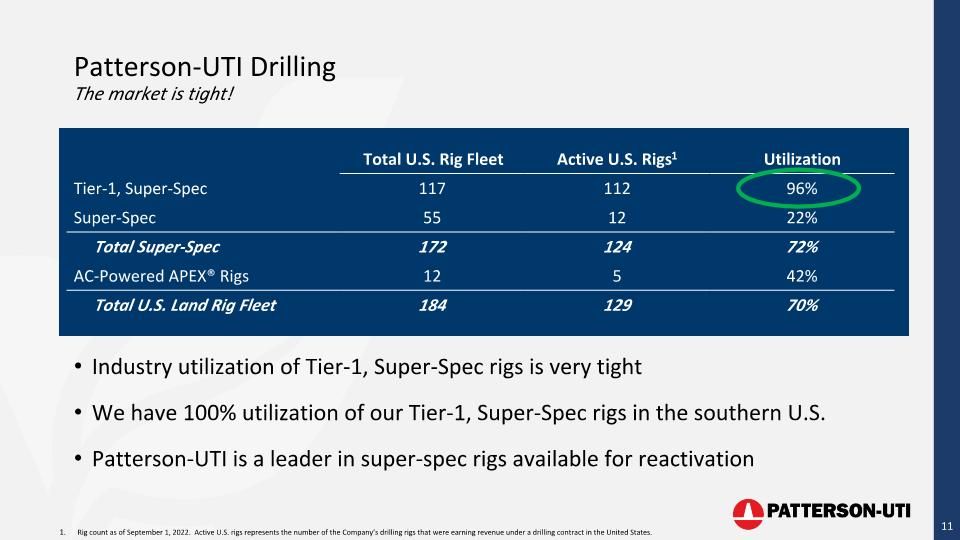
Rig count as of September 1, 2022. Active U.S. rigs represents the number of the Company’s drilling rigs that were earning revenue under a drilling contract in the United States. Total U.S. Rig Fleet Active U.S. Rigs1 Utilization Tier-1, Super-Spec 117 112 96% Super-Spec 55 12 22% Total Super-Spec 172 124 72% AC-Powered APEX® Rigs 12 5 42% Total U.S. Land Rig Fleet 184 129 70% Patterson-UTI Drilling The market is tight! Industry utilization of Tier-1, Super-Spec rigs is very tight We have 100% utilization of our Tier-1, Super-Spec rigs in the southern U.S. Patterson-UTI is a leader in super-spec rigs available for reactivation
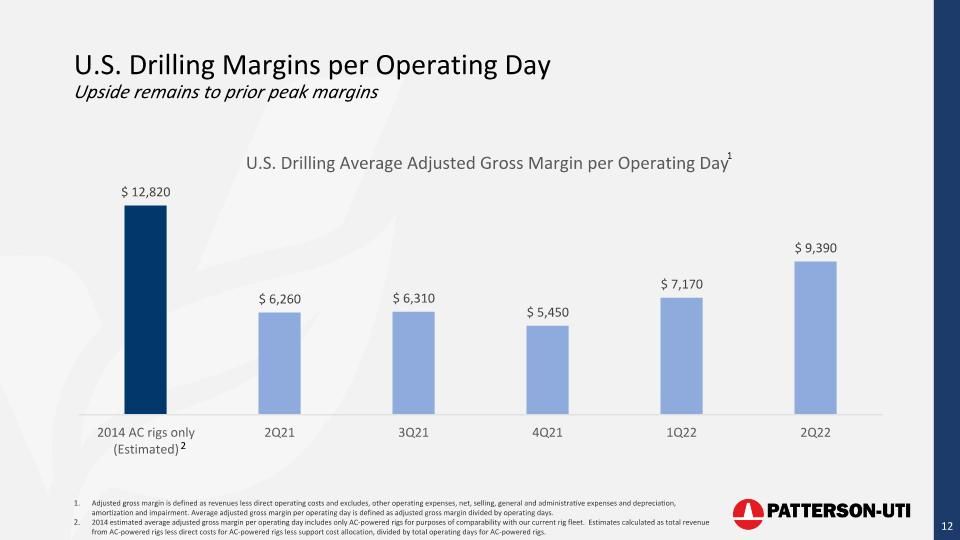
U.S. Drilling Margins per Operating Day Upside remains to prior peak margins Adjusted gross margin is defined as revenues less direct operating costs and excludes, other operating expenses, net, selling, general and administrative expenses and depreciation, amortization and impairment. Average adjusted gross margin per operating day is defined as adjusted gross margin divided by operating days. 2014 estimated average adjusted gross margin per operating day includes only AC-powered rigs for purposes of comparability with our current rig fleet. Estimates calculated as total revenue from AC-powered rigs less direct costs for AC-powered rigs less support cost allocation, divided by total operating days for AC-powered rigs. 2 1

Pressure Pumping
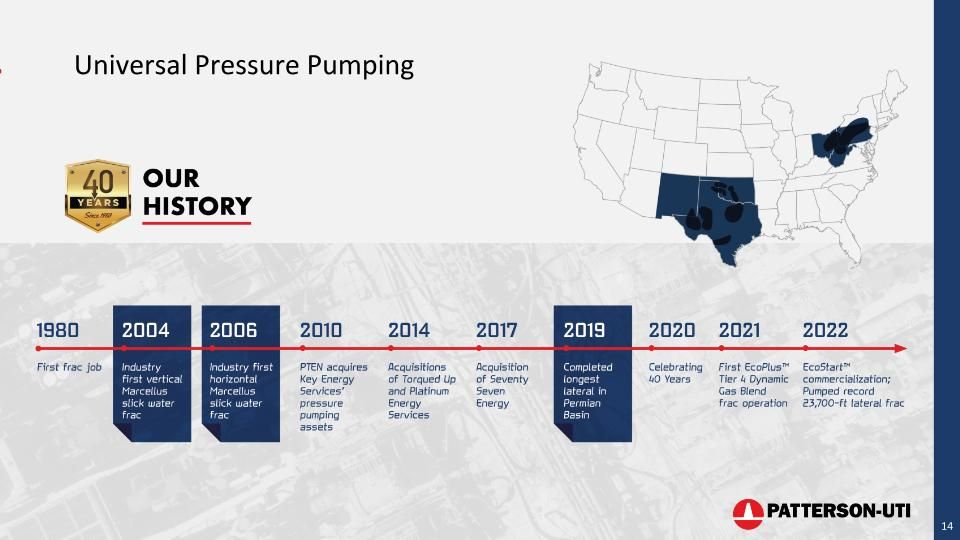
Universal Pressure Pumping
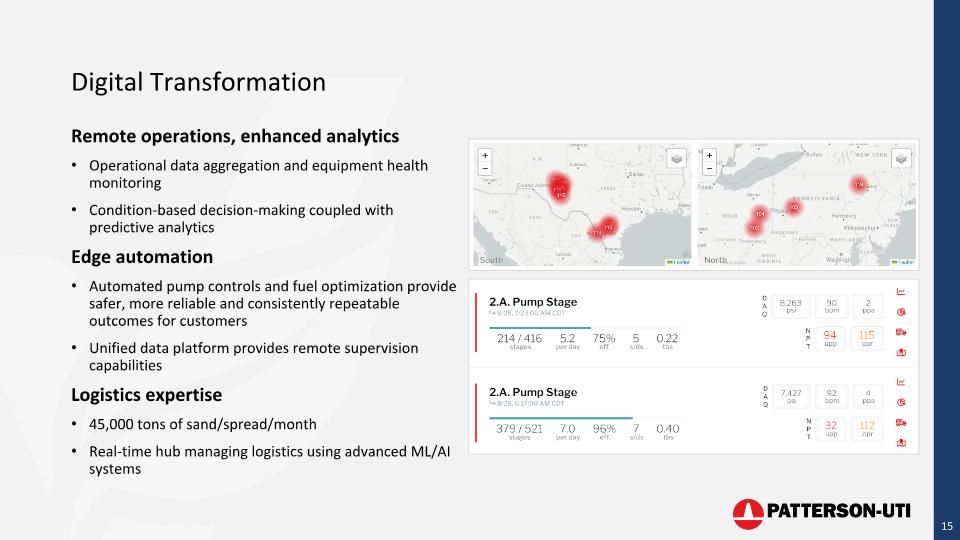
Digital Transformation Remote operations, enhanced analytics Operational data aggregation and equipment health monitoring Condition-based decision-making coupled with predictive analytics Edge automation Automated pump controls and fuel optimization provide safer, more reliable and consistently repeatable outcomes for customers Unified data platform provides remote supervision capabilities Logistics expertise 45,000 tons of sand/spread/month Real-time hub managing logistics using advanced ML/AI systems
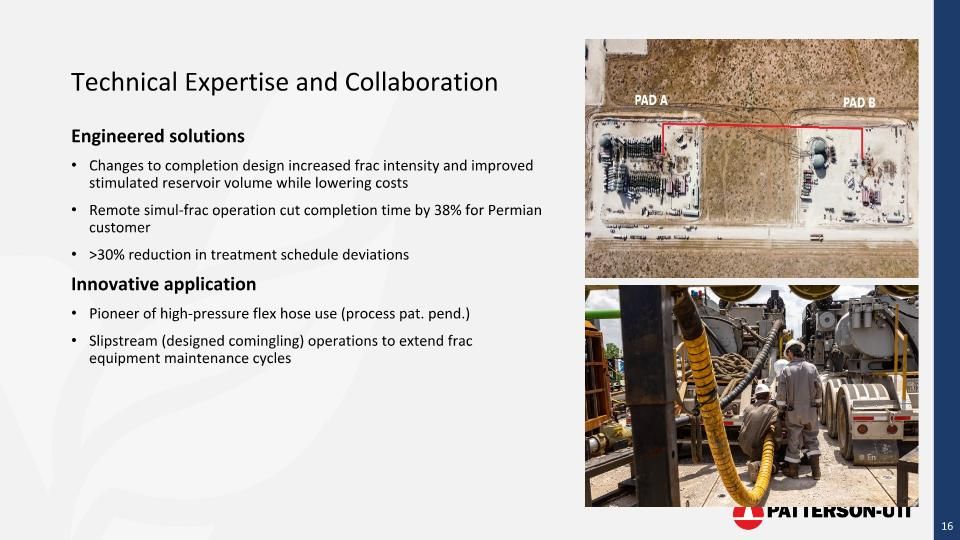
Technical Expertise and Collaboration Engineered solutions Changes to completion design increased frac intensity and improved stimulated reservoir volume while lowering costs Remote simul-frac operation cut completion time by 38% for Permian customer >30% reduction in treatment schedule deviations Innovative application Pioneer of high-pressure flex hose use (process pat. pend.) Slipstream (designed comingling) operations to extend frac equipment maintenance cycles
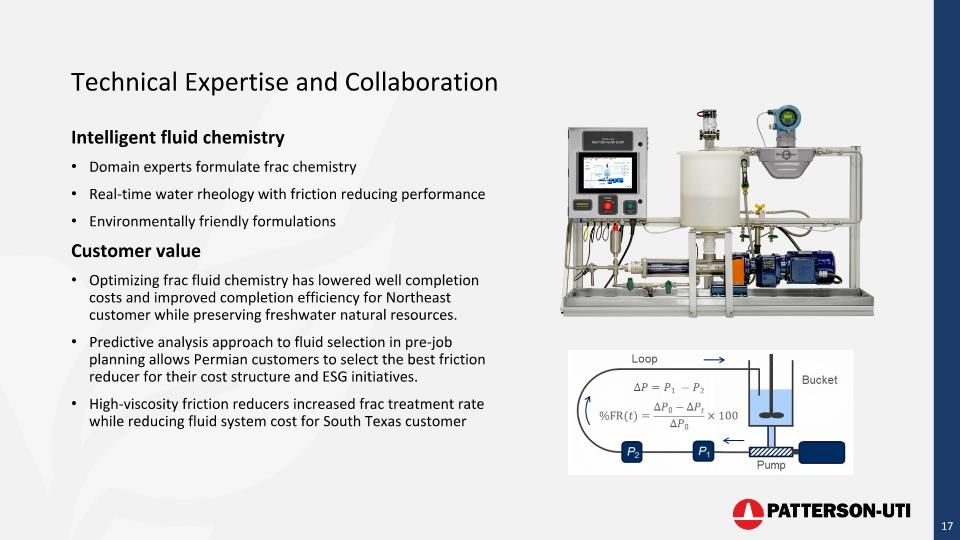
Technical Expertise and Collaboration Intelligent fluid chemistry Domain experts formulate frac chemistry Real-time water rheology with friction reducing performance Environmentally friendly formulations Customer value Optimizing frac fluid chemistry has lowered well completion costs and improved completion efficiency for Northeast customer while preserving freshwater natural resources. Predictive analysis approach to fluid selection in pre-job planning allows Permian customers to select the best friction reducer for their cost structure and ESG initiatives. High-viscosity friction reducers increased frac treatment rate while reducing fluid system cost for South Texas customer
Directional Drilling and Data Analytics
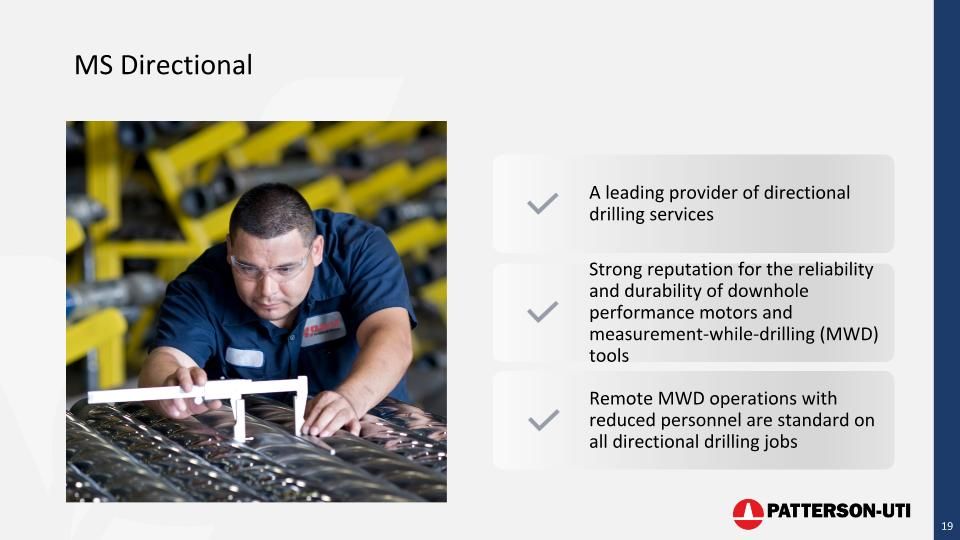
MS Directional A leading provider of directional drilling services Strong reputation for the reliability and durability of downhole performance motors and measurement-while-drilling (MWD) tools Remote MWD operations with reduced personnel are standard on all directional drilling jobs
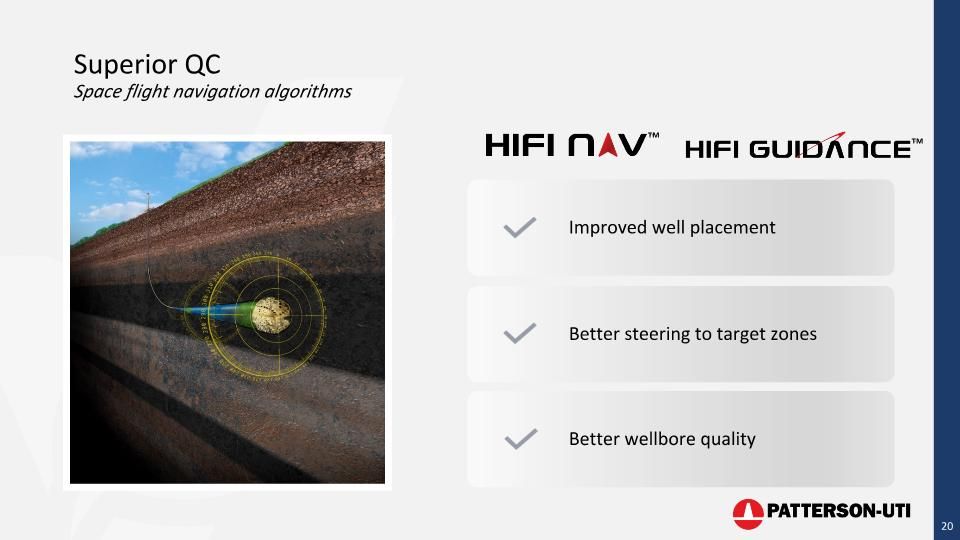
Superior QC Space flight navigation algorithms Improved well placement Better steering to target zones Better wellbore quality ™ ™
EcoVerse™
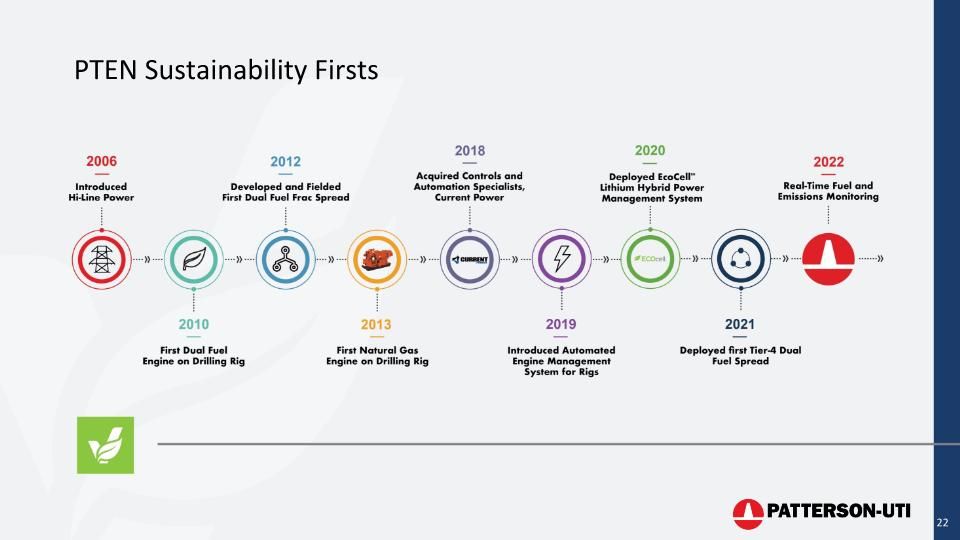
PTEN Sustainability Firsts 22
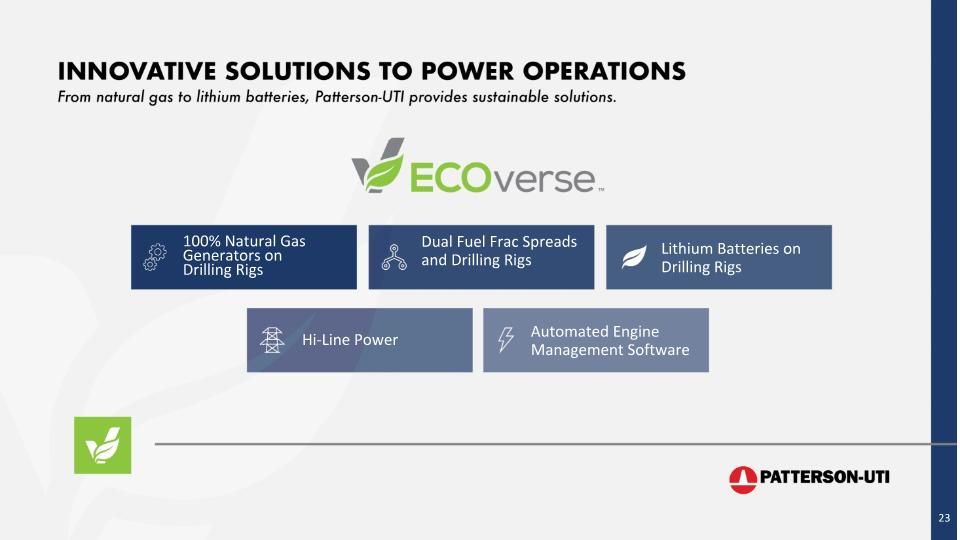
100% Natural Gas Generators on Drilling Rigs Dual Fuel Frac Spreads and Drilling Rigs Lithium Batteries on Drilling Rigs Hi-Line Power Automated Engine Management Software

Natural Gas Powered Engines on Drilling Rigs Offering fuel flexibility and utilizing local infrastructure Able to utilize local natural gas infrastructure already available thereby reducing the need for diesel fuel transportation and consumption Cleaner burning natural gas helps to reduce emissions PTEN is a leader in rigs capable of using natural gas as a fuel source Substituting natural gas for higher-priced diesel helps to reduce fuel costs
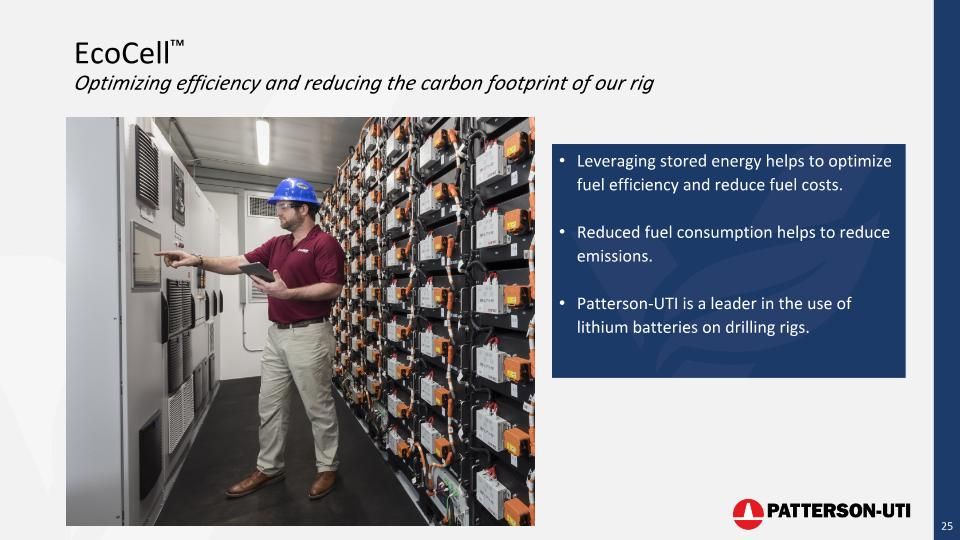
EcoCell™ Optimizing efficiency and reducing the carbon footprint of our rig Leveraging stored energy helps to optimize fuel efficiency and reduce fuel costs. Reduced fuel consumption helps to reduce emissions. Patterson-UTI is a leader in the use of lithium batteries on drilling rigs.
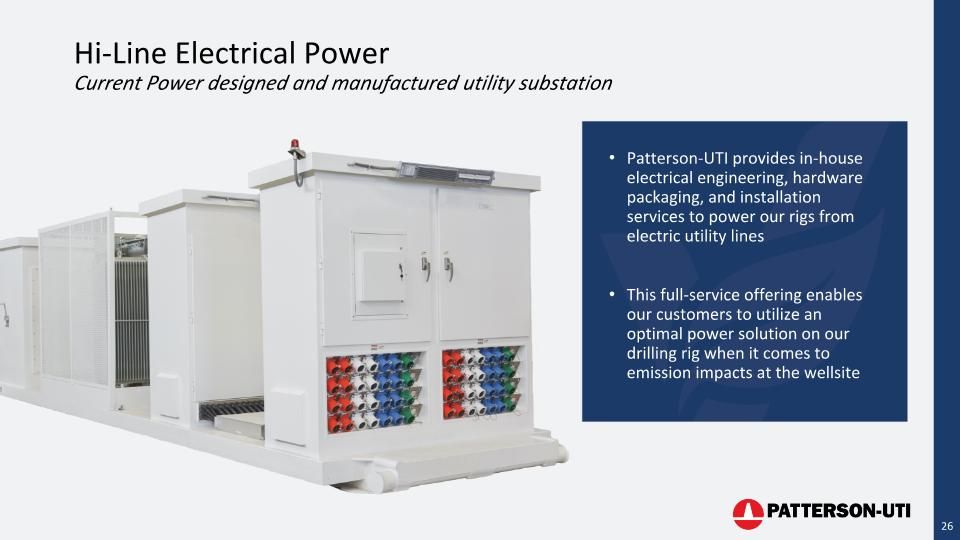
Patterson-UTI provides in-house electrical engineering, hardware packaging, and installation services to power our rigs from electric utility lines This full-service offering enables our customers to utilize an optimal power solution on our drilling rig when it comes to emission impacts at the wellsite Hi-Line Electrical Power Current Power designed and manufactured utility substation
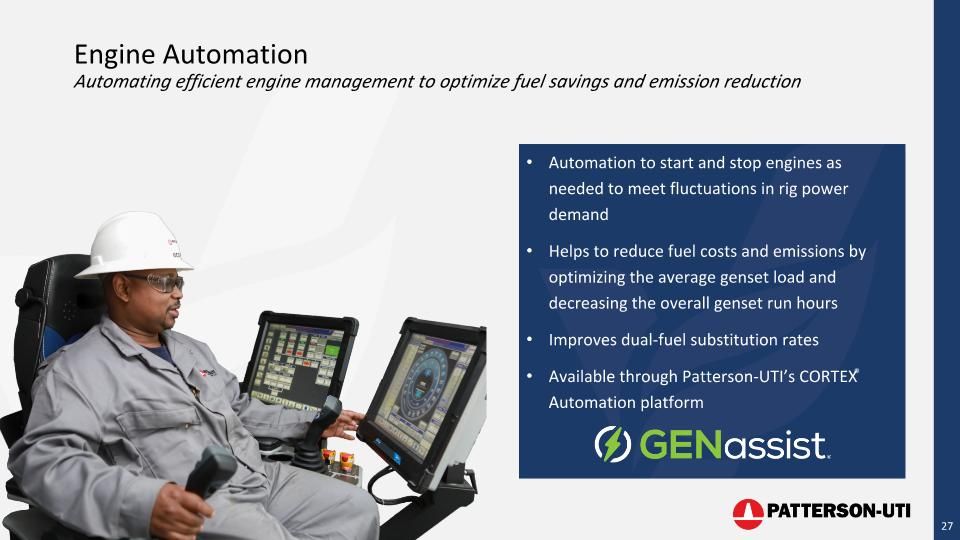
Engine Automation Automating efficient engine management to optimize fuel savings and emission reduction Automation to start and stop engines as needed to meet fluctuations in rig power demand Helps to reduce fuel costs and emissions by optimizing the average genset load and decreasing the overall genset run hours Improves dual-fuel substitution rates Available through Patterson-UTI’s CORTEX® Automation platform
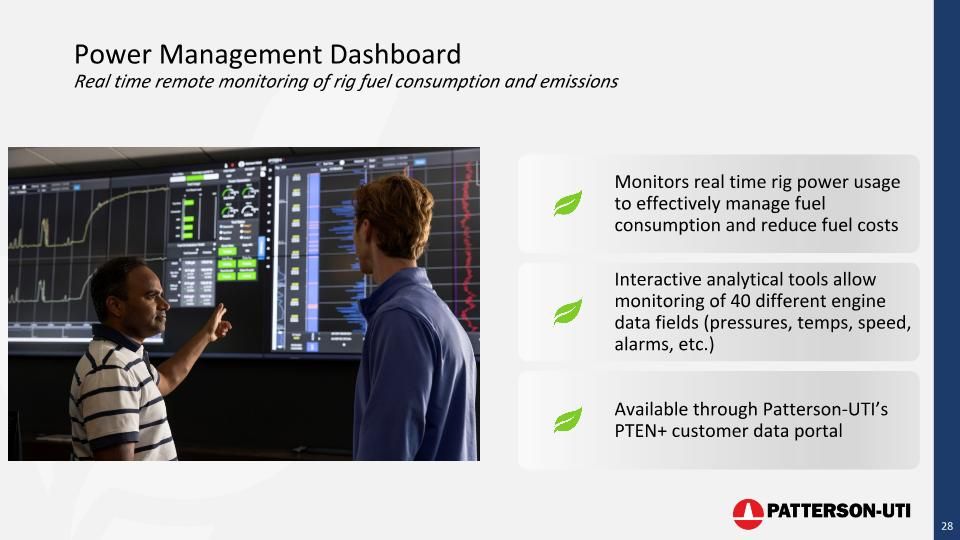
Power Management Dashboard Real time remote monitoring of rig fuel consumption and emissions Monitors real time rig power usage to effectively manage fuel consumption and reduce fuel costs Interactive analytical tools allow monitoring of 40 different engine data fields (pressures, temps, speed, alarms, etc.) Available through Patterson-UTI’s PTEN+ customer data portal
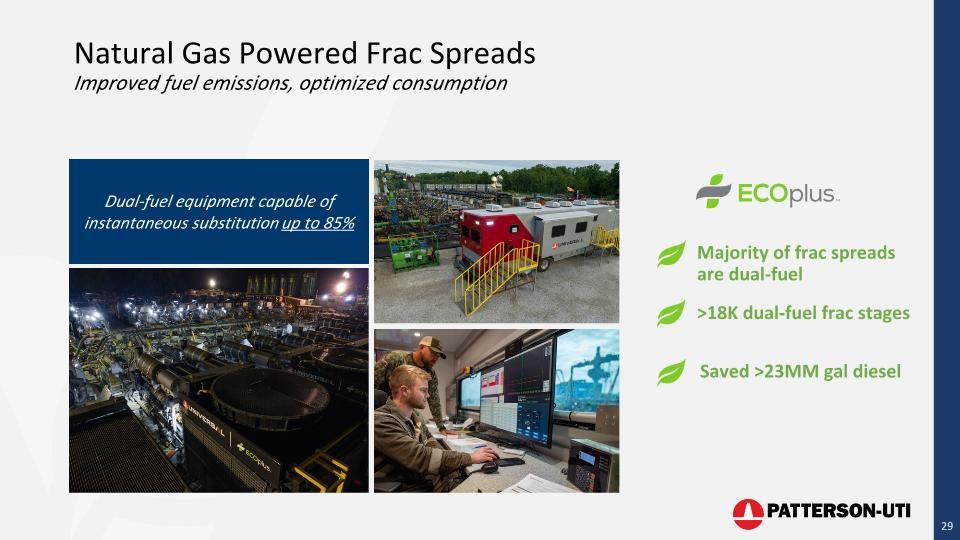
Dual-fuel equipment capable of instantaneous substitution up to 85% Natural Gas Powered Frac Spreads Improved fuel emissions, optimized consumption Majority of frac spreads are dual-fuel Saved >23MM gal diesel >18K dual-fuel frac stages

Financials
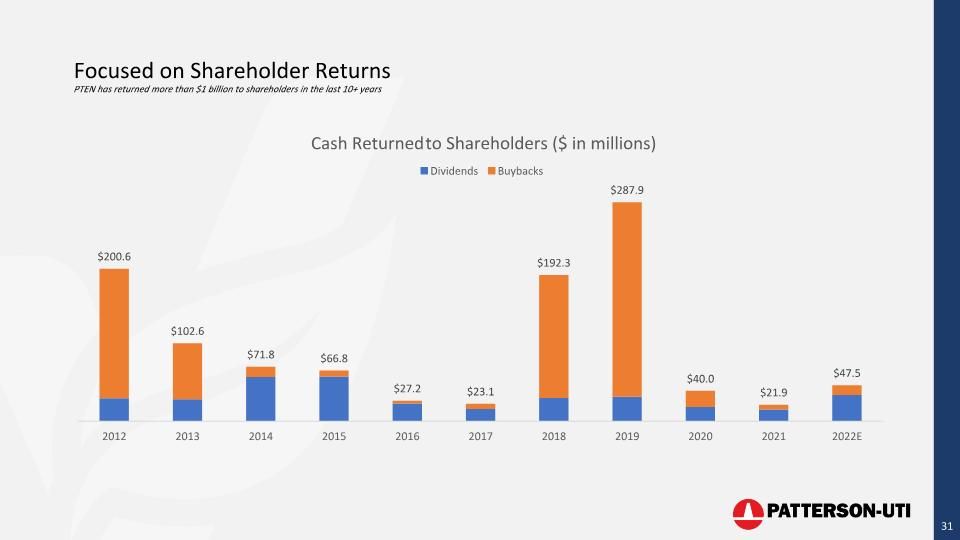
Focused on Shareholder Returns PTEN has returned more than $1 billion to shareholders in the last 10+ years
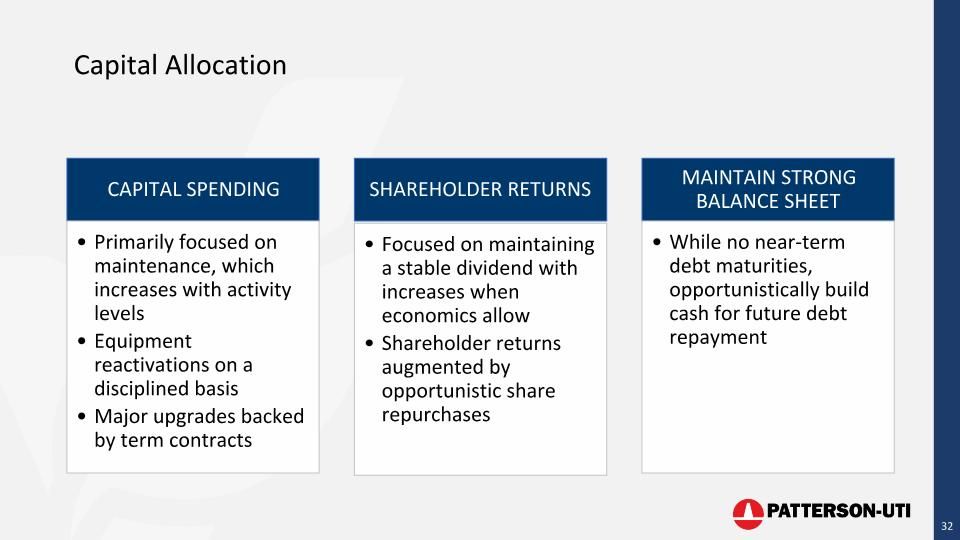
Capital Allocation CAPITAL SPENDING Primarily focused on maintenance, which increases with activity levels Equipment reactivations on a disciplined basis Major upgrades backed by term contracts SHAREHOLDER RETURNS Focused on maintaining a stable dividend with increases when economics allow Shareholder returns augmented by opportunistic share repurchases MAINTAIN STRONG BALANCE SHEET While no near-term debt maturities, opportunistically build cash for future debt repayment
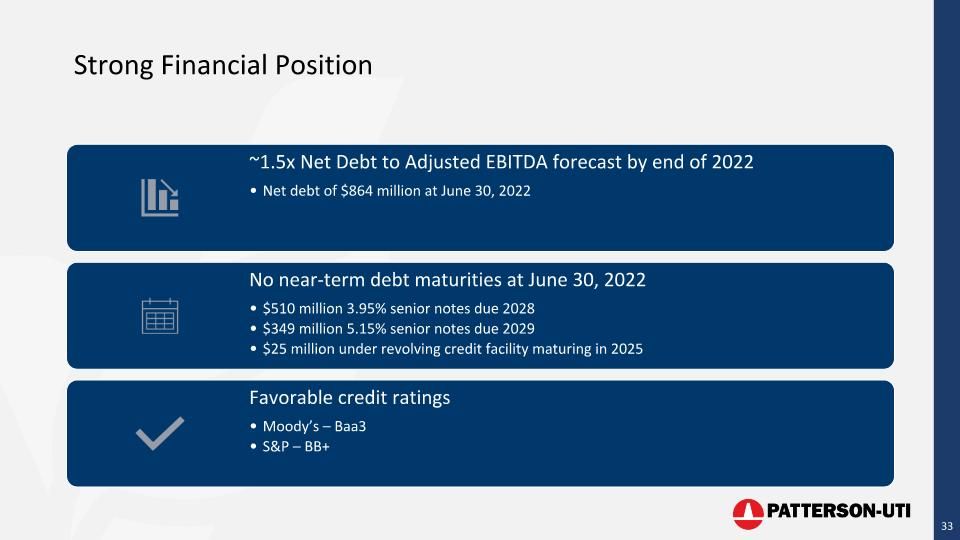
Strong Financial Position ~1.5x Net Debt to Adjusted EBITDA forecast by end of 2022 Net debt of $864 million at June 30, 2022 No near-term debt maturities at June 30, 2022 $510 million 3.95% senior notes due 2028 $349 million 5.15% senior notes due 2029 $25 million under revolving credit facility maturing in 2025 Favorable credit ratings Moody’s – Baa3 S&P – BB+
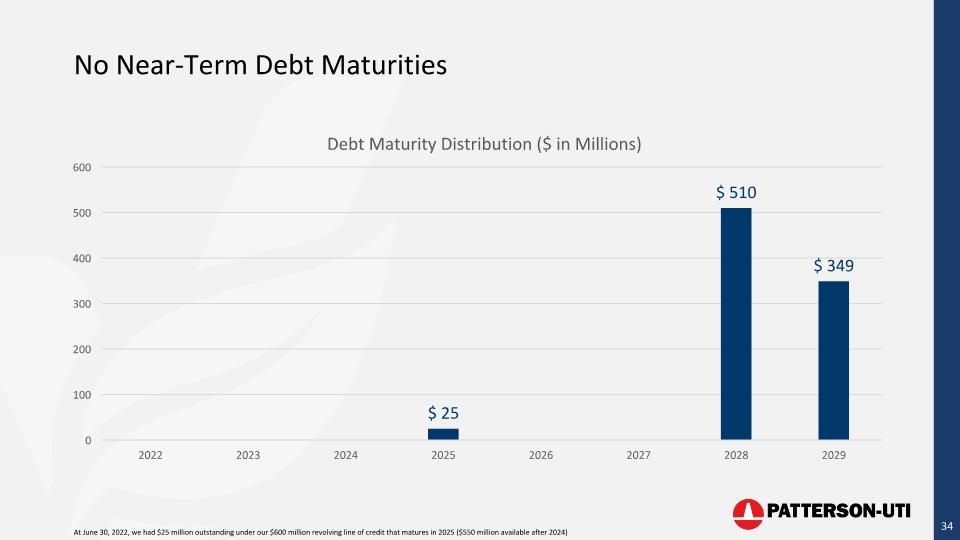
No Near-Term Debt Maturities At June 30, 2022, we had $25 million outstanding under our $600 million revolving line of credit that matures in 2025 ($550 million available after 2024)

Environmental & Social Sustainability
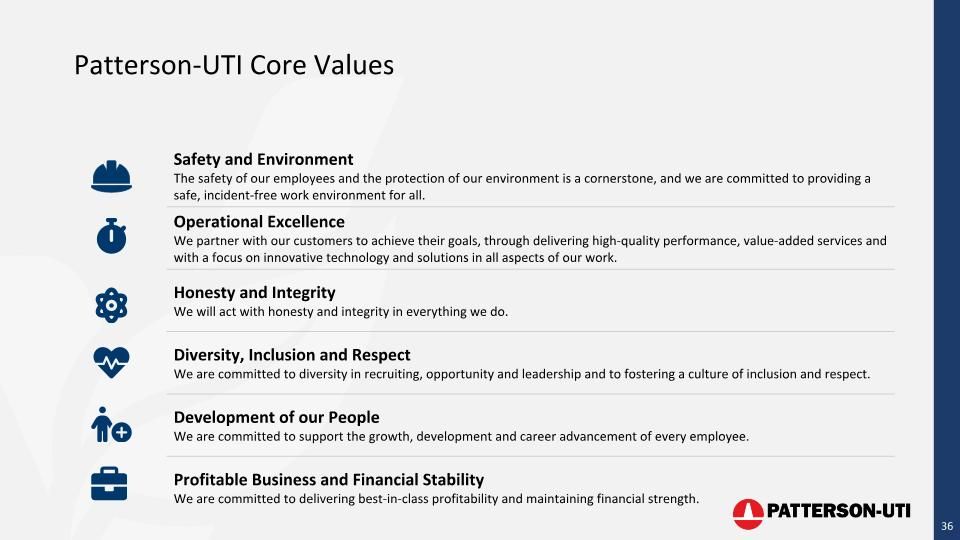
Patterson-UTI Core Values Safety and Environment The safety of our employees and the protection of our environment is a cornerstone, and we are committed to providing a safe, incident-free work environment for all. Operational Excellence We partner with our customers to achieve their goals, through delivering high-quality performance, value-added services and with a focus on innovative technology and solutions in all aspects of our work. Honesty and Integrity We will act with honesty and integrity in everything we do. Diversity, Inclusion and Respect We are committed to diversity in recruiting, opportunity and leadership and to fostering a culture of inclusion and respect. Development of our People We are committed to support the growth, development and career advancement of every employee. Profitable Business and Financial Stability We are committed to delivering best-in-class profitability and maintaining financial strength.
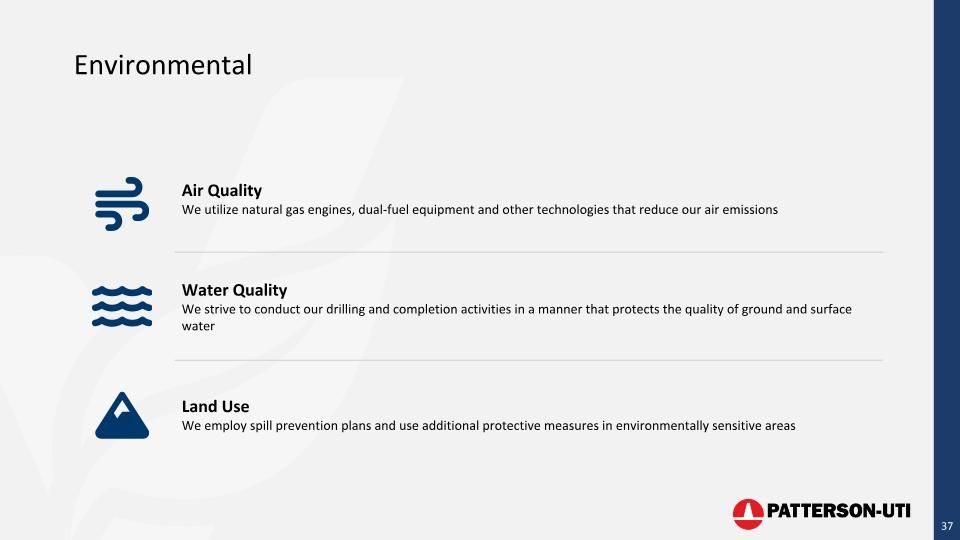
Environmental Air Quality We utilize natural gas engines, dual-fuel equipment and other technologies that reduce our air emissions Water Quality We strive to conduct our drilling and completion activities in a manner that protects the quality of ground and surface water Land Use We employ spill prevention plans and use additional protective measures in environmentally sensitive areas
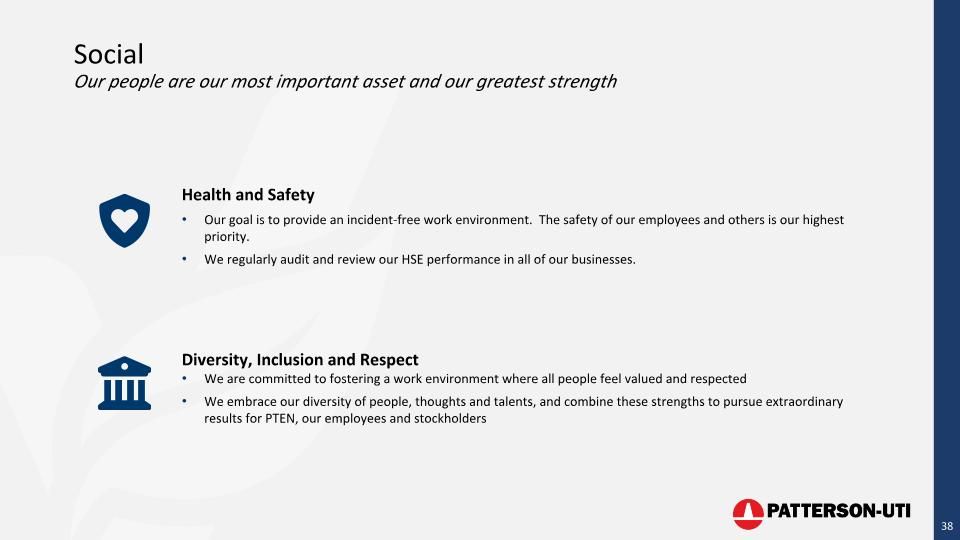
Social Our people are our most important asset and our greatest strength Health and Safety Our goal is to provide an incident-free work environment. The safety of our employees and others is our highest priority. We regularly audit and review our HSE performance in all of our businesses. Diversity, Inclusion and Respect We are committed to fostering a work environment where all people feel valued and respected We embrace our diversity of people, thoughts and talents, and combine these strengths to pursue extraordinary results for PTEN, our employees and stockholders

Appendix
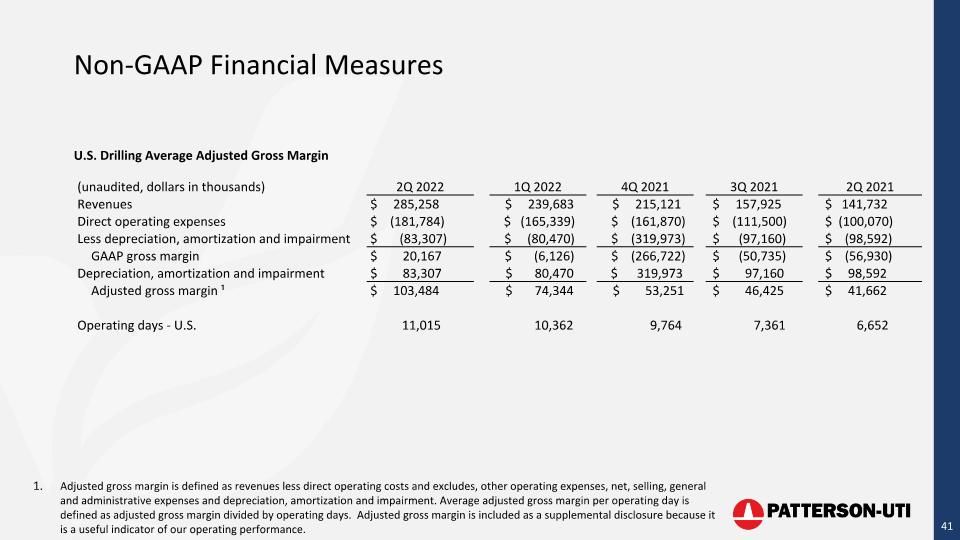
Non-GAAP Financial Measures U.S. Drilling Average Adjusted Gross Margin Adjusted gross margin is defined as revenues less direct operating costs and excludes, other operating expenses, net, selling, general and administrative expenses and depreciation, amortization and impairment. Average adjusted gross margin per operating day is defined as adjusted gross margin divided by operating days. Adjusted gross margin is included as a supplemental disclosure because it is a useful indicator of our operating performance. (unaudited, dollars in thousands) 2Q 2022 1Q 2022 4Q 2021 3Q 2021 2Q 2021 Revenues $ 285,258 $ 239,683 $ 215,121 $ 157,925 $ 141,732 Direct operating expenses $ (181,784) $ (165,339) $ (161,870) $ (111,500) $ (100,070) Less depreciation, amortization and impairment $ (83,307) $ (80,470) $ (319,973) $ (97,160) $ (98,592) GAAP gross margin $ 20,167 $ (6,126) $ (266,722) $ (50,735) $ (56,930) Depreciation, amortization and impairment $ 83,307 $ 80,470 $ 319,973 $ 97,160 $ 98,592 Adjusted gross margin ¹ $ 103,484 $ 74,344 $ 53,251 $ 46,425 $ 41,662 Operating days - U.S. 11,015 10,362 9,764 7,361 6,652