| Annual Shareholder Meeting NYSE: TCS August 31, 2022 |

| 2 ©2022 The Container Store Inc. All rights reserved. Forward - Looking Statements This presentation contains forward - looking statements within the meaning of the Private Securities Litigation Reform Act of 1995 .. All statements contained in this presentation that do not relate to matters of historical fact should be considered forward - looking statements, including statements regarding our future opportunities and expectations for our business; our goals, strategies, priorities and initiatives; market opportunities; sales trends and momentum; our share repurchase program; our an tic ipated financial performance, including long - term targets and our plans regarding Path to $2 Billion; and expected store, manufacturing facility and distribution center openings. In s ome cases, you can identify forward - looking statements by terms such as “may,” “will,” “should,” “expects,” “plans,” “anticipates,” “could,” “intends,” “target,” “projects,” “contemplates,” “b elieves,” “estimates,” “predicts,” “potential” or “continue” or the negative of these terms or other similar expressions. These statements are neither promises nor guarantees, and involve known and unknown risks, uncertainties and other important fac tors that may cause our actual results, performance or achievements to be materially different from any future results, performance or achievements expressed or implied by the forw ard - looking statements. Such risks include, but not limited to, the following: the COVID - 19 pandemic and the associated impact on our business, results of operations and financial condition; o ur ability to continue to lease space on favorable terms; costs and risks relating to new store openings; quarterly and seasonal fluctuations in our operating results; cost increases tha t are beyond our control; our inability to protect our brand; our failure or inability to protect our intellectual property rights; overall decline in the health of the economy, consumer spen din g, and the housing market; our inability to source and market new products to meet consumer preferences; failure to successfully anticipate consumer preferences and demand; competition fr om other stores and internet - based competition; vendors may sell similar or identical products to our competitors; our and our vendors’ vulnerability to natural disasters and other une xpected events; disruptions at our Elfa manufacturing facilities; deterioration or change in vendor relationships or events that adversely affect our vendors or their ability to obtain financ ing for their operations, including COVID - 19; our payment terms for goods and services, and our negotiation of alternative terms for lease payments and other business contracts, each as a resul t o f COVID - 19; product recalls and/or product liability, as well as changes in product safety and other consumer protection laws; risks relating to operating two distribution centers; our de pen dence on foreign imports for our merchandise; our reliance upon independent third party transportation providers; our inability to effectively manage our online sales; effects of a sec uri ty breach or cyber - attack of our website or information technology systems, including relating to our use of third - party web service providers; damage to, or interruptions in, our info rmation systems as a result of external factors, working from home arrangements, staffing shortages and difficulties in updating our existing software or developing or implementing new so ftw are; our indebtedness may restrict our current and future operations, and we may not be able to refinance our debt on favorable terms, or at all; fluctuations in currency exchange rat es; our inability to maintain sufficient levels of cash flow to meet growth expectations; our fixed lease obligations; disruptions in the global financial markets leading to difficulty in b orr owing sufficient amounts of capital to finance the carrying costs of inventory to pay for capital expenditures and operating costs; changes to global markets and inability to predict future i nte rest expenses; our reliance on key executive management; our inability to find, train and retain key personnel; labor relations difficulties; increases in health care costs and labor co sts; violations of the U.S. Foreign Corrupt Practices Act and similar worldwide anti - bribery and anti - kickback laws; impairment charges and effects of changes in estimates or projections used to ass ess the fair value of our assets; effects of tax reform and other tax fluctuations; significant fluctuations in the price of our common stock; substantial future sales of our common sto ck, or the perception that such sales may occur, which could depress the price of our common stock; risks related to being a public company; our performance meeting guidance provided to the public; anti - takeover provisions in our governing documents, which could delay or prevent a change in control; and our failure to establish and maintain effective internal con tro ls. These and other important factors discussed under the caption “Risk Factors” in our Annual Report on Form 10 - K filed with the Securities and Exchange Commission, (the “SEC”) on June 2, 2022, as updated from time to time in our other reports filed with the SEC could cause actual results to differ materially from those indicated by the forward - looking statements made i n this presentation. Any such forward - looking statements represent management’s estimates as of the date of this presentation. Because forward - lookin g statements are inherently subject to risks and uncertainties, you should not rely on these forward - looking statements as predictions of future events. While we may elect to up date such forward - looking statements at some point in the future, we disclaim any obligation to do so, even if subsequent events cause our views to change. These forward - looking statemen ts should not be relied upon as representing our views as of any date subsequent to the date of this presentation. |
| • Fiscal 2021 Highlights & Results • Our Path to $2 Billion • Q1 Fiscal 2022 Highlights • Q&A Agenda |

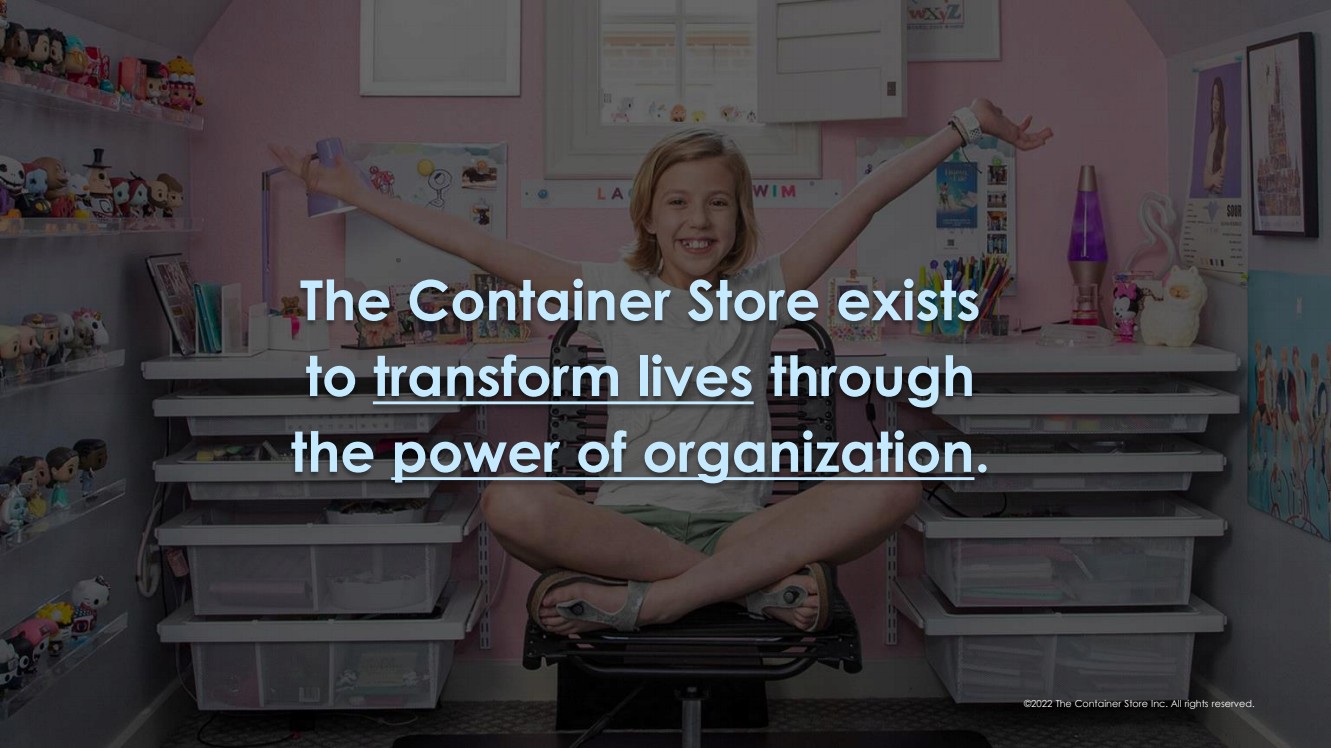
| Th e Containe r Store exists to transform lives through the power of organization .. ©2022 The Container Store Inc. All rights reserved. |
| Financial Results Fiscal 2021 |

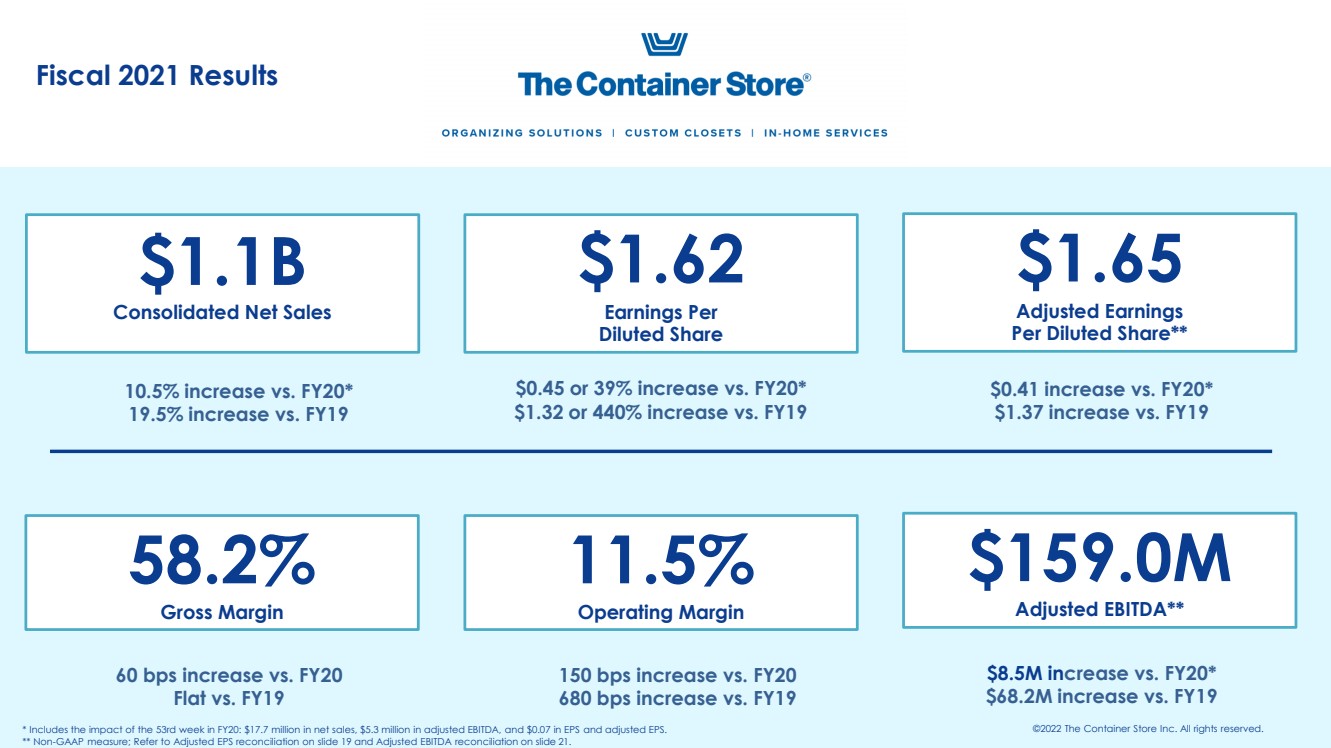
| $1.1B Consolidated Net Sales $1.65 Adjusted Earnings Per Diluted Share** $1.62 Earnings Per Diluted Share ©2022 The Container Store Inc. All rights reserved. $159.0M Adjusted EBITDA** 11.5% Operating Margin 58.2% Gross Margin 10.5% increase vs. FY20* 19.5% increase vs. FY19 $0.45 or 39% increase vs. FY20* $1.32 or 440% increase vs. FY19 $0.41 increase vs. FY20* $1.37 increase vs. FY19 60 bps increase vs. FY20 Flat vs. FY19 $8.5M in crease vs. FY20* $68.2M increase vs. FY19 150 bps increase vs. FY20 680 bps increase vs. FY19 * Includes the impact of the 53rd week in FY20: $17.7 million in net sales, $5.3 million in adjusted EBITDA, and $0.07 in EPS an d adjusted EPS. ** Non - GAAP measure; Refer to Adjusted EPS reconciliation on slide 19 and Adjusted EBITDA reconciliation on slide 21. Fiscal 2021 Results |
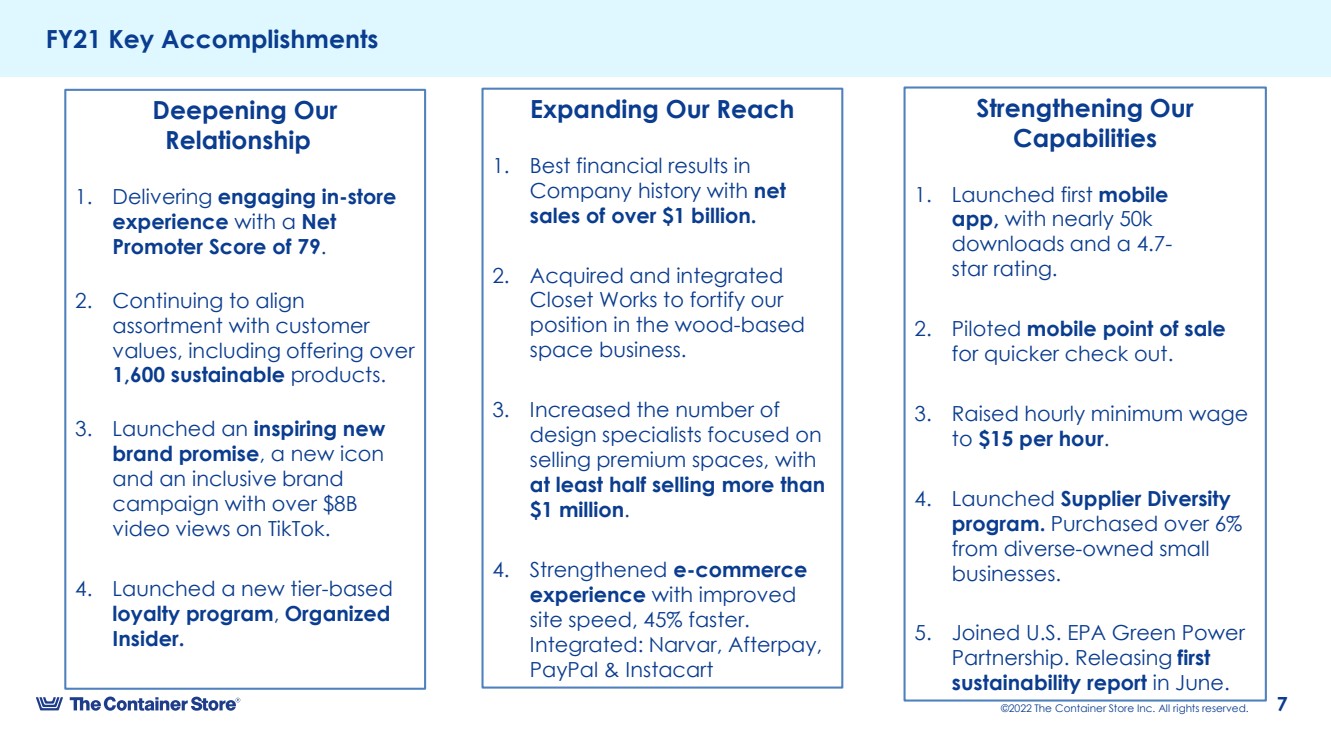
| 7 ©2022 The Container Store Inc. All rights reserved. FY21 Key Accomplishments Deepening Our Relationship 1. Delivering engaging in - store experience with a Net Promoter Score of 79 .. 2. Continuing to align assortment with customer values, including offering over 1,600 sustainable products. 3. Launched an inspiring new brand promise , a new icon and an inclusive brand campaign with over $8B video views on TikTok .. 4. Launched a new tier - based loyalty program , Organized Insider. Expanding Our Reach 1. Best financial results in Company history with net sales of over $1 billion. 2. Acquired and integrated Closet Works to fortify our position in the wood - based space business. 3. Increased the number of design specialists focused on selling premium spaces, with at least half selling more than $1 million .. 4. Strengthened e - commerce experience with improved site speed, 45% faster. Integrated: Narvar , Afterpay , PayPal & Instacart Strengthening Our Capabilities 1. Launched first mobile app, with nearly 50k downloads and a 4.7 - star rating. 2. Piloted mobile point of sale for quicker check out. 3. Raised hourly minimum wage to $15 per hour .. 4. Launched Supplier Diversity program. Purchased over 6% from diverse - owned small businesses. 5. Joined U.S. EPA Green Power Partnership. Releasing first sustainability report in June. |
| Our Path to $2 Billion A Transformation Story |
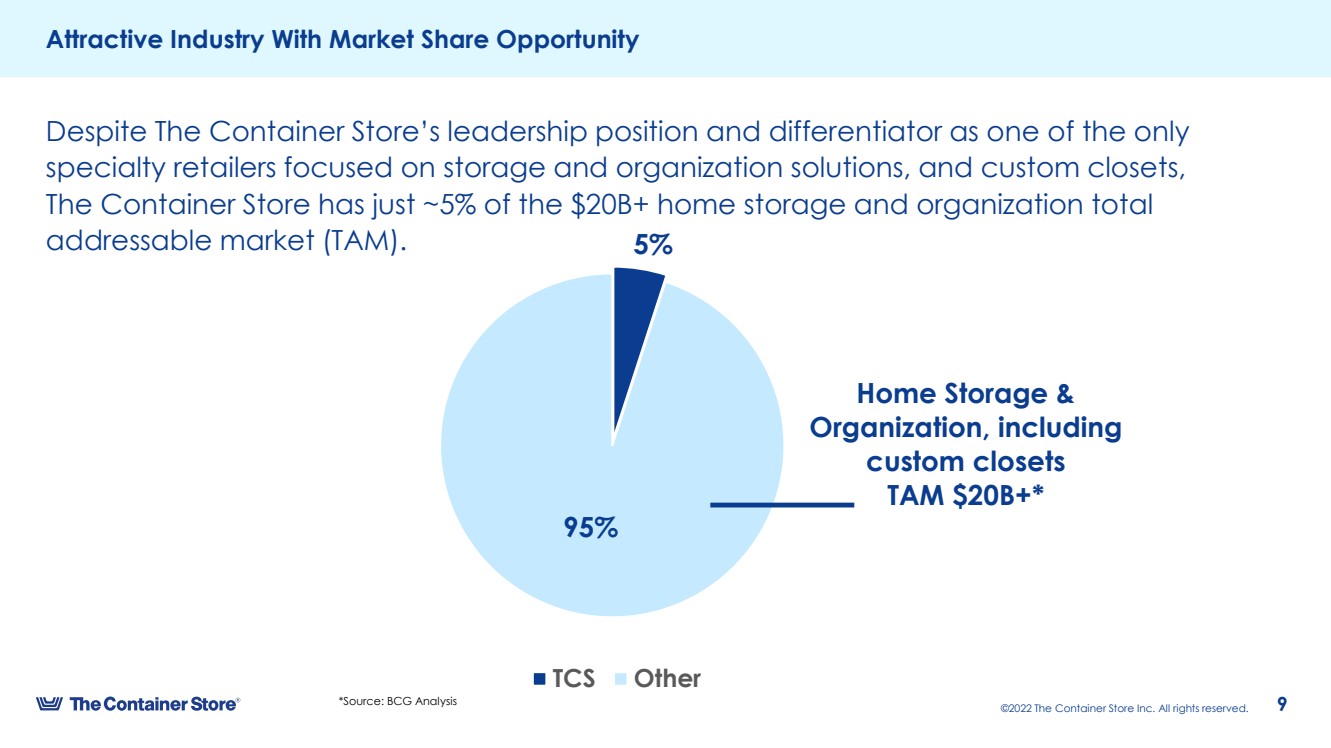
| 9 ©2022 The Container Store Inc. All rights reserved. Attractive Industry With Market Share Opportunity 5% 95% Home Storage & Organization, including custom closets TAM $20B+* TCS Other *Source: BCG Analysis Despite The Container Store’s leadership position and differentiator as one of the only specialty retailers focused on storage and organization solutions, and custom closets, The Container Store has just ~5% of the $20B+ home storage and organization total addressable market (TAM). |
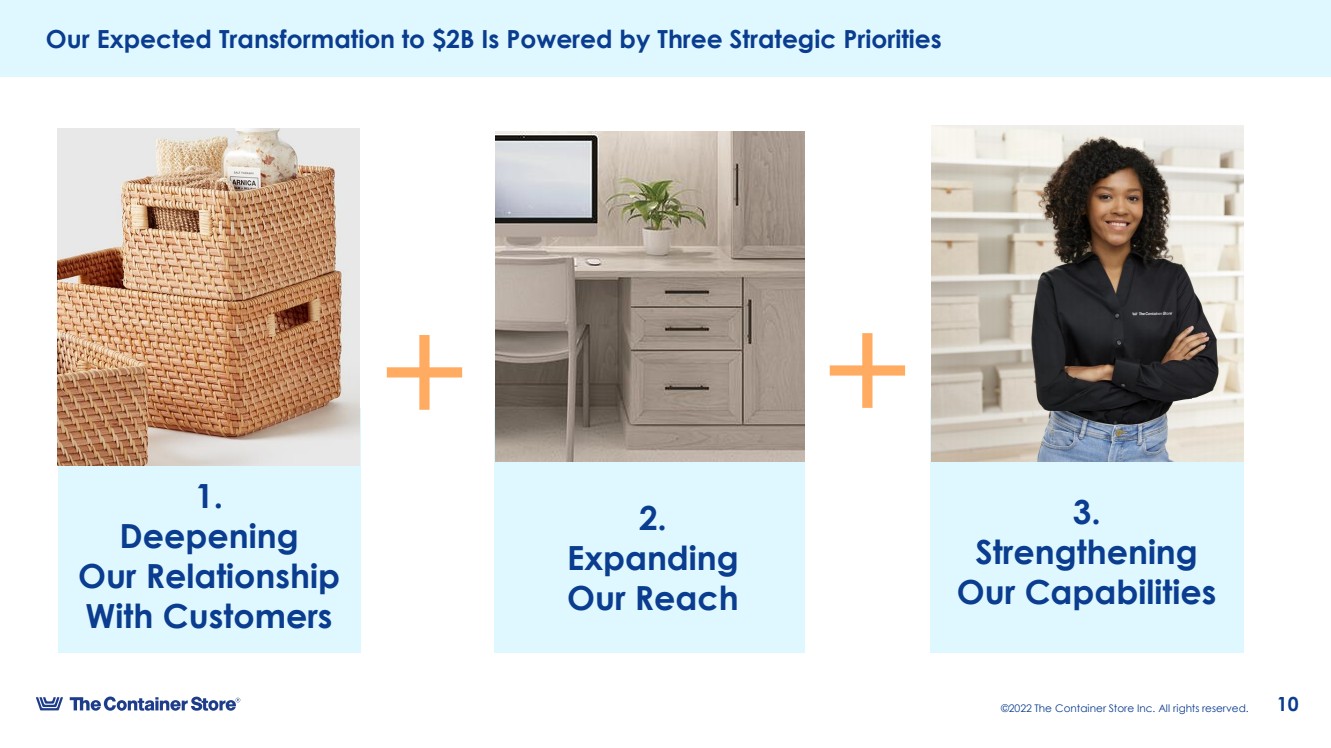
| 10 ©2022 The Container Store Inc. All rights reserved. Our Expected Transformation to $2B Is Powered by Three Strategic Priorities 3. Strengthening Our Capabilities + + 2. Expanding Our Reach 1. Deepening Our Relationship With Customers |
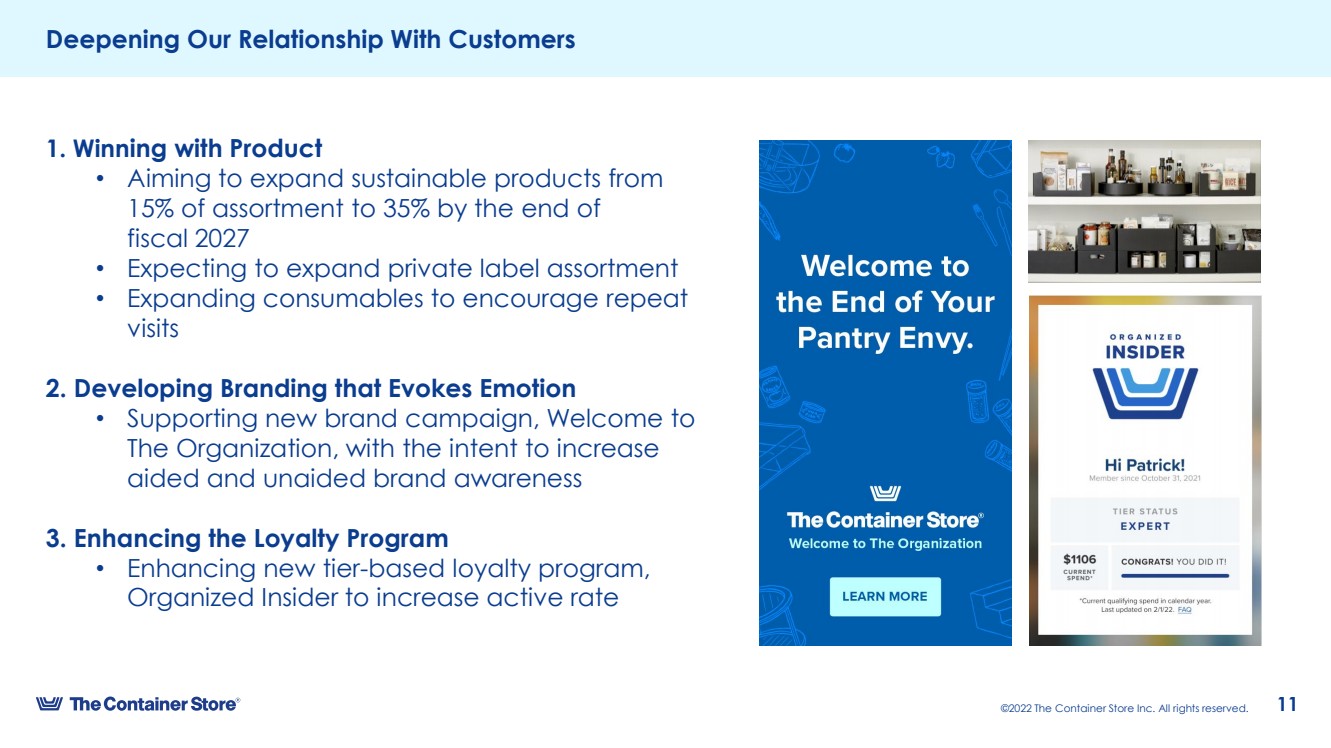
| 11 2022 The Container Store Inc. All rights reserved. Deepening Our Relationship With Customers 1. Winn ing with Product • Aiming to expand sustainable products from 15% of assortment to 35% by the end of fiscal 2027 • Expecting to expand private label assortment • Expanding consumables to encourage repeat visits 2.Developing Branding that Evokes Emotion • Supporting new brand campaign, Welcome to The Organization, with the intent to increase aided and unaided brand awareness 3.Enhancing the Loyalty Program • Enhancing new tier - based loyalty program, Organized Insider to increase active rate FPO |
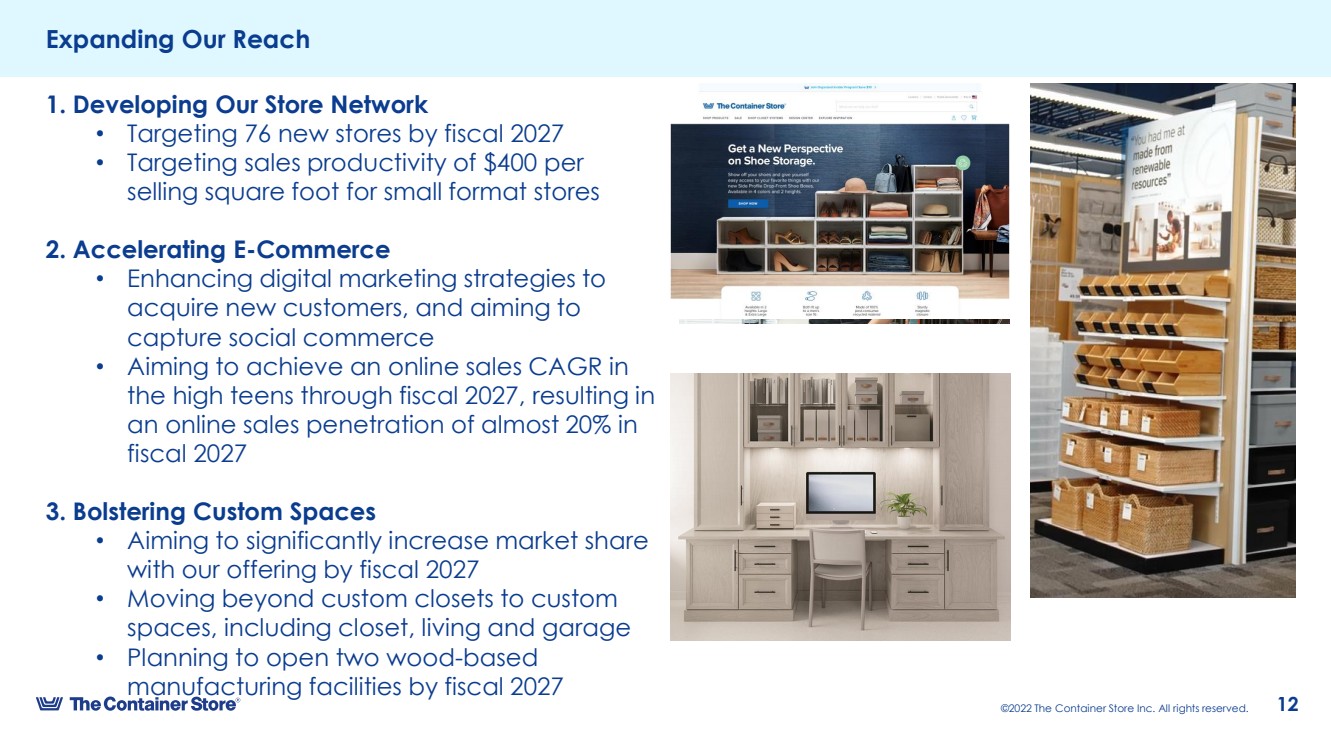
| 12 ©2022 The Container Store Inc. All rights reserved. Expanding Our Reach 1. Developing Our Store Network • Targeting 76 new stores by fiscal 2027 • Targeting sales productivity of $400 per selling square foot for small format stores 2. Accelerating E - Commerce • Enhancing digital marketing strategies to acquire new customers, and aiming to capture social commerce • Aiming to achieve an online sales CAGR in the high teens through fiscal 2027, resulting in an online sales penetration of almost 20% in fiscal 2027 3. Bolstering Custom Spaces • Aiming to significantly increase market share with our offering by fiscal 2027 • Moving beyond custom closets to custom spaces, including closet, living and garage • Planning to open two wood - based manufacturing facilities by fiscal 2027 FPO |
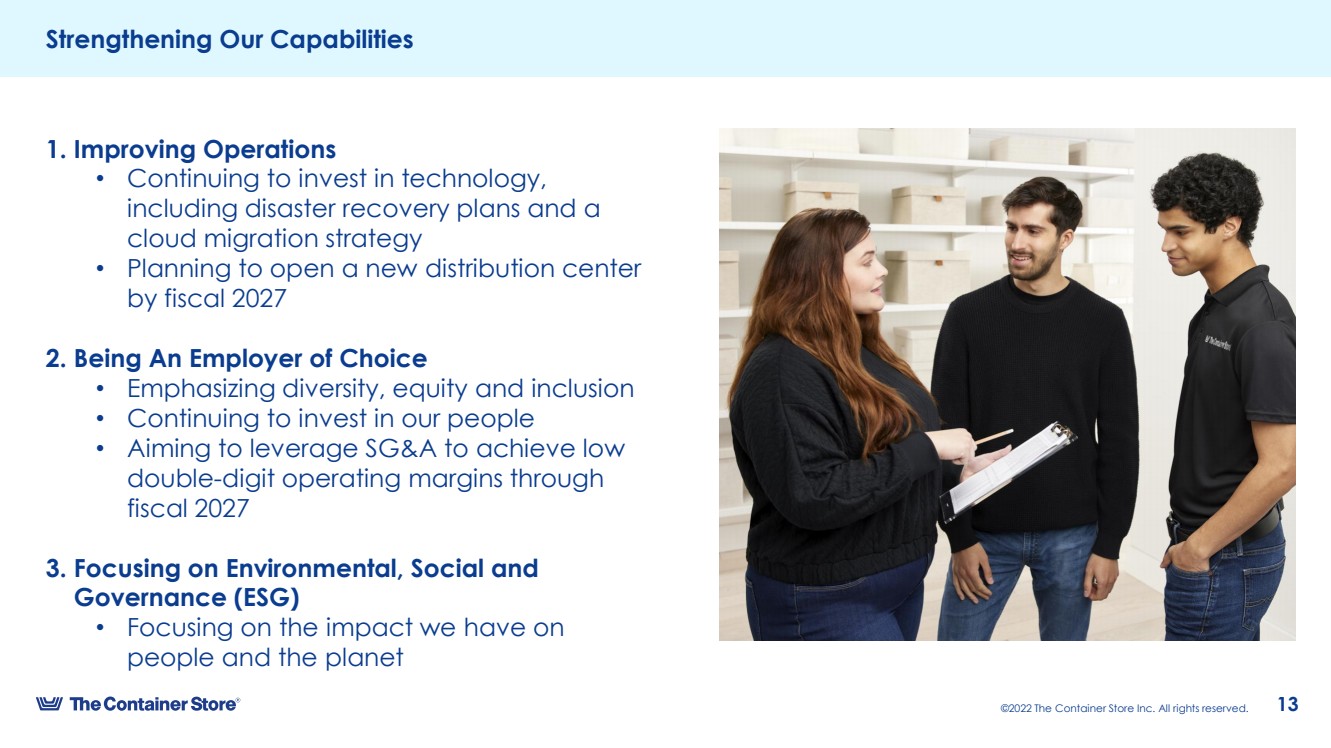
| 13 ©2022 The Container Store Inc. All rights reserved. Strengthening Our Capabilities 1. Improving Operations • Continuing to invest in technology, including disaster recovery plans and a cloud migration strategy • Planning to open a new distribution center by fiscal 2027 2. Being An Employer of Choice • Emphasizing diversity, equity and inclusion • Continuing to invest in our people • Aiming to leverage SG&A to achieve low double - digit operating margins through fiscal 2027 3. Focusing on Environmental, Social and Governance (ESG) • Focusing on the impact we have on people and the planet |
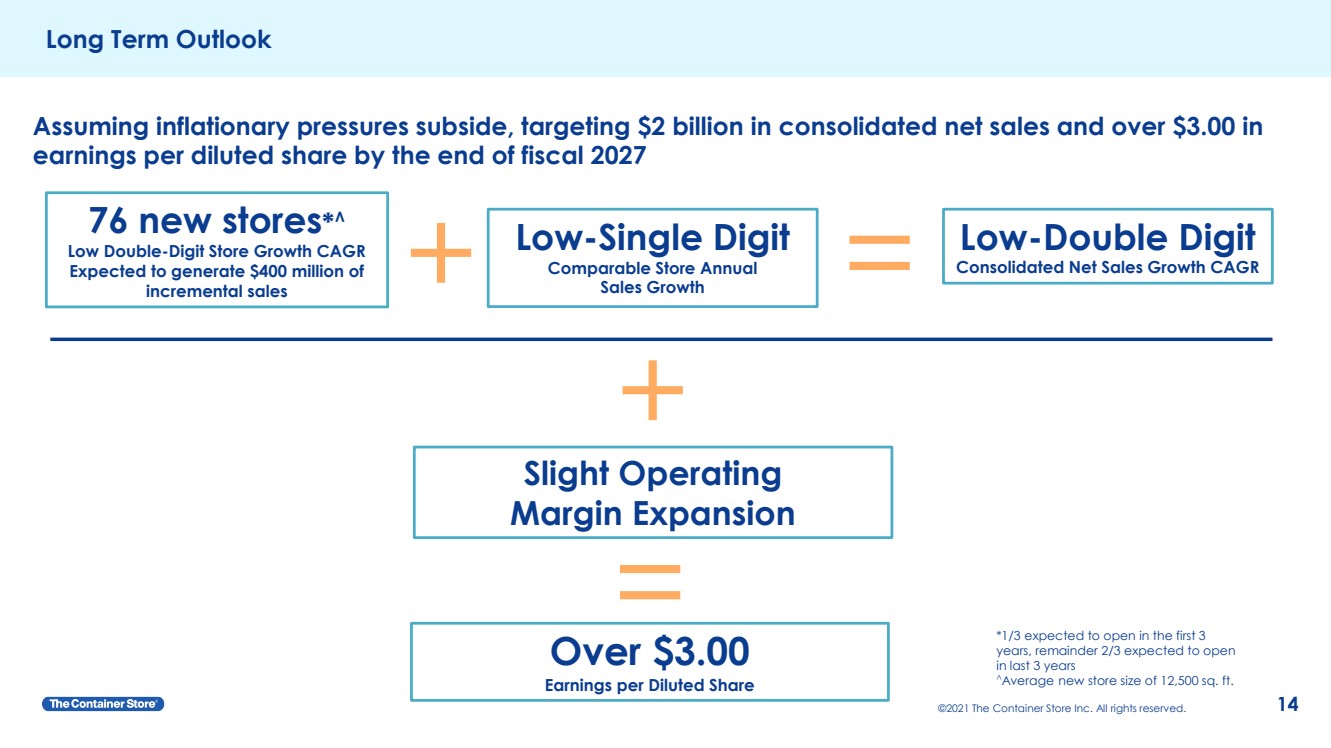
| 14 ©2021 The Container Store Inc. All rights reserved. Long Term Outlook Low - Single Digit Comparable Store Annual Sales Growth 76 new stores * ^ Low Double - Digit Store Growth CAGR Expected to generate $400 million of incremental sales Low - Double Digit Consolidated Net Sales Growth CAGR Assuming inflationary pressures subside, targeting $2 billion in consolidated net sales and over $3.00 in earnings per diluted share by the end of fiscal 2027 Slight Operating Margin Expansion Over $3.00 Earnings per Diluted Share *1/3 expected to open in the first 3 years, remainder 2/3 expected to open in last 3 years ^ Average new store size of 12,500 sq. ft. + = + = |
| Financial Results Q1 Fiscal 2022 |
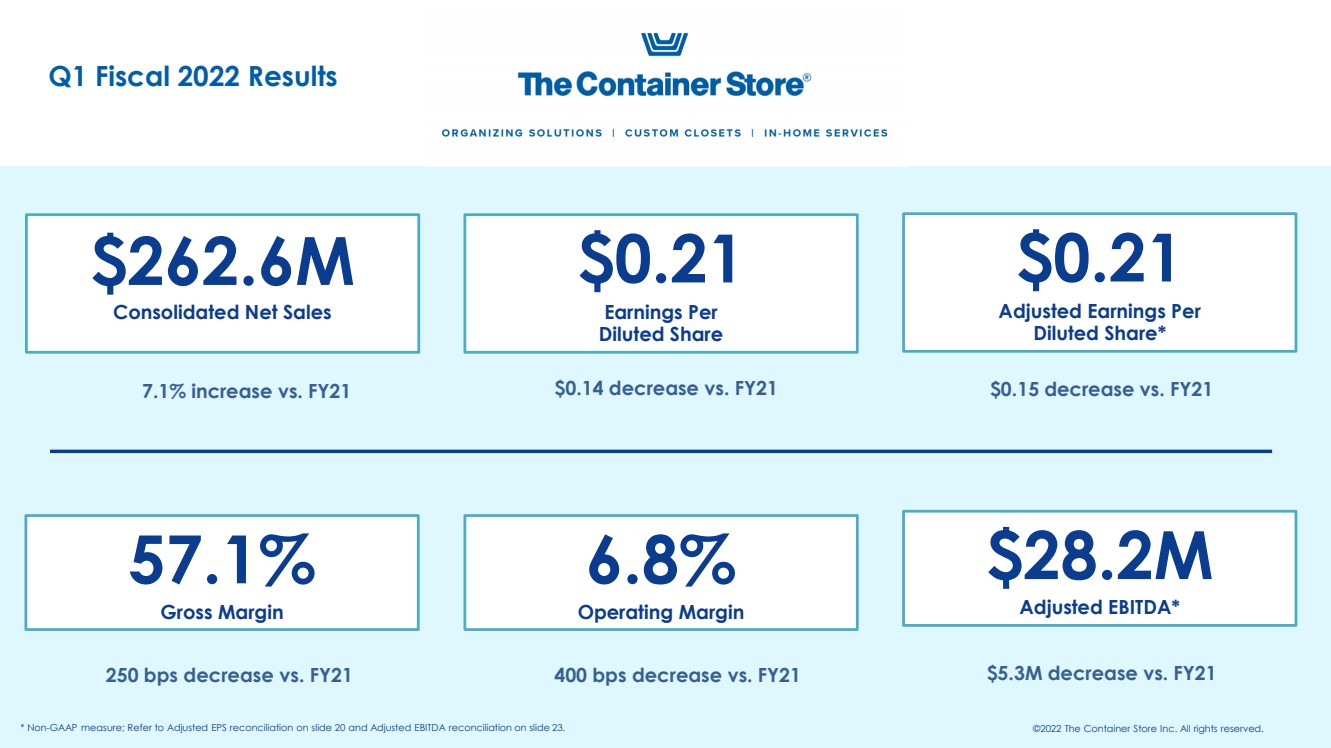
| $262.6M Consolidated Net Sales $0.21 Adjusted Earnings Per Diluted Share* $0.21 Earnings Per Diluted Share ©2022 The Container Store Inc. All rights reserved. $28.2M Adjusted EBITDA* 6.8% Operating Margin 57.1% Gross Margin 7.1% increase vs. FY21 $0.14 decrease vs. FY21 $0.15 decrease vs. FY21 250 bps decrease vs. FY21 $5.3M de cre ase vs. FY21 400 bps decrease vs. FY21 * Non - GAAP measure; Refer to Adjusted EPS reconciliation on slide 20 and Adjusted EBITDA reconciliation on slide 23 .. Q1 Fiscal 2022 Results |
| Questions? |

| Appendix |

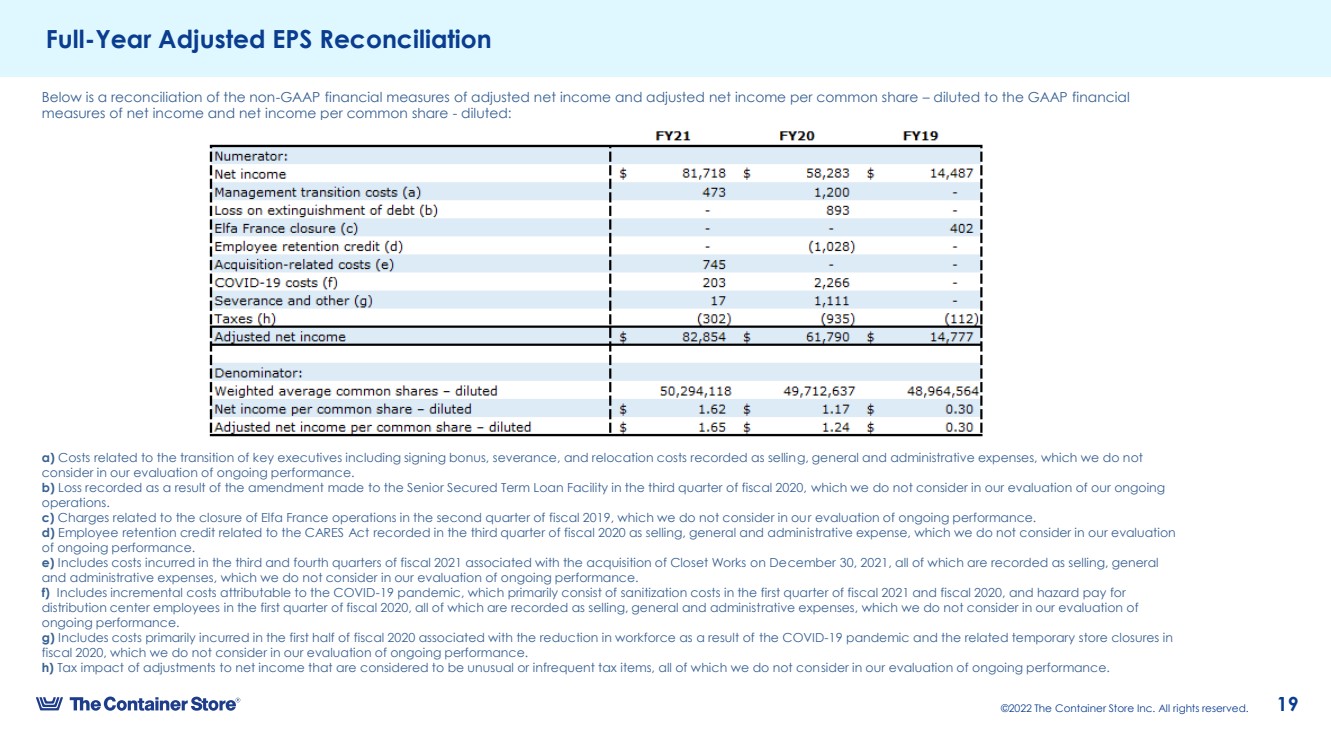
| 19 ©2022 The Container Store Inc. All rights reserved. Full - Year Adjusted EPS Reconciliation Below is a reconciliation of the non - GAAP financial measures of adjusted net income and adjusted net income per common share – d iluted to the GAAP financial measures of net income and net income per common share - diluted: a) Costs related to the transition of key executives including signing bonus, severance, and relocation costs recorded as sellin g, general and administrative expenses, which we do not consider in our evaluation of ongoing performance. b) Loss recorded as a result of the amendment made to the Senior Secured Term Loan Facility in the third quarter of fiscal 2020, w hich we do not consider in our evaluation of our ongoing operations. c) Charges related to the closure of Elfa France operations in the second quarter of fiscal 2019, which we do not consider in ou r e valuation of ongoing performance. d) Employee retention credit related to the CARES Act recorded in the third quarter of fiscal 2020 as selling, general and admin ist rative expense, which we do not consider in our evaluation of ongoing performance. e) Includes costs incurred in the third and fourth quarters of fiscal 2021 associated with the acquisition of Closet Works on De cem ber 30, 2021, all of which are recorded as selling, general and administrative expenses, which we do not consider in our evaluation of ongoing performance. f) Includes incremental costs attributable to the COVID - 19 pandemic, which primarily consist of sanitization costs in the first qua rter of fiscal 2021 and fiscal 2020, and hazard pay for distribution center employees in the first quarter of fiscal 2020, all of which are recorded as selling, general and administ rat ive expenses, which we do not consider in our evaluation of ongoing performance. g) Includes costs primarily incurred in the first half of fiscal 2020 associated with the reduction in workforce as a result of the COVID - 19 pandemic and the related temporary store closures in fiscal 2020, which we do not consider in our evaluation of ongoing performance. h) Tax impact of adjustments to net income that are considered to be unusual or infrequent tax items, all of which we do not con sid er in our evaluation of ongoing performance. |
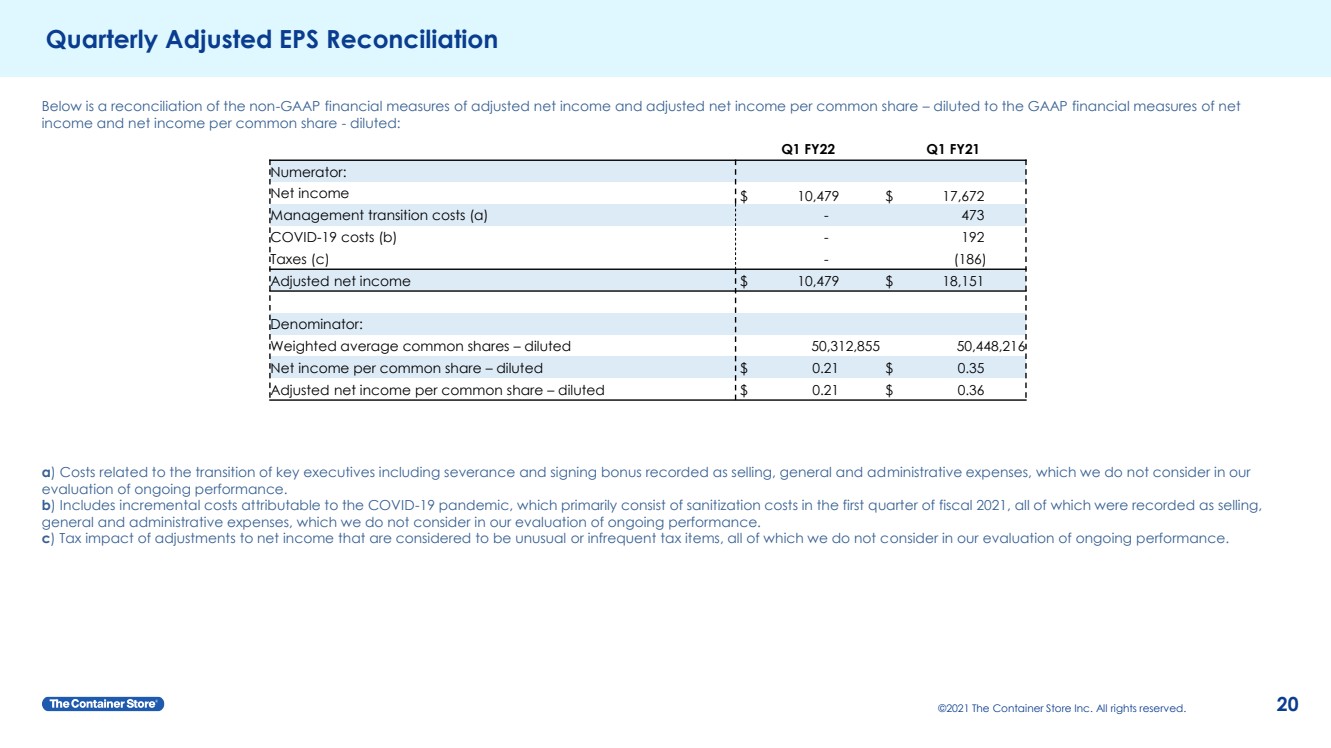
| 20 ©2021 The Container Store Inc. All rights reserved. Quarterly Adjusted EPS Reconciliation Below is a reconciliation of the non - GAAP financial measures of adjusted net income and adjusted net income per common share – d iluted to the GAAP financial measures of net income and net income per common share - diluted: a ) Costs related to the transition of key executives including severance and signing bonus recorded as selling, general and ad min istrative expenses, which we do not consider in our evaluation of ongoing performance. b ) Includes incremental costs attributable to the COVID - 19 pandemic, which primarily consist of sanitization costs in the first q uarter of fiscal 2021, all of which were recorded as selling, general and administrative expenses, which we do not consider in our evaluation of ongoing performance. c ) Tax impact of adjustments to net income that are considered to be unusual or infrequent tax items, all of which we do not c ons ider in our evaluation of ongoing performance. Q1 FY22 Q1 FY21 Numerator: Net income $ 10,479 $ 17,672 Management transition costs (a) - 473 COVID - 19 costs (b) - 192 Taxes (c) - (186) Adjusted net income $ 10,479 $ 18,151 Denominator: Weighted average common shares – diluted 50,312,855 50,448,216 Net income per common share – diluted $ 0.21 $ 0.35 Adjusted net income per common share – diluted $ 0.21 $ 0.36 |
| 21 ©2022 The Container Store Inc. All rights reserved. Full - Year Adjusted EBITDA Reconciliation Below is a reconciliation of the non - GAAP financial measures of EBITDA and Adjusted EBITDA to the GAAP financial measure of net income: |
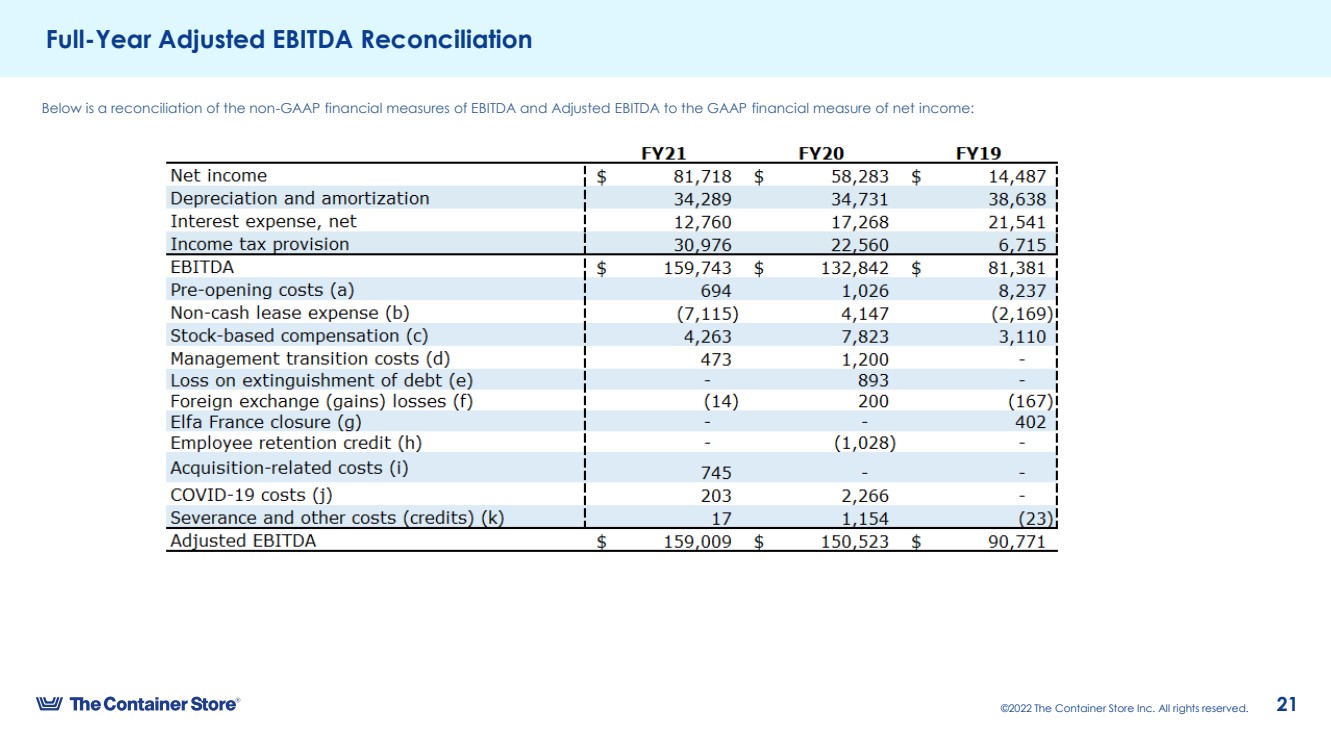
| 22 ©2022 The Container Store Inc. All rights reserved. Full - Year Adjusted EBITDA Reconciliation a) Non - capital expenditures associated with opening new stores and relocating stores, and net costs associated with opening the sec ond distribution center, including marketing expenses, travel and relocation costs, and training costs. We adjust for these costs to facilitate comparisons of our performance from per iod to period. b) Reflects the extent to which our annual GAAP operating lease expense has been above or below our cash operating lease payment s. The amount varies depending on the average age of our lease portfolio (weighted for size), as our GAAP operating lease expense on younger leases typically exceeds our c ash operating lease payments, while our GAAP operating lease expense on older leases is typically less than our cash operating lease payments. Non - cash lease expense increased in fisc al 2020 due to renegotiated terms with landlords due to COVID - 19 that resulted in deferral of $11.9 million of certain cash lease payments, of which all amounts were repaid in fiscal 2 021. In the thirteen and fifty - two weeks ended March 28, 2020, lease expenses associated with the opening of the second distribution center were excluded from Non - cash lease expense and inclu ded in Pre - opening costs. c) Non - cash charges related to stock - based compensation programs, which vary from period to period depending on volume and vesting timing of awards. We adjust for these charges to facilitate comparisons from period to period. d) Costs related to the transition of key executives including signing bonus, severance, and relocation costs recorded as sellin g, general and administrative expenses, which we do not consider in our evaluation of ongoing performance. e) Loss recorded as a result of the Seventh Amendment made to the Senior Secured Term Loan Facility in the third quarter of fisc al 2020, which we do not consider in our evaluation of our ongoing performance. f) Realized foreign exchange transactional gains/losses our management does not consider in our evaluation of our ongoing operat ion s. g) Charges related to the closure of Elfa France operations in the second quarter of fiscal 2019, which we do not consider in ou r e valuation of ongoing performance. h) Employee retention credit related to the CARES Act recorded in the third quarter of fiscal 2020 as selling, general and admin ist rative expense which we do not consider in our evaluation of ongoing performance. i) Includes costs incurred in the third and fourth quarters of fiscal 2021 associated with the acquisition of Closet Works on De ce mber 30, 2021, all of which are recorded as selling, general and administrative expenses, which we do not consider in our evaluation of ongoing performance j) Includes incremental costs attributable to the COVID - 19 pandemic, which primarily consist of sanitization costs in the first qua rter of fiscal 2021 and fiscal 2020, and hazard pay for distribution center employees in the first quarter of fiscal 2020, all of which are recorded as selling, general and administ rat ive expenses, which we do not consider in our evaluation of ongoing performance. k) Includes costs primarily incurred in the first half of fiscal 2020 associated with the reduction in workforce as a result of the COVID - 19 pandemic and the related temporary store closures in fiscal 2020, and for fiscal 2019 consists of severance and other charges/credits unrelated to COVID - 19, which we do not consider in our evaluation of ongoing performance. |
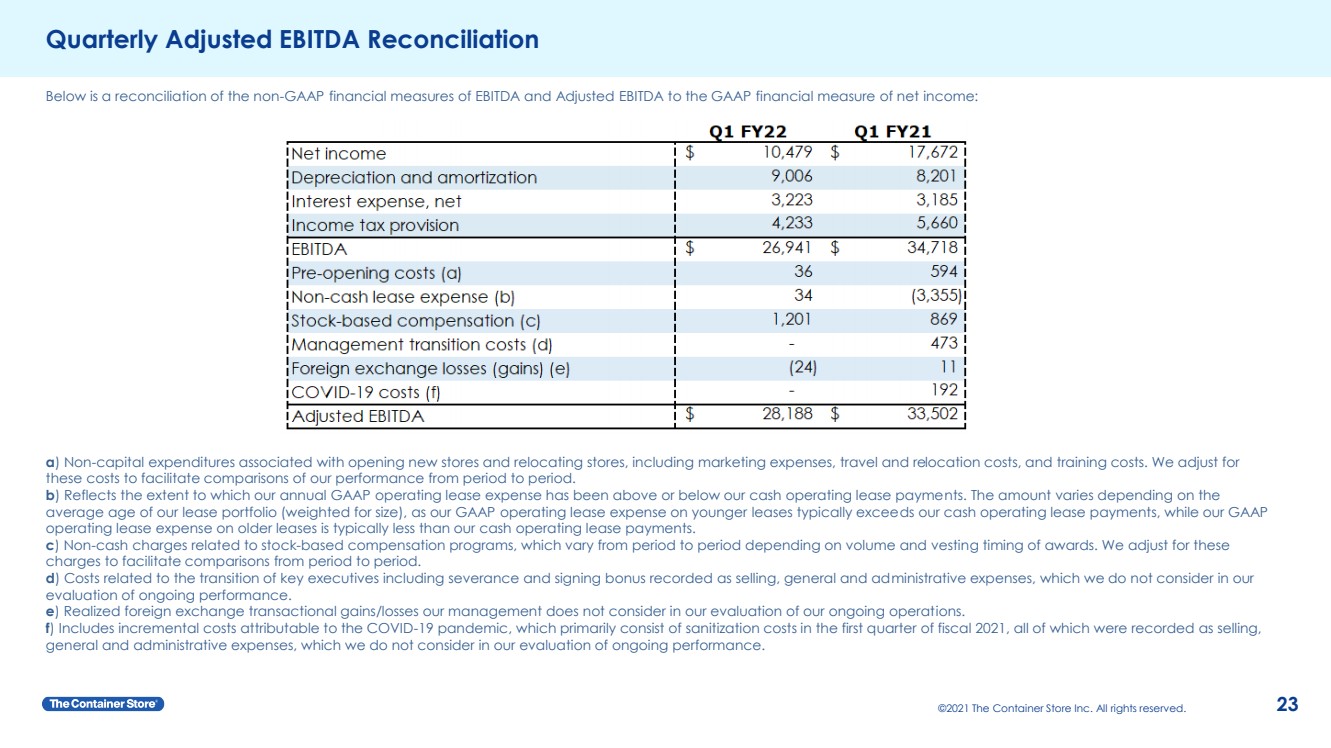
| 23 ©2021 The Container Store Inc. All rights reserved. Quarterly Adjusted EBITDA Reconciliation Below is a reconciliation of the non - GAAP financial measures of EBITDA and Adjusted EBITDA to the GAAP financial measure of net income: a ) Non - capital expenditures associated with opening new stores and relocating stores, including marketing expenses, travel and re location costs, and training costs. We adjust for these costs to facilitate comparisons of our performance from period to period. b ) Reflects the extent to which our annual GAAP operating lease expense has been above or below our cash operating lease payme nts .. The amount varies depending on the average age of our lease portfolio (weighted for size), as our GAAP operating lease expense on younger leases typically excee ds our cash operating lease payments, while our GAAP operating lease expense on older leases is typically less than our cash operating lease payments. c ) Non - cash charges related to stock - based compensation programs, which vary from period to period depending on volume and vestin g timing of awards. We adjust for these charges to facilitate comparisons from period to period. d ) Costs related to the transition of key executives including severance and signing bonus recorded as selling, general and ad min istrative expenses, which we do not consider in our evaluation of ongoing performance. e ) Realized foreign exchange transactional gains/losses our management does not consider in our evaluation of our ongoing operat i ons. f ) Includes incremental costs attributable to the COVID - 19 pandemic, which primarily consist of sanitization costs in the first q uarter of fiscal 2021, all of which were recorded as selling, general and administrative expenses, which we do not consider in our evaluation of ongoing performance. |