UNITED STATES
SECURITIES AND EXCHANGE COMMISSION
Washington, D.C. 20549
FORM N-CSR
CERTIFIED
SHAREHOLDER REPORT OF REGISTERED
MANAGEMENT INVESTMENT COMPANIES
Investment Company Act file number 811-22167
Virtus Strategy Trust
(Exact name of registrant as specified in charter)
101 Munson
Street
Greenfield, MA 01301-9668
(Address of principal executive offices) (Zip code)
Jennifer
Fromm, Esq.
Vice President, Chief Legal Officer, Counsel and Secretary for Registrant
One Financial Plaza
Hartford, CT 06103-2608
(Name and address of agent for service)
Registrant’s telephone number, including area code: (800) 243-1574
Date of fiscal year end: September 30
Date of reporting period: September 30, 2021
Form N-CSR is to be used by management investment companies to file reports with the Commission not later than 10 days
after the transmission to stockholders of any report that is required to be transmitted to stockholders under Rule 30e-1 under the Investment Company Act of 1940 (17 CFR
270.30e-1). The Commission may use the information provided on Form N-CSR in its regulatory, disclosure review, inspection, and policymaking roles.
A registrant is required to disclose the information specified by Form N-CSR, and the Commission will make this
information public. A registrant is not required to respond to the collection of information contained in Form N-CSR unless the Form displays a currently valid Office of Management and Budget (“OMB”)
control number. Please direct comments concerning the accuracy of the information collection burden estimate and any suggestions for reducing the burden to Secretary, Securities and Exchange Commission, 450 Fifth Street, NW, Washington, DC
20549-0609. The OMB has reviewed this collection of information under the clearance requirements of 44 U.S.C. § 3507.
Item 1. Reports to Stockholders.
(a) The Report to Shareholders is attached herewith.
(b) Not applicable.
ANNUAL REPORT
VIRTUS STRATEGY TRUST
| Virtus
AllianzGI Convertible Fund* |
| Virtus
AllianzGI Core Plus Bond Fund |
| Virtus
AllianzGI Emerging Markets Consumer Fund* |
| Virtus
AllianzGI Global Allocation Fund* |
| Virtus
AllianzGI Global Dynamic Allocation Fund* |
| Virtus
AllianzGI Global Sustainability Fund |
| Virtus
AllianzGI High Yield Bond Fund* |
| Virtus
AllianzGI International Small-Cap Fund* |
| Virtus
AllianzGI Preferred Securities and Income Fund |
| Virtus
AllianzGI Short Duration High Income Fund* |
| Virtus
AllianzGI Water Fund* |
| Virtus
NFJ Emerging Markets Value Fund* |
*Prospectus supplement applicable to this fund appears at the
back of this annual report.
As permitted by regulations adopted by the Securities and
Exchange Commission, paper copies of each Fund’s shareholder reports like this one will no longer be sent by mail, unless specifically requested from the Fund or from your financial intermediary, such as a broker-dealer or bank. Instead, the
reports will be made available on a website, and you will be notified by mail each time a report is posted and provided with a website link to access the report. If you already elected to receive shareholder reports electronically, you will not be
affected by this change and you need not take any action.
You may elect at any time to receive not only shareholder
reports but also certain other communications from the Fund electronically, or you may elect to receive paper copies of all future shareholder reports free of charge to you. If you own your shares directly with the Fund, you may make such elections
by calling the Fund at 1-800-243-1574 or, with respect to requesting electronic delivery, by visiting www.virtus.com. An election made directly with the Fund will apply to all Virtus Mutual Funds in which you own shares directly. If you own your
shares through a financial intermediary, please contact your financial intermediary to make your request and to determine whether your election will apply to all funds in which you own shares through that intermediary.
Not FDIC Insured • No Bank Guarantee • May Lose
Value
Table of Contents
|
1
|
|
2
|
|
6
|
| Fund
|
Fund
Summary |
Schedule
of
Investments |
|
10
|
44
|
|
12
|
48
|
|
15
|
53
|
|
18
|
55
|
|
22
|
66
|
|
26
|
80
|
|
29
|
82
|
|
31
|
87
|
|
34
|
89
|
|
37
|
92
|
|
39
|
96
|
|
42
|
98
|
|
101
|
|
107
|
|
112
|
|
116
|
|
126
|
|
154
|
|
155
|
|
156
|
|
157
|
Proxy Voting Procedures and Voting Record
(Form N-PX)
The subadvisers
vote proxies, if any, relating to portfolio securities in accordance with procedures that have been approved by the Board of Trustees of the Trust (“Trustees”, or the “Board”). You may obtain a description of these
procedures, along with information regarding how the Funds voted proxies during the most recent 12-month period ended June 30, free of charge, by calling toll-free 1-800-243-1574. This information is also available through the Securities and
Exchange Commission’s (the “SEC”) website at https://www.sec.gov.
PORTFOLIO
HOLDINGS INFORMATION
The Trust files a
complete schedule of portfolio holdings for each Fund with the SEC for the first and third quarters of each fiscal year as an exhibit to its reports on Form N-PORT-P. Form N-PORT-P is available on the SEC’s website at https://www.sec.gov.
This report is not authorized for distribution to prospective
investors in the Funds presented in this book unless preceded or accompanied by an effective prospectus which includes information concerning the sales charge, each Fund’s record and other pertinent information.
To Virtus Strategy Trust Shareholders:
I am pleased to present this annual
report, which reviews the performance of your Fund for the 12 months ended September 30, 2021.
During this fiscal year, markets expressed
optimism about the economic reopening that was driven by the release of COVID-19 vaccines, monetary support, and fiscal stimulus. Doubts crept in during the period, however, as the Delta variant impacted productivity and cascading supply chain
issues led to higher prices. Strong corporate profitability drove equity markets higher for much of the period, although concerns about inflation and interest rates hindered fixed income markets.
Domestic and international equity indexes delivered strong
returns for the 12 months ended September 30, 2021. U.S. large-capitalization stocks returned 30.00%, as measured by the S&P 500® Index, but were outpaced by small-cap
stocks, which gained 47.68%, as measured by the Russell 2000® Index. Within international equities, developed markets, as measured by the MSCI EAFE® Index (net), returned 25.73%, while emerging markets, as measured by the MSCI Emerging Markets Index (net), gained 18.20%.
In fixed income markets, the yield on the 10-year Treasury
rose sharply to 1.52% on September 30, 2021, from 0.69% on September 30, 2020, based on fears of rising inflation. The broader U.S. fixed income market, as represented by the Bloomberg U.S. Aggregate Bond Index, was down 0.90% for the 12-month
period, but non-investment grade bonds, as measured by the Bloomberg U.S. Corporate High Yield Bond Index, were up 11.28%.
On behalf of our investment managers, I thank you for
entrusting the Virtus Funds with your assets. Please call our customer service team at 800-243-1574 if you have questions about your account or require assistance. We appreciate your business and remain committed to your long-term financial
success.
Sincerely,
George R.
Aylward
President, Virtus Funds
November 2021
Refer to the Manager’s Discussion section for your
Fund’s performance. Performance data quoted represents past results. Past performance is no guarantee of future results, and current performance may be higher or lower than the performance shown above. Investing involves risk, including the
risk of loss of principal invested.
VIRTUS STRATEGY
TRUST
DISCLOSURE OF FUND EXPENSES (Unaudited)
FOR THE SIX-MONTH PERIOD OF April 1,
2021 TO September 30, 2021
We believe it is important for you to
understand the impact of costs on your investment. All mutual funds have operating expenses. As a shareholder of a Virtus Strategy Trust Fund (each, a “Fund”), you may incur two types of costs: (1) transaction costs, including sales
charges on purchases of Class A shares and contingent deferred sales charges on Class C shares; and (2) ongoing costs, including investment advisory fees, distribution and service fees, and other expenses. Class P shares, Institutional Class shares,
Class R6 shares and Administrative Class shares are sold without sales charges and do not incur distribution and service fees. Class R6 shares also do not incur shareholder servicing fees. For further information regarding applicable sales charges,
see Note 1 in the Notes to Financial Statements. These examples are intended to help you understand your ongoing costs (in dollars) of investing in a Fund and to compare these costs with the ongoing costs of investing in other mutual funds. These
examples are based on an investment of $1,000 invested at the beginning of the period and held for the entire six-month period. The Annualized Expense Ratios may be different from the expense ratios in the Financial Highlights which are for the
fiscal year ended September 30, 2021.
Please note that the expenses shown in the
accompanying tables are meant to highlight your ongoing costs only and do not reflect any transactional costs, such as sales charges or contingent deferred sales charges. Therefore, the accompanying tables are useful in comparing ongoing costs only,
and will not help you determine the relative total costs of owning different funds. In addition, if these transactional costs were included, your costs would have been higher. The calculations assume no shares were bought or sold during the period.
Your actual costs may have been higher or lower, depending on the amount of your investment and the timing of any purchases or redemptions.
Actual Expenses
The table below provides information about
actual account values and actual expenses. You may use the information below, together with the amount you invested, to estimate the expenses that you paid over the period. Simply divide your account value by $1,000 (for example, an $8,600 account
value divided by $1,000 = 8.6), then multiply the result by the number in the table under the heading entitled “Expenses Paid During Period” to estimate the expenses you paid on your account during this period.
| |
|
Beginning
Account Value
April 1, 2021 |
|
Ending
Account Value
September 30, 2021 |
|
Annualized
Expense
Ratio |
|
Expenses
Paid
During
Period* |
|
AllianzGI Convertible
Fund
|
|
|
|
|
|
|
|
|
| |
Class
A |
$
1,000.00 |
|
$
1,027.80 |
|
0.96
% |
|
$
4.88 |
| |
Class
C |
1,000.00
|
|
1,024.10
|
|
1.73
|
|
8.78
|
| |
Class
P |
1,000.00
|
|
1,029.20
|
|
0.71
|
|
3.61
|
| |
Institutional
Class |
1,000.00
|
|
1,029.30
|
|
0.71
|
|
3.61
|
| |
Administrative
Class |
1,000.00
|
|
1,028.10
|
|
0.93
|
|
4.73
|
|
AllianzGI Core Plus Bond
Fund
|
|
|
|
|
|
|
|
|
| |
Class
P |
1,000.00
|
|
1,024.70
|
|
0.36
|
|
1.83
|
| |
Institutional
Class |
1,000.00
|
|
1,025.10
|
|
0.32
|
|
1.62
|
| |
Class
R6 |
1,000.00
|
|
1,024.90
|
|
0.26
|
|
1.32
|
|
AllianzGI Emerging Markets Consumer
Fund
|
|
|
|
|
|
|
|
|
| |
Class
A |
1,000.00
|
|
914.80
|
|
1.39
|
|
6.67
|
| |
Institutional
Class |
1,000.00
|
|
916.70
|
|
1.04
|
|
5.00
|
|
AllianzGI Global Allocation
Fund
|
|
|
|
|
|
|
|
|
| |
Class
A |
1,000.00
|
|
1,048.90
|
|
0.52
|
|
2.67
|
| |
Class
C |
1,000.00
|
|
1,044.80
|
|
1.27
|
|
6.51
|
| |
Class
P |
1,000.00
|
|
1,049.80
|
|
0.32
|
|
1.64
|
| |
Institutional
Class |
1,000.00
|
|
1,050.30
|
|
0.29
|
|
1.49
|
| |
Class
R6 |
1,000.00
|
|
1,050.40
|
|
0.22
|
|
1.13
|
| |
Administrative
Class |
1,000.00
|
|
1,062.90
|
|
0.41
|
|
2.12
|
|
AllianzGI Global Dynamic Allocation
Fund
|
|
|
|
|
|
|
|
|
| |
Class
A |
1,000.00
|
|
1,071.20
|
|
0.82
|
|
4.26
|
| |
Class
C |
1,000.00
|
|
1,067.20
|
|
1.58
|
|
8.19
|
| |
Class
P |
1,000.00
|
|
1,071.80
|
|
0.66
|
|
3.43
|
| |
Institutional
Class |
1,000.00
|
|
1,072.70
|
|
0.54
|
|
2.81
|
| |
Class
R6 |
1,000.00
|
|
1,073.00
|
|
0.54
|
|
2.81
|
| |
Administrative
Class |
1,000.00
|
|
1,071.50
|
|
0.79
|
|
4.10
|
|
AllianzGI Global Sustainability
Fund
|
|
|
|
|
|
|
|
|
| |
Class
A |
1,000.00
|
|
1,104.90
|
|
0.94
|
|
4.96
|
| |
Class
P |
1,000.00
|
|
1,105.80
|
|
0.79
|
|
4.17
|
| |
Institutional
Class |
1,000.00
|
|
1,106.50
|
|
0.69
|
|
3.64
|
VIRTUS STRATEGY
TRUST
DISCLOSURE OF FUND EXPENSES (Unaudited) (Continued)
FOR THE SIX-MONTH PERIOD OF April 1,
2021 TO September 30, 2021
| |
|
Beginning
Account Value
April 1, 2021 |
|
Ending
Account Value
September 30, 2021 |
|
Annualized
Expense
Ratio |
|
Expenses
Paid
During
Period* |
|
AllianzGI High Yield Bond
Fund
|
|
|
|
|
|
|
|
|
| |
Class
A |
$1,000.00
|
|
$1,040.60
|
|
1.07%
|
|
$
5.47 |
| |
Class
C |
1,000.00
|
|
1,036.90
|
|
1.81
|
|
9.24
|
| |
Class
P |
1,000.00
|
|
1,042.50
|
|
0.80
|
|
4.10
|
| |
Institutional
|
1,000.00
|
|
1,042.70
|
|
0.83
|
|
4.25
|
| |
Administrative
Class |
1,000.00
|
|
1,063.30
|
|
0.97
|
|
5.02
|
|
AllianzGI International Small-Cap
Fund
|
|
|
|
|
|
|
|
|
| |
Class
A |
1,000.00
|
|
1,014.50
|
|
1.25
|
|
6.31
|
| |
Class
C |
1,000.00
|
|
1,010.60
|
|
2.00
|
|
10.08
|
| |
Class
P |
1,000.00
|
|
1,015.30
|
|
1.10
|
|
5.56
|
| |
Institutional
Class |
1,000.00
|
|
1,015.30
|
|
1.04
|
|
5.25
|
| |
Class
R6 |
1,000.00
|
|
1,015.60
|
|
1.00
|
|
5.05
|
|
AllianzGI Preferred Securities and Income
Fund
|
|
|
|
|
|
|
|
|
| |
Class
P |
1,000.00
|
|
1,071.20
|
|
0.59
|
|
3.06
|
| |
Institutional
Class |
1,000.00
|
|
1,071.90
|
|
0.55
|
|
2.86
|
| |
Class
R6 |
1,000.00
|
|
1,072.00
|
|
0.50
|
|
2.60
|
|
AllianzGI Short Duration High Income
Fund
|
|
|
|
|
|
|
|
|
| |
Class
A |
1,000.00
|
|
1,012.30
|
|
0.86
|
|
4.34
|
| |
Class
C |
1,000.00
|
|
1,011.00
|
|
1.11
|
|
5.60
|
| |
Class
P |
1,000.00
|
|
1,013.70
|
|
0.68
|
|
3.43
|
| |
Institutional
Class |
1,000.00
|
|
1,014.30
|
|
0.60
|
|
3.03
|
| |
Class
R6 |
1,000.00
|
|
1,014.50
|
|
0.55
|
|
2.78
|
|
AllianzGI Water
Fund
|
|
|
|
|
|
|
|
|
| |
Class
A |
1,000.00
|
|
1,089.80
|
|
1.22
|
|
6.39
|
| |
Class
C |
1,000.00
|
|
1,085.60
|
|
1.97
|
|
10.30
|
| |
Class
P |
1,000.00
|
|
1,091.00
|
|
0.94
|
|
4.93
|
| |
Institutional
Class |
1,000.00
|
|
1,091.00
|
|
0.93
|
|
4.87
|
|
NFJ Emerging Markets Value
Fund
|
|
|
|
|
|
|
|
|
| |
Class
A |
1,000.00
|
|
973.90
|
|
1.14
|
|
5.64
|
| |
Class
C |
1,000.00
|
|
970.30
|
|
1.89
|
|
9.34
|
| |
Class
P |
1,000.00
|
|
974.80
|
|
0.99
|
|
4.90
|
| |
Institutional
Class |
1,000.00
|
|
975.10
|
|
0.89
|
|
4.41
|
|
* |
Expenses
are equal to the relevant Fund’s annualized expense ratio, which is net of waived fees and reimbursed expenses, if applicable, multiplied by the average account value over the period, multiplied by the number of days (183) expenses were
accrued in the most recent fiscal half-year, then divided by 365 to reflect the one-half year period. |
For Funds which may invest in other funds, the annualized
expense ratios noted above do not reflect fees and expenses associated with any underlying funds. If such fees and expenses had been included, the expenses would have been higher.
You can find more information about a Fund’s expenses in
the Financial Statements section that follows. For additional information on operating expenses and other shareholder costs, refer to that Fund’s prospectus.
Hypothetical Example for Comparison Purposes
The table below provides information about
hypothetical account values and hypothetical expenses based on a Fund’s actual expense ratio and an assumed rate of return of 5% per year before expenses, which is not your Fund’s actual return. The hypothetical account values and
expenses may not be used to estimate the actual ending account balance or expenses you paid for the period. You may use this information to compare the ongoing costs of investing in your Fund and other funds. To do so, compare these 5% hypothetical
examples with the 5% hypothetical examples that appear in the shareholder reports of other mutual funds.
VIRTUS STRATEGY
TRUST
DISCLOSURE OF FUND EXPENSES (Unaudited) (Continued)
FOR THE SIX-MONTH PERIOD OF April 1,
2021 TO September 30, 2021
| |
|
Beginning
Account Value
April 1, 2021 |
|
Ending
Account Value
September 30, 2021 |
|
Annualized
Expense
Ratio |
|
Expenses
Paid
During
Period* |
|
AllianzGI Convertible
Fund
|
|
|
|
|
|
|
|
|
| |
Class
A |
$
1,000.00 |
|
$
1,020.26 |
|
0.96
% |
|
$
4.86 |
| |
Class
C |
1,000.00
|
|
1,016.39
|
|
1.73
|
|
8.74
|
| |
Class
P |
1,000.00
|
|
1,021.51
|
|
0.71
|
|
3.60
|
| |
Institutional
Class |
1,000.00
|
|
1,021.51
|
|
0.71
|
|
3.60
|
| |
Administrative
Class |
1,000.00
|
|
1,020.41
|
|
0.93
|
|
4.71
|
|
AllianzGI Core Plus Bond
Fund
|
|
|
|
|
|
|
|
|
| |
Class
P |
1,000.00
|
|
1,023.26
|
|
0.36
|
|
1.83
|
| |
Institutional
Class |
1,000.00
|
|
1,023.46
|
|
0.32
|
|
1.62
|
| |
Class
R6 |
1,000.00
|
|
1,023.76
|
|
0.26
|
|
1.32
|
|
AllianzGI Emerging Markets Consumer
Fund
|
|
|
|
|
|
|
|
|
| |
Class
A |
1,000.00
|
|
1,018.10
|
|
1.39
|
|
7.03
|
| |
Institutional
Class |
1,000.00
|
|
1,019.85
|
|
1.04
|
|
5.27
|
|
AllianzGI Global Allocation
Fund
|
|
|
|
|
|
|
|
|
| |
Class
A |
1,000.00
|
|
1,022.46
|
|
0.52
|
|
2.64
|
| |
Class
C |
1,000.00
|
|
1,018.70
|
|
1.27
|
|
6.43
|
| |
Class
P |
1,000.00
|
|
1,023.46
|
|
0.32
|
|
1.62
|
| |
Institutional
Class |
1,000.00
|
|
1,023.61
|
|
0.29
|
|
1.47
|
| |
Class
R6 |
1,000.00
|
|
1,023.97
|
|
0.22
|
|
1.12
|
| |
Administrative
Class |
1,000.00
|
|
1,023.01
|
|
0.41
|
|
2.08
|
|
AllianzGI Global Dynamic Allocation
Fund
|
|
|
|
|
|
|
|
|
| |
Class
A |
1,000.00
|
|
1,020.96
|
|
0.82
|
|
4.15
|
| |
Class
C |
1,000.00
|
|
1,017.15
|
|
1.58
|
|
7.99
|
| |
Class
P |
1,000.00
|
|
1,021.76
|
|
0.66
|
|
3.35
|
| |
Institutional
Class |
1,000.00
|
|
1,022.36
|
|
0.54
|
|
2.74
|
| |
Class
R6 |
1,000.00
|
|
1,022.36
|
|
0.54
|
|
2.74
|
| |
Administrative
Class |
1,000.00
|
|
1,021.11
|
|
0.79
|
|
4.00
|
|
AllianzGI Global Sustainability
Fund
|
|
|
|
|
|
|
|
|
| |
Class
A |
1,000.00
|
|
1,020.36
|
|
0.94
|
|
4.76
|
| |
Class
P |
1,000.00
|
|
1,021.11
|
|
0.79
|
|
4.00
|
| |
Institutional
Class |
1,000.00
|
|
1,021.61
|
|
0.69
|
|
3.50
|
|
AllianzGI High Yield Bond
Fund
|
|
|
|
|
|
|
|
|
| |
Class
A |
1,000.00
|
|
1,019.70
|
|
1.07
|
|
5.42
|
| |
Class
C |
1,000.00
|
|
1,015.99
|
|
1.81
|
|
9.15
|
| |
Class
P |
1,000.00
|
|
1,021.06
|
|
0.80
|
|
4.05
|
| |
Institutional
|
1,000.00
|
|
1,020.91
|
|
0.83
|
|
4.20
|
| |
Administrative
Class |
1,000.00
|
|
1,020.21
|
|
0.97
|
|
4.91
|
|
AllianzGI International Small-Cap
Fund
|
|
|
|
|
|
|
|
|
| |
Class
A |
1,000.00
|
|
1,018.80
|
|
1.25
|
|
6.33
|
| |
Class
C |
1,000.00
|
|
1,015.04
|
|
2.00
|
|
10.10
|
| |
Class
P |
1,000.00
|
|
1,019.55
|
|
1.10
|
|
5.57
|
| |
Institutional
Class |
1,000.00
|
|
1,019.85
|
|
1.04
|
|
5.27
|
| |
Class
R6 |
1,000.00
|
|
1,020.05
|
|
1.00
|
|
5.06
|
|
AllianzGI Preferred Securities and Income
Fund
|
|
|
|
|
|
|
|
|
| |
Class
P |
1,000.00
|
|
1,022.11
|
|
0.59
|
|
2.99
|
| |
Institutional
Class |
1,000.00
|
|
1,022.31
|
|
0.55
|
|
2.79
|
| |
Class
R6 |
1,000.00
|
|
1,022.56
|
|
0.50
|
|
2.54
|
|
AllianzGI Short Duration High Income
Fund
|
|
|
|
|
|
|
|
|
| |
Class
A |
1,000.00
|
|
1,020.76
|
|
0.86
|
|
4.36
|
| |
Class
C |
1,000.00
|
|
1,019.50
|
|
1.11
|
|
5.62
|
| |
Class
P |
1,000.00
|
|
1,021.66
|
|
0.68
|
|
3.45
|
| |
Institutional
Class |
1,000.00
|
|
1,022.06
|
|
0.60
|
|
3.04
|
| |
Class
R6 |
1,000.00
|
|
1,022.31
|
|
0.55
|
|
2.79
|
VIRTUS STRATEGY
TRUST
DISCLOSURE OF FUND EXPENSES (Unaudited) (Continued)
FOR THE SIX-MONTH PERIOD OF April 1,
2021 TO September 30, 2021
| |
|
Beginning
Account Value
April 1, 2021 |
|
Ending
Account Value
September 30, 2021 |
|
Annualized
Expense
Ratio |
|
Expenses
Paid
During
Period* |
|
AllianzGI Water
Fund
|
|
|
|
|
|
|
|
|
| |
Class
A |
$1,000.00
|
|
$1,018.95
|
|
1.22%
|
|
$
6.17 |
| |
Class
C |
1,000.00
|
|
1,015.19
|
|
1.97
|
|
9.95
|
| |
Class
P |
1,000.00
|
|
1,020.36
|
|
0.94
|
|
4.76
|
| |
Institutional
Class |
1,000.00
|
|
1,020.41
|
|
0.93
|
|
4.71
|
|
NFJ Emerging Markets Value
Fund
|
|
|
|
|
|
|
|
|
| |
Class
A |
1,000.00
|
|
1,019.35
|
|
1.14
|
|
5.77
|
| |
Class
C |
1,000.00
|
|
1,015.59
|
|
1.89
|
|
9.55
|
| |
Class
P |
1,000.00
|
|
1,020.10
|
|
0.99
|
|
5.01
|
| |
Institutional
Class |
1,000.00
|
|
1,020.61
|
|
0.89
|
|
4.51
|
|
* |
Expenses
are equal to the relevant Fund’s annualized expense ratio, which is net of waived fees and reimbursed expenses, if applicable, multiplied by the average account value over the period, multiplied by the number of days (183) expenses were
accrued in the most recent fiscal half-year, then divided by 365 to reflect the one-half year period. |
For Funds which may invest in other funds, the annualized
expense ratios noted above do not reflect fees and expenses associated with any underlying funds. If such fees and expenses had been included, the expenses would have been higher.
You can find more information about a Fund’s expenses in
the Financial Statements section that follows. For additional information on operating expenses and other shareholder costs, refer to that Fund’s prospectus.
VIRTUS STRATEGY
TRUST
KEY INVESTMENT TERMS (Unaudited)
September 30, 2021
Alternative Credit Enhancement Securities® (“ACES”)
ACEs, a type of multiclass mortgage-related security in which
interest and principal payments from multifamily mortgages are structured into separately traded securities.
American Depositary Receipt (“ADR”)
Represents shares of foreign companies traded in U.S. dollars
on U.S. exchanges that are held by a U.S. bank or a trust. Foreign companies use ADRs in order to make it easier for Americans to buy their shares.
Asset-Backed Securities (“ABS”)
Asset-backed securities represent interests in pools of
underlying assets such as motor vehicle installment sales or installment loan contracts, leases of various types of real and personal property, and receivables from credit card arrangements.
Additional tier 1 securities (“ATIs”)
AT1 bonds were introduced by regulators after the global
financial crisis to shore up banks’ balance sheets. They have high coupons, and banks do not need to repay the principal. Because the bonds can be written off in certain circumstances, they are also known as “contingent
convertibles.”
Bank of England
The Central Bank of the United Kingdom, responsible for
controlling the money supply, interest rates, credit, and regulation of U.K. Banks with the goal of keeping the U.K. financial system stable.
Bloomberg U.S. Aggregate Bond Index
The Bloomberg U.S. Aggregate Bond Index measures the U.S.
investment-grade fixed-rate bond market. The index is calculated on a total return basis. The index is unmanaged, its returns do not reflect any fees, expenses, or sales charges, and it is not available for direct investment.
Bloomberg U.S. Corporate High Yield Bond Index
The Bloomberg U.S. Corporate High Yield Bond Index measures the
U.S. dollar-denominated, high yield, fixed-rate corporate bond market. The index is calculated on a total return basis. The index is unmanaged, its returns do not reflect any fees, expenses, or sales charges, and it is not available for direct
investment.
Collateralized Loan Obligation
(“CLO”)
A collateralized loan obligation is a
type of security backed by a pool of debt, typically low-rated corporate loans, structured so that there are several classes of bondholders with varying maturities, called tranches.
Dow Jones Sustainability World Index (net)
The Dow Jones Sustainability World Total Return Index tracks
the performance of the top 10% of the 2500 largest companies in the S&P Global Broad Market Index that are the world’s sustainability leaders based on economic, environmental and social criteria.
Earnings before interest, taxes and depreciation
(“EBITDA”)
A financial measure that reflects
operating and nonoperating profit before the deduction of interest and income taxes. Depreciation and amortization expenses are not included in the costs.
European Central Bank (“ECB”)
The ECB is the central bank of the 19 European Union countries
which use the euro. The bank main task is to maintain price stability, by making sure that inflation remains low, stable and predictable.
Exchange-Traded Fund (“ETF”)
An open-end fund that is traded on a stock exchange. Most ETFs
have a portfolio of stocks or bonds that track a specific market index.
Federal Home Loan Mortgage Corporation (“Freddie
Mac”)
A government-owned corporation that buys
mortgages and packages them into mortgage-backed securities.
Federal National Mortgage Association (“Fannie
Mae”)
A government-sponsored, publicly traded
enterprise that makes mortgages available to low- and moderate-income borrowers. It does not provide loans, but backs or guarantees them in the secondary mortgage market.
Federal Reserve (the “Fed”)
The Central Bank of the United States, responsible for
controlling the money supply, interest rates and credit with the goal of keeping the U.S. economy and currency stable. Governed by a seven-member board, the system includes 12 regional Federal Reserve Banks, 25 branches and all national and state
banks that are part of the system.
VIRTUS STRATEGY
TRUST
KEY INVESTMENT TERMS (Unaudited) (Continued) September 30, 2021
Financial Times Stock Exchange (“FTSE”)
FTSE Russell provides a comprehensive range of reliable and
accurate indexes, giving investors the tools they require to measure and analyze global markets across asset classes, styles or strategies.
FTSE/Johannesburg Stock Exchange
(“FTSE/JSE”)
The FTSE/JSE Africa Index Series
represents the South African equity market and its market segments. Market capitalization-weighted and alternatively-weighted indexes are available, including equally-weighted, shareholder-weighted, and capped indexes.
FTSE Milano Indice di Borsa (“FTSE MIB”)
The FTSE MIB Italia Series provides investors with a
comprehensive and complementary set of market-cap weighted indexes measuring the performance of Italian companies listed on the Italian stock exchange, Borsa Italia. The indexes are designed for use as performance benchmarks and are suitable for the
creation of structured products, index-tracking funds, exchange-traded funds and derivatives.
Global Depositary Receipt (“GDR”)
Represents shares of foreign companies traded in U.S. dollars
on U.S. exchanges that are held by an international bank or a trust. Foreign companies use GDRs in order to make it easier for foreign investors to buy their shares.
Government National Mortgage Association (“Ginnie
Mae”)
A U.S. government corporation that guarantees
the timely payment of principal and interest on mortgage-backed securities (MBSs) issued by approved Ginnie Mae lenders, with the goal of expanding the pool of homeowners by mostly aiding lending to homeowners who are traditionally underserved in
the mortgage marketplace such as first-time home buyers and low-income borrowers.
Group of Seven (“G7”)
An inter-governmental political forum whose members include
Canada, France, Germany, Italy, Japan, the U.K. and the U.S..
Intercontinental Exchange (“ICE”)
An American Fortune 500 company formed in 2000 that operates
global exchanges and clearing houses, and provides mortgage technology, data and listing services. The company owns exchanges for financial and commodity markets, and operates 12 regulated exchanges and marketplaces. This includes ICE futures
exchanges in the United States, Canada and Europe, the Liffe futures exchanges in Europe, the New York Stock Exchange, equity options exchanges and over-the-counter energy, credit and equity markets.
ICE BofA 1-3 Year BB U.S. Cash Pay High Yield Index
The ICE BofA 1-3 Year BB U.S. Cash Pay High Yield Index is a
subset of The ICE BofA U.S. Cash Pay High Yield Index including all securities with a remaining term to final maturity less than 3 years and rated BB1 through BB3, inclusive. The ICE BofA 1-3 Year U.S. Cash Pay High Yield Index tracks the
performance of U.S. dollar denominated below investment grade corporate debt, currently in a coupon paying period, that is publicly issued in the U.S. domestic market.
ICE BofA Fixed Rate Preferred Securities Index
The ICE BofA Fixed Rate Preferred Securities Index tracks the
performance of fixed rate U.S. dollar denominated preferred securities issued in the U.S. domestic market.
ICE BofA U.S. Convertibles Index
The ICE BofA U.S. Convertibles Index is a widely used,
unmanaged index that measures the performance of U.S. dollar-denominated convertible securities not currently in bankruptcy with a total market value greater than $50 million at issuance. Its returns do not reflect any fees, expenses, or sales
charges, and it is not available for direct investment.
ICE BofA U.S. High Yield Index
The ICE BofA U.S. High Yield Index is market capitalization
weighted and is designed to measure the performance of U.S. dollar denominated below investment grade (commonly referred to as “junk”) corporate debt publicly issued in the U.S. domestic market. Its returns do not reflect any fees,
expenses, or sales charges, and it is not available for direct investment.
ICE BofA U.S. High Yield Institutional Capital Securities
Index (“HIPS”)
HIPS tracks the performance of
U.S. dollar denominated investment grade hybrid capital corporate and preferred securities publicly issues in the U.S. domestic market.
Leveraged Loans
Leveraged loans (also known as bank, senior or floating-rate
loans) consists of below investment-grade credit quality loans that are arranged by banks and other financial institutions to help companies finance acquisitions, recapitalizations, or other highly leveraged transactions. Such loans may be
especially vulnerable to adverse changes in economic or market conditions, although they are senior in the capital structure which typically provides investors/lenders a degree of potential credit risk protection.
London Interbank Offered Rate (“LIBOR”)
A benchmark rate that some of the world’s leading banks
charge each other for short-term loans and that serves as the first step to calculating interest rates on various loans throughout the world.
VIRTUS STRATEGY
TRUST
KEY INVESTMENT TERMS (Unaudited) (Continued) September 30, 2021
Markit CDX® Emerging Markets Index (“CDX.EM”)
CDX.EM is composed of Sovereign issuers from Latin America,
Eastern Europe, the Middle East, Africa and Asia as published by Markit from time to time
Markit CDX® North American High Yield Index (“CDX.NA.HY”)
CDX.NA.HY is composed of 100 liquid North American entities
with high yield credit ratings as published by Markit® from time to time.
Markit CDX® North American Investment Grade Index (“CDX.NA.IG”)
CDX.NA.IG is comprised of one hundred twenty five (125) of the
most liquid North American entities with investment grade credit ratings as published by Markit® from time to time.
Mortgage-Backed Securities (“MBS”)
Mortgage-backed securities represent interests in pools of
underlying home loans bought from banks which issue them.
MSCI AC World Index (net)
The MSCI All Country (“AC”) World Index (net)
captures large and mid cap representation across Developed Markets and Emerging Markets countries. The index covers approximately 85% of the global investable equity opportunity set.
MSCI EAFE® Index (net)
The MSCI EAFE® (Europe, Australasia, Far East) Index (net) is a free float-adjusted market capitalization-weighted index that measures developed foreign market equity performance, excluding
the U.S. and Canada. The index is calculated on a total return basis with net dividends reinvested. The index is unmanaged, its returns do not reflect any fees, expenses, or sales charges, and it is not available for direct investment.
MSCI EAFE® Small Cap Index (net)
The MSCI EAFE® Small Cap Index is an equity index which captures small cap representation across Developed Markets countries around the world, excluding the US and Canada. With 2,376
constituents, the index covers approximately 14% of the free float adjusted market capitalization in each country.
MSCI Emerging Markets Index (net)
The MSCI Emerging Markets Index (net) is a free float-adjusted
market capitalization-weighted index designed to measure equity market performance in the global emerging markets. The index is calculated on a total return basis with net dividends reinvested. The index is unmanaged, its returns do not reflect any
fees, expenses, or sales charges, and it is not available for direct investment.
MSCI World ex USA Small Cap Index (net)
The MSCI World ex USA Small Cap Index captures small cap
representation across 22 of 23 Developed Markets (DM) countries (excluding the U.S.). With 2,574 constituents, the index covers approximately 14% of the free float-adjusted market capitalization in each country.
Payment-in-Kind Security (“PIK”)
A bond which pays interest in the form of additional bonds, or
preferred stock which pays dividends in the form of additional preferred stock.
Real Estate Investment Trust (“REIT”)
A publicly traded company that owns, develops and operates
income-producing real estate such as apartments, office buildings, hotels, shopping centers and other commercial properties.
Russell 2000® Index
The Russell 2000® Index is a market capitalization-weighted index of the 2,000 smallest companies in the Russell Universe, which comprises the 3,000 largest U.S. companies. The index is
calculated on a total return basis with dividends reinvested. The index is unmanaged, its returns do not reflect any fees, expenses, or sales charges, and it is not available for direct investment.
S&P 500® Financials Index
The S&P 500® Financials Index comprises those companies included in the S&P 500 that are classified as members of the GICS financials sector.
S&P 500® Global Water Index
The S&P 500® Global Water Index is comprised of 50 of the largest publicly traded companies in water-related businesses that meet specific invest ability requirements. The Index is
designed to provide liquid exposure to the leading publicly-listed companies in the global water industry, from both developed markets and emerging markets.
S&P 500® Index
The S&P 500® Index is a free-float market capitalization-weighted index of 500 of the largest U.S. companies. The index is calculated on a total return basis with dividends reinvested.
The index is unmanaged, its returns do not reflect any fees, expenses, or sales charges, and it is not available for direct investment.
VIRTUS STRATEGY
TRUST
KEY INVESTMENT TERMS (Unaudited) (Continued) September 30, 2021
Secured Overnight Financing Rate (“SOFR”)
SOFR is a broad measure of the cost of borrowing cash overnight
collateralized by U.S. Treasury securities.
Sponsored
ADR
An ADR which is issued with the cooperation of the
company whose stock will underlie the ADR. Sponsored ADRs generally carry the same rights normally given to stockholders, such as voting rights. ADRs must be sponsored to be able to trade on a major U.S. exchange such as the New York Stock Exchange
(“NYSE”).
Tokyo Stock Price Index
(“TOPIX”)
Tokyo Stock Price Index is a
capitalization-weighted index of all companies listed on the First Section of the Tokyo Stock Exchange.
Treasury Inflation Protected Securities
(“TIPS”)
TIPS are a type of Treasury security
issued by the U.S. government. TIPS are indexed to inflation in order to protect investors from a decline in the purchasing power of their money.
| |
Ticker Symbols: |
| |
Class A :
ANZAX |
| |
Class C:
ANZCX |
| |
Class P:
ANCMX |
| |
Institutional
Class: ANNPX |
| |
Administrative Class:
ANNAX |
AllianzGI Convertible Fund Fund Summary (Unaudited)
Portfolio Manager Commentary by
Allianz Global Investors U.S. LLC
| ■
|
The Fund is
diversified and has an investment objective of seeking maximum total return, consisting of capital appreciation and current income. There is no guarantee that the Fund will meet its objective. |
| ■
|
For
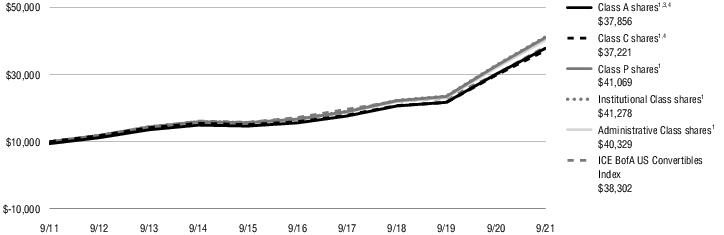
the fiscal year ended September 30, 2021, the Fund’s Class A shares at NAV returned 25.71%, Class C shares at NAV returned 24.75%, Class P shares at NAV returned 26.03%, Institutional Class shares at NAV returned 26.02%, and Administrative
Class shares at NAV returned 25.76%†. For the same period, the ICE BofA U.S. Convertibles Index, the Fund’s style-specific benchmark appropriate for comparison,
returned 27.30%. |
† See footnote 5 on page 11.
All performance figures assume
reinvestment of distributions and exclude the effect of sales charges. Performance data quoted represents past results. Past performance is no guarantee of future results, and current performance may be higher or lower than the performance shown
above. Investment return and principal value will fluctuate so your shares, when redeemed, may be worth more or less than their original cost. Please visit Virtus.com for performance data current to the most recent month-end.
How did the markets perform during the Fund’s
fiscal year ended September 30, 2021?
The convertible bond market advanced for the
12-month period, with the ICE BofA U.S. Convertibles Index returning 27.30%. By way of comparison, the 10-year U.S. Treasury returned -6.22% and the S&P 500® Index
gained 30.00%.
Multiple factors influenced the
market during the 12-month period. Stronger-than-expected quarterly earnings results, a rapid economic recovery, ongoing accommodation by the U.S. Federal Reserve (the Fed), additional U.S. fiscal stimulus, and positive vaccine-related dynamics all
had a favorable impact on investor confidence. On the other hand, a confluence of macroeconomic risks late in the reporting period, including signs of inflation and higher interest rates, weighed on sentiment.
All sectors within the convertible bond market
finished higher. Materials, energy, and consumer discretionary were the top-performing sectors, while telecommunications, utilities, and health care were the bottom-performing sectors.
Below-investment-grade issuers outperformed
investment grade issuers.
Lastly, with $68
billion in convertible bond new issuance through September 2021, annual volume was on track to meet strategists’ upwardly revised targets.
What factors affected the Fund’s performance
during its fiscal year?
The Fund produced a
positive total return for the 12 months ended September 30, 2021.
The attribution for the period included several
positive performers from a variety of industries. The majority of the Fund’s issuers exceeded earnings expectations, which contributed to absolute performance during the period.
Sector allocations that helped relative performance
during the fiscal year included financials, utilities, and technology.
Sector allocations that hurt relative performance
during the 12-month period included consumer discretionary, energy, and transportation.
The preceding information is the opinion of
portfolio management only through the end of the period stated on the cover. Any such opinions are subject to change at any time based upon market or other conditions and should not be relied upon as investment advice. Past performance is no
guarantee of future results, and there is no guarantee that market forecasts will be realized.
Market Volatility:
Local, regional, or global events such as war, acts of terrorism, the spread of infectious illness or other public health issues, recessions, or other events could have a significant impact on the Fund and its investments, including hampering the
ability of the portfolio manager(s) to invest the Fund’s assets as intended.
Issuer Risk: The
Fund will be affected by factors specific to the issuers of securities and other instruments in which the Fund invests, including
actual or perceived changes in the financial condition or business
prospects of such issuers.
Convertible
Securities: A convertible security may be called for redemption at a time and price unfavorable to the Fund.
Interest Rate: The
values of debt instruments may rise or fall in response to changes in interest rates, and this risk may be enhanced for securities with longer maturities.
Counterparties:
There is risk that a party upon whom the portfolio relies to complete a transaction will default.
Credit Risk: If the
issuer of a debt instrument fails to pay interest or principal in a timely manner, or negative perceptions exist in the market of the issuer’s ability to make such payments, the price of the security may decline.
Prepayments/Calls:
If issuers prepay or call fixed rate obligations when interest rates fall, it may force the Fund to reinvest at lower interest rates.
Equity Securities:
The market price of equity securities may be adversely affected by financial market, industry, or issuer-specific events. Focus on a particular style or on small or medium-sized companies may enhance that
risk.
High Yield Fixed Income Securities: There is a greater risk of issuer default, less liquidity, and increased price volatility related to high yield securities than investment grade securities.
Prospectus: For
additional information on risks, please see the Fund’s prospectus.
Asset
Allocation
The
following table presents asset allocation within certain industries as a percentage of total investments as of September 30, 2021.
| Convertible
Bonds and Notes |
|
80%
|
| Internet
|
18%
|
|
| Software
|
15
|
|
| Healthcare-Products
|
5
|
|
| All
other Convertible Bonds and Notes |
42
|
|
| Convertible
Preferred Stocks |
|
15
|
| Short-Term
Investment |
|
5
|
| Total
|
|
100%
|
For information regarding the indexes and certain
investment terms, see the Key Investment Terms starting on page 6.
AllianzGI Convertible Fund
(Continued)
Average Annual Total Returns1 for periods ended 9/30/21
| |
|
1
Year |
5
Years |
10
Years |
| Class
A shares at NAV2 |
25.71 %
|
19.35%
|
14.89%
|
| Class
A shares at POP3,4 |
18.80
|
18.00
|
14.24
|
| Class
C shares at NAV2 and with CDSC4 |
24.75
|
18.47
|
14.05
|
| Class
P shares at NAV2 |
26.03
|
19.67
|
15.17
|
| Institutional
Class shares at NAV2 |
26.02
|
19.69
|
15.23
|
| Administrative
Class shares at NAV2 |
25.76
5 |
19.42
|
14.96
|
| ICE
BofA U.S. Convertibles Index |
27.30
|
17.37
|
14.37
|
| Fund
Expense Ratios6: Class A shares: Gross 1.06%, Net 0.96%; Class C shares: Gross 1.79%, Net 1.73%; Class P shares: Gross 0.82%, Net 0.71%;
Institutional Class shares: Gross 0.79%, Net 0.71%; Administrative Class Gross 1.00%, Net 0.93%. |
|
|
|
|
| All
returns represent past performance which is no guarantee of future results. Current performance may be higher or lower than the performance shown. The investment return and principal value of an investment will fluctuate so that an investor’s
shares, when redeemed, may be worth more or less than their original cost. The above table and graph below do not reflect the deduction of taxes that a shareholder would pay on fund distributions or the redemption of shares. Please visit Virtus.com
for performance data current to the most recent month-end. |
Growth of $10,000 for periods ended 9/30
This chart assumes an initial investment of $10,000
made on September 30, 2011, for Class A shares, Class C shares, Class P shares, Institutional Class shares, and Administrative Class shares including any applicable sales charges or fees. Performance assumes reinvestment of dividends and capital
gain distributions.
|
1 |
Total
returns are historical and include changes in share price and the reinvestment of both dividends and capital gain distributions. |
|
2 |
“NAV”
(Net Asset Value) total returns do not include the effect of any sales charge. |
|
3 |
“POP”
(Public Offering Price) total returns include the effect of the maximum front-end 5.50% sales charge. |
|
4 |
“CDSC”
(contingent deferred sales charge) is applied to redemptions of certain classes of shares that do not have a sales charge applied at the time of purchase. CDSC for certain redemptions of Class A shares made within 18 months of a finder’s fee
being paid and all Class C shares are 1% within the first year and 0% thereafter. |
|
5 |
Total
Return for the report period presented in the table differs from the return in the Financial Highlights. The total return presented in the above table is calculated based on the NAV at which shareholder transactions were processed. The total return
presented in the Financial Highlights section of the report is calculated in the same manner, but also takes into account certain adjustments that are necessary under generally accepted accounting principles required in the annual report and
semiannual report. |
|
6 |
The
expense ratios of the Fund are set forth according to the prospectus for the Fund effective February 1, 2021, as supplemented and revised, and may differ from the expense ratios disclosed in the Financial Highlights tables in this report. See the
Financial Highlights for more current expense ratios. Net Expense: Expenses reduced by a contractual expense limitation in effect through February 1, 2023. Gross Expense: Does not reflect the effect of the expense limitation. Expense ratios include
fees and expenses associated with any underlying funds. |
The index is unmanaged and not available for direct
investment; therefore, its performance does not reflect the expenses associated with active management of an actual portfolio.
For information regarding the indexes and certain investment terms,
see the Key Investment Terms starting on page 6.
| |
Ticker Symbols: |
| |
Class P:
ACKPX |
| |
Institutional
Class: ACKIX |
| |
Class R6:
ACOSX |
AllianzGI Core Plus Bond Fund Fund Summary (Unaudited)
Portfolio Manager Commentary by
Allianz Global Investors U.S. LLC
| ■
|
The Fund is
diversified and has an investment objective of seeking total return, consisting of current income and capital appreciation. There is no guarantee that the Fund will meet its objective. |
| ■
|
For
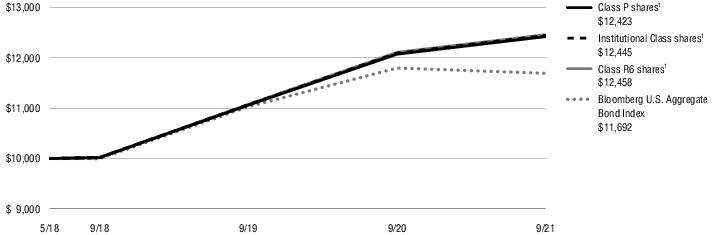
the fiscal year ended September 30, 2021, the Fund’s Class P shares at NAV returned 2.89%, Institutional Class shares at NAV returned 2.92%, and Class R6 shares at NAV returned 2.90%. For the same period, the Bloomberg U.S. Aggregate Bond
Index, the Fund’s style-specific benchmark appropriate for comparison, returned -0.90%. |
All performance figures assume
reinvestment of distributions and exclude the effect of sales charges. Performance data quoted represents past results. Past performance is no guarantee of future results, and current performance may be higher or lower than the performance shown
above. Investment return and principal value will fluctuate so your shares, when redeemed, may be worth more or less than their original cost. Please visit Virtus.com for performance data current to the most recent month-end.
How did the markets perform during the Fund’s
fiscal year ended September 30, 2021?
The market environment over the 12-month period was
dominated by the tightening of credit spreads (the additional yield an investor receives above the yield from a U.S. Treasury bond of the same duration), which resulted from the reopening of the economy following the onset of the pandemic. In
particular, the companies that were most severely affected by closures were the best performers for the reporting period. These “reopening” sectors included travel, airlines, hotels, air lessors, aircraft supply chain, and commercial
real estate, both office and retail.
Investment grade fixed income sectors such as
energy, subordinated financials, and airlines all benefitted from the reopening of global economies. The reopening both spurred economic activity and, importantly, reduced the risk premium attached to many of these sectors during a period of
uncertainty, resulting in significant outperformance. On the commodity side, soaring oil and gas prices were a boon for companies in the energy sector, including
the midstream sector where the Fund had most of its exposure.
What factors affected the Fund’s performance
during its fiscal year?
For the 12 months
ended September 30, 2021, the Fund outperformed its benchmark, the Bloomberg U.S. Aggregate Bond Index.
The Fund’s outperformance for the fiscal year
was driven more by sector selection than security selection. Sector performance was led by both investment grade credit, including preferred securities, as well as active repositioning in high yield credit and an underweight in agency
mortgage-backed securities. From a security selection standpoint, performance was led mostly by investment grade credit, including preferreds.
Overweights to investment grade sectors drove
positive returns for the fiscal year. The Fund also benefitted from the addition of a basket of “rising stars,” companies that we believe will be upgraded from the high yield market into the investment grade market in the next 12-18
months. In tandem with the economic recovery, rating agencies upgraded debt at a record pace, which caused particularly strong outperformance for these companies.
The Fund’s overweights in both the
high-quality AAA-rated asset-backed security (ABS) sector and the high-quality government sector underperformed the benchmark for the 12-month period, as riskier segments of the market dominated during the COVID-19 recovery. We maintained overweight
positions in both sectors given that these sectors usually yield higher than U.S. Treasuries with less exposure to additional liquidity risk. Both sectors performed relatively well during the final three months of the fiscal year as markets
normalized. The security selection overweight to Small Business Administration (SBA) loans within the government sector also performed poorly during the 12-month period for primarily the same reason.
The preceding information is the opinion of
portfolio management only through the end of the period stated on the cover. Any such opinions are subject to change at any time based upon market or other conditions and should not be relied upon as investment advice. Past performance is no
guarantee of future results, and there is no guarantee that market forecasts will be realized.
Market Volatility:
Local, regional, or global events such as war, acts of terrorism, the spread of infectious illness or other public health issues, recessions, or other events could have a significant impact on the Fund and its investments, including hampering the
ability of the portfolio manager(s) to invest the Fund’s assets as intended.
Debt Instruments:
Debt instruments are subject to greater levels of credit and liquidity risk, may be speculative and may decline in value due to changes in interest rates or an issuer’s or counterparty’s deterioration or default.
Interest Rate: The
values of debt instruments may rise or fall in response to changes in interest rates, and this risk may be enhanced for securities with longer maturities.
Variable Distribution Risk: Periodic distributions by investments of variable or floating interest rates vary with fluctuations in market interest rates.
ABS/MBS: Changes in
interest rates can cause both extension and prepayment risks for asset- and mortgage-backed securities. These securities are also subject to risks associated with the non-repayment of underlying collateral, including losses to the Fund.
High Yield Fixed Income Securities: There is a greater risk of issuer default, less liquidity, and increased price volatility related to high yield securities than investment grade securities.
Derivatives:
Investments in derivatives such as futures, options, forwards, and swaps may increase volatility or cause a loss greater than the principal investment.
Leverage: When a
fund is leveraged, the value of its securities may be more volatile and all other risks may be compounded.
Prospectus: For
additional information on risks, please see the Fund’s prospectus.
For information regarding the indexes and certain
investment terms, see the Key Investment Terms starting on page 6.
AllianzGI Core Plus Bond Fund
(Continued)
Asset
Allocation
The
following table presents asset allocation within certain sectors as a percentage of total investments as of September 30, 2021.
| Corporate
Bonds and Notes |
|
39%
|
| Financials
|
9%
|
|
| Utilities
|
5
|
|
| Communications
|
5
|
|
| All
other Corporate Bonds and Notes |
20
|
|
| Asset-Backed
Securities |
|
29
|
| Mortgage-Backed
Securities |
|
15
|
| U.S.
Government Securities |
|
14
|
| Short-Term
Investment |
|
2
|
| Preferred
Stocks |
|
1
|
| Total
|
|
100%
|
For information regarding the indexes and certain
investment terms, see the Key Investment Terms starting on page 6.
AllianzGI Core Plus Bond Fund
(Continued)
Average Annual Total Returns1 for periods ended 9/30/21
| |
|
1
Year |
Since
inception |
Inception
date |
| Class
P shares at NAV2 |
|
2.89 %
|
6.71 %
|
5/30/18
|
| Institutional
Class shares at NAV2 |
|
2.92
|
6.77
|
5/30/18
|
| Class
R6 shares at NAV2 |
|
2.90
|
6.80
|
5/30/18
|
| Bloomberg
U.S. Aggregate Bond Index |
|
-0.90
|
4.79
3 |
—
|
| Fund
Expense Ratios4: Class P shares: Gross 0.76%, Net 0.35%; Institutional
Class shares: Gross 0.76%, Net 0.30%; Class R6 shares: Gross 0.76%, Net 0.25%. |
|
|
|
|
| All
returns represent past performance which is no guarantee of future results. Current performance may be higher or lower than the performance shown. The investment return and principal value of an investment will fluctuate so that an investor’s
shares, when redeemed, may be worth more or less than their original cost. The above table and graph below do not reflect the deduction of taxes that a shareholder would pay on fund distributions or the redemption of shares. Please visit Virtus.com
for performance data current to the most recent month-end. |
Growth of $10,000 for periods ended 9/30
This chart assumes an initial investment of $10,000
made on September 30, 2018 (inception date of the Fund), for Class P shares, Institutional Class shares, and Class R6 shares including any applicable sales charges or fees. Performance assumes reinvestment of dividends and capital gain
distributions.
|
1 |
Total
returns are historical and include changes in share price and the reinvestment of both dividends and capital gain distributions. |
|
2 |
“NAV”
(Net Asset Value) total returns do not include the effect of any sales charge. |
|
3 |
The
since inception index return is from the Fund’s inception date. |
|
4 |
The
expense ratios of the Fund are set forth according to the prospectus for the Fund effective February 1, 2021, as supplemented and revised, and may differ from the expense ratios disclosed in the Financial Highlights tables in this report. See the
Financial Highlights for more current expense ratios. Net Expense: Expenses reduced by a contractual expense limitation in effect through February 1, 2023. Gross Expense: Does not reflect the effect of the expense limitation. Expense ratios include
fees and expenses associated with any underlying funds. |
The index is unmanaged and not available for direct
investment; therefore, its performance does not reflect the expenses associated with active management of an actual portfolio.
For information regarding the indexes and certain investment terms,
see the Key Investment Terms starting on page 6.
| |
Ticker Symbols: |
| |
Class A :
AMMAX |
| |
Institutional
Class: AERIX |
AllianzGI Emerging Markets Consumer Fund Fund Summary (Unaudited)
Portfolio Manager Commentary by
Allianz Global Investors U.S. LLC
| ■
|
The Fund is
diversified and has an investment objective of seeking long-term capital appreciation. There is no guarantee that the Fund will meet its objective. |
| ■
|
For
the fiscal year ended September 30, 2021, the Fund’s Class A shares at NAV returned 6.30%, and Institutional Class shares at NAV returned 6.63%. For the same period, the MSCI Emerging Markets Index (net), the Fund’s style-specific
benchmark appropriate for comparison, returned 18.20%. |
All performance figures assume
reinvestment of distributions and exclude the effect of sales charges. Performance data quoted represents past results. Past performance is no guarantee of future results, and current performance may be higher or lower than the performance shown
above. Investment return and principal value will fluctuate so your shares, when redeemed, may be worth more or less than their original cost. Please visit Virtus.com for performance data current to the most recent month-end.
How did the markets perform during the Fund’s
fiscal year ended September 30, 2021?
Emerging markets (EM) equities advanced during the
reporting period as the asset class rebounded thanks to improving sentiment and higher global growth expectations.
Favorable COVID-19 vaccine news and optimism over
the outlook for a global economic recovery initially propelled EM stocks higher, leading to an outperformance of deep value and economically sensitive stocks, which stood to benefit from rising inflation trends. This tailwind translated to positive
results in the asset class for the initial five months of the reporting period, with the MSCI Emerging Markets Index (net) reaching an all-time high in February of 2021. Performance was mixed in the latter half of the reporting period due primarily
to developments in China, where regulatory crackdowns and signs of slowing economic activity impacted results. Concerns that the U.S. Federal Reserve (the Fed) was getting closer to raising interest rates weighed on market prospects, and several EM
central banks raised rates to combat increasing inflationary pressures. The asset class underperformed in July of 2021 due to a crackdown
on the education sector in China and rising COVID-19 cases across
many Asian countries. EM equities also lagged in September 2021 due to concerns around the potential default of a major Chinese homebuilder, which investors feared could have ripple effects for other areas of the market.
At a regional level, Eastern European stocks soared,
with Russian equities among the strongest performers, helped by higher oil prices and an appreciation in the Russian ruble. Latin American markets outperformed the broader EM index as Mexican shares surged, helped in part by higher oil prices as
well as hopes that the new U.S. administration would be less aggressive on trade and immigration. Brazilian stocks also rallied sharply initially as hopes of a global economic recovery lifted the outlook for oil and industrial metals prices.
Meanwhile, Asian equities were impacted by regulatory announcements in China, while in contrast India advanced thanks to upbeat corporate earnings and the announcement of a pro-growth budget.
Sector performance for the benchmark index was
divergent, with nine out of 11 sectors advancing. More economically sensitive segments of the market rallied significantly, led by strong gains in materials, energy, information technology, and utilities. In contrast, consumer discretionary stocks
posted a double-digit decline due to weakness in key education and internet retailers within China, followed by more modest losses in the real estate sector.
What factors affected the Fund’s performance
during its fiscal year?
The Fund seeks to
capitalize on the long-term growth of the local emerging markets consumer, while limiting other risks including country and market capitalization. The Fund trailed its benchmark, the MSCI Emerging Markets Index (net), due to meaningful asset
allocation headwinds.
During the reporting
period, bottom-up stock selection was neutral relative to the benchmark, however, underperformance was attributable to the inability to own select non-consumer segments. Specifically, the Fund’s avoidance of semiconductors, energy, and
materials hurt performance during the reporting period given the increased demand for computer chips, oil & gas, and metals & mining companies. However, more conservative stock selection in communication
services and consumer staples offset results modestly.
Positive bottom-up stock-picking in consumer
discretionary and financials contributed to relative performance during the reporting period. From a country standpoint, stock selection in China detracted, as did a relative underweight in India and the inability to own key oil and gas companies in
Russia. Conversely, an overweight allocation and positive stock-picking within South Korea contributed to results, as did the Fund’s investments in select EM-consumer-related companies based in Germany.
The preceding information is the opinion of
portfolio management only through the end of the period stated on the cover. Any such opinions are subject to change at any time based upon market or other conditions and should not be relied upon as investment advice. Past performance is no
guarantee of future results, and there is no guarantee that market forecasts will be realized.
Market Volatility:
Local, regional, or global events such as war, acts of terrorism, the spread of infectious illness or other public health issues, recessions, or other events could have a significant impact on the Fund and its investments, including hampering the
ability of the portfolio manager(s) to invest the Fund’s assets as intended.
Issuer Risk: The
Fund will be affected by factors specific to the issuers of securities and other instruments in which the Fund invests, including actual or perceived changes in the financial condition or business prospects of such issuers.
Equity Securities:
The market price of equity securities may be adversely affected by financial market, industry, or issuer-specific events. Focus on a particular style or on small or medium-sized companies may enhance that risk.
Foreign & Emerging Markets: Investing in foreign securities, especially in emerging markets, subjects the portfolio to additional risks such as increased volatility, currency fluctuations, less liquidity, and political, regulatory, economic, and
market risk.
Focused Investments: To the extent the Portfolio focuses its investments on a limited number of issuers, sectors, industries or geographic regions, it may be subject to increased risk and volatility.
For information regarding the indexes and certain
investment terms, see the Key Investment Terms starting on page 6.
AllianzGI Emerging Markets
Consumer Fund (Continued)
Prospectus: For
additional information on risks, please see the Fund’s prospectus.
Asset
Allocation
The
following table presents asset allocation within certain industries as a percentage of total investments as of September 30, 2021.
| Banks
|
16%
|
| Technology
Hardware, Storage & Peripherals |
12
|
| Insurance
|
11
|
| Internet
& Direct Marketing Retail |
8
|
| Textiles,
Apparel & Luxury Goods |
7
|
| Interactive
Media & Services |
6
|
| Automobiles
|
5
|
| Life
Sciences Tools & Services |
5
|
| Beverages
|
4
|
| Wireless
Telecommunication Services |
3
|
| Other
(includes short-term investment) |
23
|
| Total
|
100%
|
For information regarding the indexes and certain
investment terms, see the Key Investment Terms starting on page 6.
AllianzGI Emerging Markets
Consumer Fund (Continued)
Average Annual Total Returns1 for periods ended 9/30/21
| |
|
1
Year |
5
Years |
Since
inception |
Inception
date |
| Class
A shares at NAV2 |
|
6.30 %
|
5.96 %
|
2.92 %
|
12/1/14
|
| Class
A shares at POP3,4 |
|
0.45
|
4.77
|
2.07
|
12/1/14
|
| Institutional
Class shares at NAV2 |
|
6.63
|
6.33
|
3.28
|
12/1/14
|
| MSCI
Emerging Markets Index (net) |
|
18.20
|
9.23
|
6.04
5 |
—
|
| Fund
Expense Ratios6: Class A shares: Gross 1.95%, Net 1.40%; Institutional
Class: Gross 1.67%, Net 1.05%. |
|
|
|
|
|
| All
returns represent past performance which is no guarantee of future results. Current performance may be higher or lower than the performance shown. The investment return and principal value of an investment will fluctuate so that an investor’s
shares, when redeemed, may be worth more or less than their original cost. The above table and graph below do not reflect the deduction of taxes that a shareholder would pay on fund distributions or the redemption of shares. Please visit Virtus.com
for performance data current to the most recent month-end. |
Growth of $10,000 for periods ended 9/30
This chart assumes an initial investment of $10,000
made on December 1, 2014 (inception date of the Fund), for Class A shares, and Institutional Class shares including any applicable sales charges or fees. Performance assumes reinvestment of dividends and capital gain distributions.
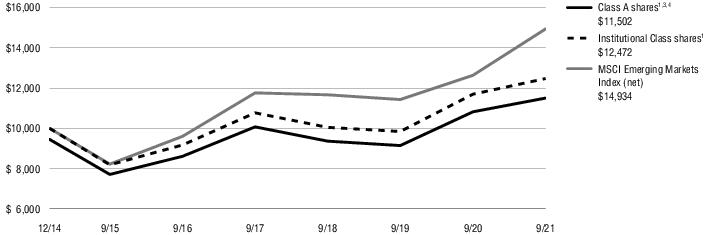
|
1 |
Total
returns are historical and include changes in share price and the reinvestment of both dividends and capital gain distributions. |
|
2 |
“NAV”
(Net Asset Value) total returns do not include the effect of any sales charge. |
|
3 |
“POP”
(Public Offering Price) total returns include the effect of the maximum front-end 5.50% sales charge. |
|
4 |
“CDSC”
(contingent deferred sales charge) is applied to redemptions of certain classes of shares that do not have a sales charge applied at the time of purchase. CDSC for certain redemptions of Class A shares made within 18 months of a finder’s fee
being paid and all Class C shares are 1% within the first year and 0% thereafter. |
|
5 |
The
since inception index return is from the Fund’s inception date. |
|
6 |
The
expense ratios of the Fund are set forth according to the prospectus for the Fund effective February 1, 2021, as supplemented and revised, and may differ from the expense ratios disclosed in the Financial Highlights tables in this report. See the
Financial Highlights for more current expense ratios. Net Expense: Expenses reduced by a contractual expense limitation in effect through February 1, 2023. Gross Expense: Does not reflect the effect of the expense limitation. Expense ratios include
fees and expenses associated with any underlying funds. |
The index is unmanaged and not available for direct
investment; therefore, its performance does not reflect the expenses associated with active management of an actual portfolio.
For information regarding the indexes and certain investment terms,
see the Key Investment Terms starting on page 6.
| |
Ticker Symbols: |
| |
Class A :
PALAX |
| |
Class C:
PALCX |
| |
Class P:
AGAPX |
| |
Institutional
Class: PALLX |
| |
Class R6:
AGASX |
| |
Administrative Class:
AGAMX |
AllianzGI Global Allocation Fund Fund Summary (Unaudited)
Portfolio Manager Commentary by
Allianz Global Investors U.S. LLC
| ■
|
The Fund is
diversified and has an investment objective of seeking after-inflation capital appreciation and current income. There is no guarantee that the Fund will meet its objectives. |
| ■
|
For
the fiscal year ended September 30, 2021, the Fund’s Class A shares at NAV returned 15.16%, Class C shares at NAV returned 14.29%, Class P shares at NAV returned 15.30%, Institutional Class shares at NAV returned 15.46%, Class R6 shares at
NAV returned 15.46%, and Administrative Class shares at NAV returned 16.73%. For the same period, the 60% MSCI AC World Index (net) / 40% Bloomberg U.S. Aggregate Bond Index, the Fund’s style-specific benchmark appropriate for comparison,
returned 15.52%, Bloomberg U.S. Aggregate Bond Index and MSCI AC World Index (net), both broad-based indexes, returned -0.90%, and 27.44%, respectively. |
All performance figures assume
reinvestment of distributions and exclude the effect of sales charges. Performance data quoted represents past results. Past performance is no guarantee of future results, and current performance may be higher or lower than the performance shown
above. Investment return and principal value will fluctuate so your shares, when redeemed, may be worth more or less than their original cost. Please visit Virtus.com for performance data current to the most recent month-end.
How did the markets perform during the Fund’s
fiscal year ended September 30, 2021?
For the 12-month period ended September 30, 2021,
global equity markets surged, with many western markets reaching new highs in early September of 2021. The rally began in November of 2020, following news that COVID-19 vaccines under development had far higher efficacy rates than expected. Joe
Biden’s victory in the U.S. presidential election also lifted expectations of massive fiscal stimulus to support the world’s largest economy. As COVID-19 vaccination campaigns picked up speed in 2021, there was growing optimism about a
swift global economic recovery from the pandemic. Robust corporate earnings growth further buoyed global stocks.
Global government bonds sold off as rising inflation
led to speculation that central banks would soon start to taper their bond-buying programs and consider raising interest rates. U.S. bond yields rose the most, with the yield on the 10-year Treasury rising 0.85% over the 12 months, while U.K. and
Australian government bond yields increased 0.70%. Bond yields also rose in the eurozone, although more modestly. Corporate bonds outperformed sovereign debt, with high yield bonds recording the strongest returns.
What factors affected the Fund’s performance
during its fiscal year?
For the 12 months
ended September 30, 2021, the Fund performed roughly in line with its blended benchmark (60% MSCI AC World Index (net) / 40% Bloomberg U.S. Aggregate Bond Index).
Top contributors to results included exposures in
the Diversifying Trend Overlay strategy, which takes active positions across a diversified universe of asset classes, and the Fund’s long exposure to global equities, which was maintained throughout most of the reporting period. Also in the
diversifying segment of the Fund were clean energy-oriented exposures, which contributed to results for the full fiscal year, despite giving back some performance in the final quarter. In the fixed income segment of the Fund, security selection
within sustainably oriented fixed income exposures, including green bonds, also contributed.
Conversely, detractors for the period stemmed from
security selection in the Fund’s core equity exposures. Within equities, the Global Sustainability strategy trailed its global equity benchmark, the MSCI All Country World Index (net), for the period, although it made back much of the relative
performance toward the end of the period. Additionally, exposure to lower volatility equities trailed traditional indexes, as equities with higher volatility generally outperformed during the period.
The preceding information is the opinion of
portfolio management only through the end of the period stated on the cover. Any such opinions are subject to change at any time based upon market or other conditions and should not be relied upon as investment advice. Past performance is no
guarantee of future results, and there is no guarantee that market forecasts will be realized.
Allocation: The
Fund’s exposure to different asset classes may not be optimal for market conditions at a given time. Asset allocation does not guarantee a profit or protect against a loss in declining markets.
Market Volatility:
Local, regional, or global events such as war, acts of terrorism, the spread of infectious illness or other public health issues, recessions, or other events could have a significant impact on the Fund and its investments, including hampering the
ability of the portfolio manager(s) to invest the Fund’s assets as intended.
Issuer Risk: The
Fund will be affected by factors specific to the issuers of securities and other instruments in which the Fund invests, including actual or perceived changes in the financial condition or business prospects of such issuers.
Sustainable Investing: Because the Fund focuses on investments in companies that the Manager believes exhibit strong environmental, social, and corporate governance records, the Fund’s universe of investments may be smaller than that of
other funds and broad equity benchmark indices.
Underlying Fund
Risk: The Fund will be indirectly affected by factors, risks and performance specific to any other fund in which it invests.
Equity Securities:
The market price of equity securities may be adversely affected by financial market, industry, or issuer-specific events. Focus on a particular style or on small or medium-sized companies may enhance that risk.
Debt Instruments:
Debt instruments are subject to greater levels of credit and liquidity risk, may be speculative and may decline in value due to changes in interest rates or an issuer’s or counterparty’s deterioration or default.
Interest Rate: The
values of debt instruments may rise or fall in response to changes in interest rates, and this risk may be enhanced for securities with longer maturities.
Derivatives:
Investments in derivatives such as futures, options, forwards, and swaps may increase volatility or cause a loss greater than the principal investment.
Prospectus: For
additional information on risks, please see the Fund’s prospectus.
For information regarding the indexes and certain
investment terms, see the Key Investment Terms starting on page 6.
AllianzGI Global Allocation
Fund (Continued)
Asset
Allocation
The
following table presents asset allocation within certain industries as a percentage of total investments as of September 30, 2021.
| Affiliated
Mutual Fund |
|
34%
|
| Corporate
Bonds and Notes |
|
15
|
| Banks
|
3%
|
|
| Electric
Utilities |
3
|
|
| Insurance
|
1
|
|
| All
other Corporate Bonds and Notes |
8
|
|
| Common
Stocks |
|
14
|
| Pharmaceuticals
|
1
|
|
| Diversified
Telecommunication Services |
1
|
|
| Electric
Utilities |
1
|
|
| All
other Common Stocks |
11
|
|
| Exchange-Traded
Funds |
|
11
|
| Mortgage-Backed
Securities |
|
9
|
| U.S.
Government Securities |
|
7
|
| Asset-Backed
Securities |
|
7
|
| Other
(includes short-term investment) |
|
3
|
| Total
|
|
100%
|
For information regarding the indexes and certain
investment terms, see the Key Investment Terms starting on page 6.
AllianzGI Global Allocation Fund
(Continued)
Average Annual Total Returns1 for periods ended 9/30/21
| |
|
1
Year |
5
Years |
10
Years |
Since
inception |
Inception
date |
| Class
A shares at NAV2 |
|
15.16 %
|
8.47 %
|
7.66 %
|
— %
|
—
|
| Class
A shares at POP3,4 |
|
8.83
|
7.25
|
7.05
|
—
|
—
|
| Class
C shares at NAV2 and with CDSC4 |
|
14.29
|
7.66
|
6.86
|
—
|
—
|
| Class
P shares at NAV2 |
|
15.30
|
8.73
|
7.91
|
—
|
—
|
| Institutional
Class shares at NAV2 |
|
15.46
|
8.73
|
7.92
|
—
|
—
|
| Class
R6 shares at NAV2 |
|
15.46
|
8.83
|
—
|
8.19
|
9/8/15
|
| Administrative
Class shares at NAV2 |
|
16.73
|
8.85
|
7.84
|
—
|
—
|
| 60%
MSCI AC World Index (net) / 40% Bloomberg U.S. Aggregate Bond Index |
|
15.52
|
9.27
|
8.51
|
8.99
5 |
—
|
| MSCI
AC World Index (net) |
|
27.44
|
13.20
|
11.90
|
12.40
5 |
—
|
| Bloomberg
U.S. Aggregate Bond Index |
|
-0.90
|
2.94
|
3.01
|
3.38
5 |
—
|
| Fund
Expense Ratios6: Class A shares: Gross 1.64%, Net 0.91%; Class C
shares: Gross 2.37%, Net 1.66%; Class P shares: Gross 1.43%, Net 0.71%; Institutional Class shares: Gross 1.39%, Net 0.68%; Class R6 shares: Gross 1.34%, Net 0.61%; Administrative Class shares: Gross 1.59%, Net 0.86%. |
|
|
|
|
|
|
| All
returns represent past performance which is no guarantee of future results. Current performance may be higher or lower than the performance shown. The investment return and principal value of an investment will fluctuate so that an investor’s
shares, when redeemed, may be worth more or less than their original cost. The above table and graph below do not reflect the deduction of taxes that a shareholder would pay on fund distributions or the redemption of shares. Please visit Virtus.com
for performance data current to the most recent month-end. |
Growth of $10,000 for periods ended 9/30
This chart assumes an initial investment of $10,000
made on September 30, 2011, for Class A shares, Class C shares, Class P shares, Institutional Class shares, and Administrative Class shares including any applicable sales charges or fees. The performance of the other share class may be greater or
less than that shown based on differences in inception dates, fees, and sales charges. Performance assumes reinvestment of dividends and capital gain distributions.
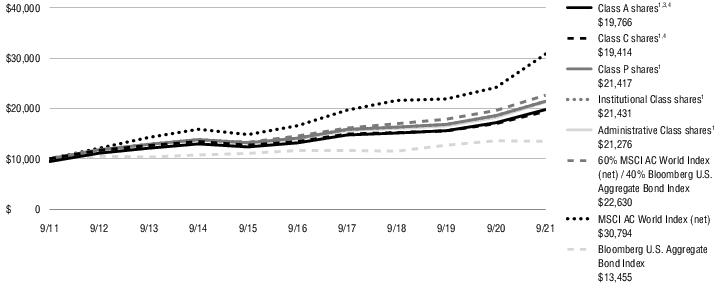
|
1 |
Total
returns are historical and include changes in share price and the reinvestment of both dividends and capital gain distributions. |
|
2 |
“NAV”
(Net Asset Value) total returns do not include the effect of any sales charge. |
|
3 |
“POP”
(Public Offering Price) total returns include the effect of the maximum front-end 5.50% sales charge. |
|
4 |
“CDSC”
(contingent deferred sales charge) is applied to redemptions of certain classes of shares that do not have a sales charge applied at the time of purchase. CDSC for certain redemptions of Class A shares made within 18 months of a finder’s fee
being paid and all Class C shares are 1% within the first year and 0% thereafter. |
|
5 |
The
since inception index return is from the inception date of Class R6 shares. |
For information regarding the indexes and certain investment terms,
see the Key Investment Terms starting on page 6.
AllianzGI Global Allocation Fund
(Continued)
|
6 |
The
expense ratios of the Fund are set forth according to the prospectus for the Fund effective February 1, 2021, as supplemented and revised, and may differ from the expense ratios disclosed in the Financial Highlights tables in this report. See the
Financial Highlights for more current expense ratios. Net Expense: Expenses reduced by a contractual expense limitation in effect through February 1, 2023. Gross Expense: Does not reflect the effect of the expense limitation. Expense ratios include
fees and expenses associated with any underlying funds. |
The indexes are unmanaged and not available for
direct investment; therefore, their performance does not reflect the expenses associated with active management of an actual portfolio.
For information regarding the indexes and certain investment terms,
see the Key Investment Terms starting on page 6.
| |
Ticker Symbols: |
| |
Class A :
ASGAX |
| |
Class C:
ASACX |
| |
Class P:
AGSPX |
| |
Institutional
Class: AGAIX |
| |
Class R6:
ADYFX |
| |
Administrative Class:
AGFAX |
AllianzGI Global Dynamic Allocation Fund Fund Summary (Unaudited)
Portfolio Manager Commentary by
Allianz Global Investors U.S. LLC
| ■
|
The Fund is
diversified and has an investment objective of seeking long-term capital appreciation. There is no guarantee that the Fund will meet its objective. |
| ■
|
For
the fiscal year ended September 30, 2021, the Fund’s Class A shares at NAV returned 25.22%, Class C shares at NAV returned 24.29%, Class P shares at NAV returned
25.38%†, Institutional Class shares at NAV returned 25.59%, Class R6 shares at NAV returned
25.54%†, and Administrative Class shares at NAV returned 25.27%. For the same period, the 60% MSCI AC World Index (net) / 40% Bloomberg U.S. Aggregate Bond Index, the
Fund’s style-specific benchmark appropriate for comparison, returned 15.52%, Bloomberg U.S. Aggregate Bond Index and MSCI AC World Index (net), both broad-based indexes, returned -0.90%, and 27.44%, respectively. |
† See footnote 5 on page 25.
All performance figures assume
reinvestment of distributions and exclude the effect of sales charges. Performance data quoted represents past results. Past performance is no guarantee of future results, and current performance may be higher or lower than the performance shown
above. Investment return and principal value will fluctuate so your shares, when redeemed, may be worth more or less than their original cost. Please visit Virtus.com for performance data current to the most recent month-end.
How did the markets perform during the Fund’s
fiscal year ended September 30, 2021?
For the 12-month period ended September 30, 2021,
global equity markets surged, with many western markets reaching new highs in early September of 2021. The rally began in November of 2020, following news that COVID-19 vaccines under development had far higher efficacy rates than expected. Joe
Biden’s victory in the U.S. presidential election also lifted expectations of massive fiscal stimulus to support the world’s largest economy. As COVID-19 vaccination campaigns picked up speed in 2021, there was growing optimism about a
swift global economic recovery from the pandemic.
Robust corporate earnings growth further buoyed global
stocks.
Global government bonds sold off as
rising inflation led to speculation that central banks would soon start to taper their bond-buying programs and consider raising interest rates. U.S. bond yields rose the most, with the yield on the 10-year Treasury rising 0.85% over the 12 months,
while U.K. and Australian government bond yields increased 0.70%. Bond yields also rose in the eurozone, although more modestly. Corporate bonds outperformed sovereign debt, with high yield bonds recording the strongest returns.
What factors affected the Fund’s performance
during its fiscal year?
For the 12 months
ended September 30, 2021, the Fund notably outperformed its blended benchmark (60% MSCI AC World Index (net) / 40% Bloomberg U.S. Aggregate Bond Index).
For the fiscal year, the Fund benefited from its
overweight to global equities, with U.S. and European equity overweight positions providing the most significant contributions to performance. In addition to the favorable allocation effects, a tilt toward value-oriented U.S. equities and companies
perceived as being more sensitive to the reopening of the U.S. economy also contributed to relative performance.
In the Fund’s fixed income portfolio, an
overweight to credits, as well as security selection within credits, were top contributors. Within U.S. government bonds, an underweight to U.S. Treasuries and an overweight to U.S. TIPS (Treasury inflation-protected securities) also contributed
positively to performance for the period. Conversely, in the opportunistic portion of the Fund, exposure to government bonds outside the U.S. moderately detracted from results as rates rose, particularly toward the end of the 12-month period.
The preceding information is the opinion of
portfolio management only through the end of the period stated on the cover. Any such opinions are subject to change at any time based upon market or other conditions and should not be relied upon as investment advice. Past performance is no
guarantee of future results, and there is no guarantee that market forecasts will be realized.
Allocation: The
Fund’s exposure to different asset classes may not be optimal for market conditions at a given time. Asset allocation does not guarantee a profit or protect against a loss in declining markets.
Market Volatility:
Local, regional, or global events such as war, acts of terrorism, the spread of infectious illness or other public health issues, recessions, or other events could have a significant impact on the Fund and its
investments, including hampering the ability of the portfolio manager(s) to invest the Fund’s assets as intended.
Issuer Risk: The
Fund will be affected by factors specific to the issuers of securities and other instruments in which the Fund invests, including actual or perceived changes in the financial condition or business prospects of such issuers.
Equity Securities:
The market price of equity securities may be adversely affected by financial market, industry, or issuer-specific events. Focus on a particular style or on small or medium-sized companies may enhance that risk.
Debt Instruments:
Debt instruments are subject to greater levels of credit and liquidity risk, may be speculative and may decline in value due to changes in interest rates or an issuer’s or counterparty’s deterioration or default.
Interest Rate: The
values of debt instruments may rise or fall in response to changes in interest rates, and this risk may be enhanced for securities with longer maturities.
Derivatives:
Investments in derivatives such as futures, options, forwards, and swaps may increase volatility or cause a loss greater than the principal investment.
Prepayments/Calls:
If issuers prepay or call fixed rate obligations when interest rates fall, it may force the Fund to reinvest at lower interest rates.
Prospectus: For
additional information on risks, please see the Fund’s prospectus.
For information regarding the indexes and certain
investment terms, see the Key Investment Terms starting on page 6.
AllianzGI Global Dynamic
Allocation Fund (Continued)
Asset
Allocation
The
following table presents asset allocation within certain industries as a percentage of total investments as of September 30, 2021.
| Common
Stocks |
|
52%
|
| Software
|
3%
|
|
| Semiconductors
& Semiconductor Equipment |
3
|
|
| Real
Estate Management & Development |
2
|
|
| All
other Common Stocks |
44
|
|
| Short-Term
Investment |
|
25
|
| Corporate
Bonds and Notes |
|
17
|
| Banks
|
3
|
|
| Electric
Utilities |
2
|
|
| Insurance
|
2
|
|
| All
other Corporate Bonds and Notes |
10
|
|
| Foreign
Government Securities |
|
6
|
| Total
|
|
100%
|
For information regarding the indexes and certain
investment terms, see the Key Investment Terms starting on page 6.
AllianzGI Global Dynamic
Allocation Fund (Continued)
Average Annual Total Returns1 for periods ended 9/30/21
| |
|
1
Year |
5
Years |
10
Years |
Since
inception |
Inception
date |
| Class
A shares at NAV2 |
|
25.22 %
|
9.27 %
|
8.51 %
|
— %
|
—
|
| Class
A shares at POP3,4 |
|
18.33
|
8.04
|
7.90
|
—
|
—
|
| Class
C shares at NAV2 and with CDSC4 |
|
24.29
|
8.44
|
7.68
|
—
|
—
|
| Class
P shares at NAV2 |
|
25.38
5 |
9.72
|
8.82
|
—
|
—
|
| Institutional
Class shares at NAV2 |
|
25.59
|
9.57
|
8.80
|
—
|
—
|
| Class
R6 shares at NAV2 |
|
25.54
5 |
9.58
|
—
|
9.57
|
2/1/16
|
| Administrative
Class shares at NAV2 |
|
25.27
|
9.29
|
8.53
|
—
|
—
|
| 60%
MSCI AC World Index (net) / 40% Bloomberg U.S. Aggregate Bond Index |
|
15.52
|
9.27
|
8.51
|
9.93
6 |
—
|
| MSCI
AC World Index (net) |
|
27.44
|
13.20
|
11.90
|
14.02
6 |
—
|
| Bloomberg
U.S. Aggregate Bond Index |
|
-0.90
|
2.94
|
3.01
|
3.41
6 |
—
|
| Fund
Expense Ratios7: Class A shares: Gross 1.70%, Net 0.92%; Class C
shares: Gross 2.43%, Net 1.68%; Class P shares: Gross 1.46%, Net 0.78%; Institutional Class shares: Gross 1.47%, Net 0.64%; Class R6 shares: Gross 1.39%, Net 0.64%; Administrative Class shares: Gross 1.64%, Net 0.89%. |
|
|
|
|
|
|
| All
returns represent past performance which is no guarantee of future results. Current performance may be higher or lower than the performance shown. The investment return and principal value of an investment will fluctuate so that an investor’s
shares, when redeemed, may be worth more or less than their original cost. The above table and graph below do not reflect the deduction of taxes that a shareholder would pay on fund distributions or the redemption of shares. Please visit Virtus.com
for performance data current to the most recent month-end. |
Growth of $10,000 for periods ended 9/30
This chart assumes an initial investment of $10,000
made on September 30, 2011, for Class A shares, Class C shares, Class P shares, Institutional Class shares, and Administrative Class shares including any applicable sales charges or fees. The performance of the other share class may be greater or
less than that shown based on differences in inception dates, fees, and sales charges. Performance assumes reinvestment of dividends and capital gain distributions.

|
1 |
Total
returns are historical and include changes in share price and the reinvestment of both dividends and capital gain distributions. |
|
2 |
“NAV”
(Net Asset Value) total returns do not include the effect of any sales charge. |
|
3 |
“POP”
(Public Offering Price) total returns include the effect of the maximum front-end 5.50% sales charge. |
|
4 |
“CDSC”
(contingent deferred sales charge) is applied to redemptions of certain classes of shares that do not have a sales charge applied at the time of purchase. CDSC for certain redemptions of Class A shares made within 18 months of a finder’s fee
being paid and all Class C shares are 1% within the first year and 0% thereafter. |
For information regarding the indexes and certain investment terms,
see the Key Investment Terms starting on page 6.
AllianzGI Global Dynamic
Allocation Fund (Continued)
|
5 |
Total
Return for the report period presented in the table differs from the return in the Financial Highlights. The total return presented in the above table is calculated based on the NAV at which shareholder transactions were processed. The total return
presented in the Financial Highlights section of the report is calculated in the same manner, but also takes into account certain adjustments that are necessary under generally accepted accounting principles required in the annual report and
semiannual report. |
|
6 |
The
since inception index return is from the inception date of Class R6 shares. |
|
7 |
The
expense ratios of the Fund are set forth according to the prospectus for the Fund effective February 1, 2021, as supplemented and revised, and may differ from the expense ratios disclosed in the Financial Highlights tables in this report. See the
Financial Highlights for more current expense ratios. Net Expense: Expenses reduced by a contractual expense limitation in effect through February 1, 2023. Gross Expense: Does not reflect the effect of the expense limitation. Expense ratios include
fees and expenses associated with any underlying funds. |
The indexes are unmanaged and not available for
direct investment; therefore, their performance does not reflect the expenses associated with active management of an actual portfolio.
For information regarding the indexes and certain investment terms,
see the Key Investment Terms starting on page 6.
| |
Ticker Symbols: |
| |
Class A :
ASUAX |
| |
Class P:
ASTPX |
| |
Institutional
Class: ASTNX |
AllianzGI Global Sustainability Fund Fund Summary (Unaudited)
Portfolio Manager Commentary by
Allianz Global Investors U.S. LLC
| ■
|
The Fund is
diversified and has an investment objective of seeking long-term capital appreciation. There is no guarantee that the Fund will meet its objective. |
| ■
|
For
the fiscal year ended September 30, 2021, the Fund’s Class A shares at NAV returned 24.61%, Class P shares at NAV returned 24.78%, and Institutional Class shares at NAV returned 24.95%. For the same period, the MSCI AC World Index (net), the
Fund’s style-specific benchmark appropriate for comparison, returned 27.44% and Dow Jones Sustainability World Index (net), a broad-based index, returned 24.83%. |
All performance figures assume
reinvestment of distributions and exclude the effect of sales charges. Performance data quoted represents past results. Past performance is no guarantee of future results, and current performance may be higher or lower than the performance shown
above. Investment return and principal value will fluctuate so your shares, when redeemed, may be worth more or less than their original cost. Please visit Virtus.com for performance data current to the most recent month-end.
How did the markets perform during the Fund’s
fiscal year ended September 30, 2021?
For the 12-month period ended September 30, 2021,
global equity markets surged, with many western markets reaching new highs in early September of 2021. The rally began in November of 2020, following news that COVID-19 vaccines under development had far higher efficacy rates than expected. Joe
Biden’s victory in the U.S. presidential election also lifted expectations of massive fiscal stimulus to support the world’s largest economy. As COVID-19 vaccination campaigns picked up speed in 2021, there was growing optimism about a
swift global economic recovery from the pandemic. Robust corporate earnings growth further buoyed global stocks.
Every sector in the MSCI AC World Index rallied
during the fiscal year. Energy stocks soared as oil prices rallied sharply amid expectations of stronger demand. The financials sector was another leader, boosted by strengthening economic activity and higher long-term bond yields, which lifted
the
outlook for banks’ profit margins. While defensive sectors
such as consumer staples and utilities were among the weakest performers, they still recorded double-digit gains.
Economic news showed that the global economy was
recovering from the pandemic-related shock. However, as supply chain blockages and rising wages pushed inflation rates higher, speculation grew that central banks would soon start to taper their pandemic stimulus measures, raise interest rates, or
both. While rates rose in several markets, Group of Seven (G7) nations did not follow suit during the reporting period. In September of 2021, the U.S. Federal Reserve (the Fed) signalled that it might start to taper later in the year, and a greater
number of U.S. policymakers predicted that rates would rise in 2022. In the same month, the European Central Bank (ECB) decided to trim its monthly asset purchases, while the Bank of England indicated that it might soon raise rates to combat
inflation.
What factors affected the
Fund’s performance during its fiscal year?
The Fund underperformed its benchmark over the
fiscal year ended September 30, 2021. This was driven largely by the strong performance from more economically sensitive stocks with value characteristics. As a team, our preference is for quality companies that we believe offer sustainable earnings
growth at reasonable valuations. This focus on valuation is designed to ensure that the Fund retains a core positioning, albeit with a clear tilt toward growth characteristics.
The fourth quarter of 2020 and the start of 2021 saw
a clear trend, in which stocks whose revenues and earnings had all but ceased as a result of global lockdowns staged a sharp recovery following the discovery of a successful COVID-19 vaccine. Despite this reversal, more recently, supply chain
bottlenecks, an emerging energy crisis, and labor shortages stoked inflation fears. At the same time, growth expectations for the global economy were tempered. Combined with the prospect of tapering and monetary policy tightening, bond yields rose
sharply during the fiscal year. Some investors worried that this combination could lead to stagflation – a period of low to negative growth despite high inflation.
These conditions led to a pullback for growth
stocks, as well as more economically sensitive names.
Energy stocks were a rare bright spot. However, portfolio
construction designed to ensure that stock selection is the largest driver of returns continued to be the case, with picks in the communication services, health care, and industrials sectors making the largest positive contributions. Intuit, a
provider of online tax and accounting software, reported consistently strong quarterly results, with year-on-year revenue growth of 41%, and earnings before interest, taxes and depreciation (EBITDA) of 21%. Agilent, the analytical and measurement
company, also boosted returns thanks to strong earnings. Other strong performers included American Express (credit cards), Shell (energy), and Alphabet (the technology giant that owns Google, Youtube, and the Android operating system ).
Conversely, names in the financials and consumer
staples sectors detracted from the Fund’s performance. Adidas in particular weakened returns. Chinese President Xi’s regulatory onslaught focused not only on technology platforms but also excessive consumption. Plans to clamp down on
high incomes directly impacted the maker of sports apparel, which generates its fastest growth in the region. At the same time, rising COVID-19 infections in Vietnam caused by the Delta variant caused supply chain issues for Adidas. Given the
idiosyncratic and short-term nature of these issues, we saw no challenge to the longer-term investment thesis, and we continued to hold the stock. Consumer staples names including Reckit Benckiser and Unilever also detracted from performance, as did
SAP (a business software provider) and S&P Global (provider of financial data).
The preceding information is the opinion of
portfolio management only through the end of the period stated on the cover. Any such opinions are subject to change at any time based upon market or other conditions and should not be relied upon as investment advice. Past performance is no
guarantee of future results, and there is no guarantee that market forecasts will be realized.
Market Volatility:
Local, regional, or global events such as war, acts of terrorism, the spread of infectious illness or other public health issues, recessions, or other events could have a significant impact on the Fund and its investments, including hampering the
ability of the portfolio manager(s) to invest the Fund’s assets as intended.
For information regarding the indexes and certain
investment terms, see the Key Investment Terms starting on page 6.
AllianzGI Global Sustainability
Fund (Continued)
Issuer Risk: The Fund will be
affected by factors specific to the issuers of securities and other instruments in which the Fund invests, including actual or perceived changes in the financial condition or business prospects of such issuers.
Equity Securities:
The market price of equity securities may be adversely affected by financial market, industry, or issuer-specific events. Focus on a particular style or on small or medium-sized companies may enhance that risk.
Foreign Investing:
Investing in foreign securities subjects the portfolio to additional risks such as increased volatility, currency fluctuations, less liquidity, and political, regulatory, economic, and market risk.
Sustainable Investing: Because the Fund focuses on investments in companies that the Manager believes exhibit strong environmental, social, and corporate governance records, the Fund’s universe of investments may be smaller than that of
other funds and broad equity benchmark indices.
Prospectus: For additional
information on risks, please see the Fund’s prospectus.
Asset
Allocation
The
following table presents asset allocation within certain industries as a percentage of total investments as of September 30, 2021.
| Software
|
12%
|
| Pharmaceuticals
|
8
|
| Technology
Hardware, Storage & Peripherals |
7
|
| IT
Services |
7
|
| Capital
Markets |
5
|
| Insurance
|
5
|
| Interactive
Media & Services |
4
|
| Semiconductors
& Semiconductor Equipment |
4
|
| Building
Products |
4
|
| Machinery
|
4
|
| Other
(includes short-term investment) |
40
|
| Total
|
100%
|
For information regarding the indexes and certain
investment terms, see the Key Investment Terms starting on page 6.
AllianzGI Global Sustainability
Fund (Continued)
Average Annual Total Returns1 for periods ended 9/30/21
| |
|
1
Year |
5
Years |
Since
inception |
Inception
date |
| Class
A shares at NAV2 |
|
24.61 %
|
14.08 %
|
11.21 %
|
12/9/14
|
| Class
A shares at POP3,4 |
|
17.76
|
12.80
|
10.29
|
12/9/14
|
| Class
P shares at NAV2 |
|
24.78
|
14.25
|
11.37
|
12/9/14
|
| Institutional
Class shares at NAV2 |
|
24.95
|
14.35
|
11.47
|
12/9/14
|
| MSCI
AC World Index (net) |
|
27.44
|
13.20
|
10.06
5 |
—
|
| Dow
Jones Sustainability World Index (net) |
|
24.83
|
14.03
|
9.91
5 |
—
|
| Fund
Expense Ratios6: Class A shares: Gross 1.43%, Net 0.94%; Class P
shares: Gross 1.20%, Net 0.79%; Institutional Class shares: Gross 1.13%, Net 0.69%. |
|
|
|
|
|
| All
returns represent past performance which is no guarantee of future results. Current performance may be higher or lower than the performance shown. The investment return and principal value of an investment will fluctuate so that an investor’s
shares, when redeemed, may be worth more or less than their original cost. The above table and graph below do not reflect the deduction of taxes that a shareholder would pay on fund distributions or the redemption of shares. Please visit Virtus.com
for performance data current to the most recent month-end. |
Growth of $10,000 for periods ended 9/30
This chart assumes an initial investment of $10,000
made on December 9, 2014 (inception date of the Fund), for Class A shares, Class P shares, and Institutional Class shares including any applicable sales charges or fees. Performance assumes reinvestment of dividends and capital gain
distributions.
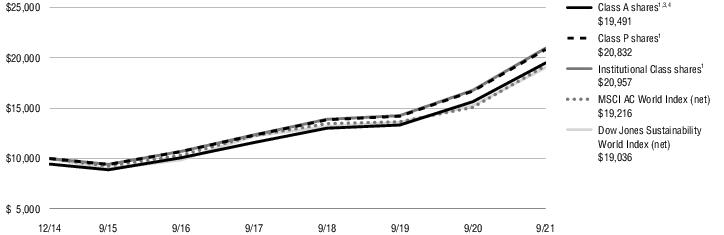
|
1 |
Total
returns are historical and include changes in share price and the reinvestment of both dividends and capital gain distributions. |
|
2 |
“NAV”
(Net Asset Value) total returns do not include the effect of any sales charge. |
|
3 |
“POP”
(Public Offering Price) total returns include the effect of the maximum front-end 5.50% sales charge. |
|
4 |
“CDSC”
(contingent deferred sales charge) is applied to redemptions of certain classes of shares that do not have a sales charge applied at the time of purchase. CDSC for certain redemptions of Class A shares made within 18 months of a finder’s fee
being paid and all Class C shares are 1% within the first year and 0% thereafter. |
|
5 |
The
since inception index return is from the Fund’s inception date. |
|
6 |
The
expense ratios of the Fund are set forth according to the prospectus for the Fund effective February 1, 2021, as supplemented and revised, and may differ from the expense ratios disclosed in the Financial Highlights tables in this report. See the
Financial Highlights for more current expense ratios. Net Expense: Expenses reduced by a contractual expense limitation in effect through February 1, 2023. Gross Expense: Does not reflect the effect of the expense limitation. Expense ratios include
fees and expenses associated with any underlying funds. |
The indexes are unmanaged and not available for
direct investment; therefore, their performance does not reflect the expenses associated with active management of an actual portfolio.
For information regarding the indexes and certain investment terms,
see the Key Investment Terms starting on page 6.
| |
Ticker Symbols: |
| |
Class A :
AYBAX |
| |
Class C:
AYBCX |
| |
Class P:
AYBPX |
| |
Institutional: AYBIX
|
| |
Administrative Class:
AYBVX |
AllianzGI High Yield Bond Fund Fund Summary (Unaudited)
Portfolio Manager Commentary by
Allianz Global Investors U.S. LLC
| ■
|
The Fund is
diversified and has an investment objective of seeking a high level of current income and capital growth. There is no guarantee that the Fund will meet its objectives. |
| ■
|
For
the fiscal year ended September 30, 2021, the Fund’s Class A shares at NAV returned 12.20%, Class C shares at NAV returned 11.32%, Class P shares at NAV returned 12.47%, Institutional Class shares at NAV returned 12.43%, and Administrative
Class shares at NAV returned 14.60%. For the same period, the ICE BofA U.S. High Yield Index, the Fund’s style-specific benchmark appropriate for comparison, returned 11.46%. |
All performance figures assume
reinvestment of distributions and exclude the effect of sales charges. Performance data quoted represents past results. Past performance is no guarantee of future results, and current performance may be higher or lower than the performance shown
above. Investment return and principal value will fluctuate so your shares, when redeemed, may be worth more or less than their original cost. Please visit Virtus.com for performance data current to the most recent month-end.
How did the markets perform during the Fund’s
fiscal year ended September 30, 2021?
High yield bonds produced a positive return for the
12-month period, with the ICE BofA U.S. High Yield Index returning 11.46%. By way of comparison, the 10-year U.S. Treasury returned -6.22%, and the S&P 500® Index
gained 30.00%.
Over the fiscal year, high
yield bond prices rose, yields fell, and credit spreads (the additional yield an investor receives above the risk-free rate) tightened against a backdrop of improving credit fundamentals, declining default rates, and a rising upgrade-to-downgrade
ratio.
All high yield bond industries advanced
for the period. Theaters & entertainment, printing &
publishing, and energy outperformed, while cable & satellite
TV, utilities, and telecom-wireless underperformed.
Performance dispersion among credit quality
categories widened over the 12-month period as the market recovery broadened and interest rates trended higher. For the period, issues rated BB, B, and CCC returned 9.7%, 10.0%, and 24.1%, respectively.
Lastly, high yield bond new issuance in 2021 was
robust as of the end of September, and was on track to surpass 2020’s annual record.
What factors affected the Fund’s performance
during its fiscal year?
The Fund produced a
positive total return for the fiscal year ended September 30, 2021, and delivered a high level of income over the same period.
Nearly all industries and most issues in the Fund
finished higher. The Fund’s underweight allocation to CCC-rated bonds, which outperformed higher-quality credits, had an adverse impact on relative performance.
Industry allocations that helped relative
performance during the period included financial services, theaters & entertainment, and air transportation.
Industry allocations that hurt relative performance
during the period included energy, support-services, and personal & household products.
The preceding information is the opinion of
portfolio management only through the end of the period stated on the cover. Any such opinions are subject to change at any time based upon market or other conditions and should not be relied upon as investment advice. Past performance is no
guarantee of future results, and there is no guarantee that market forecasts will be realized.
Market Volatility:
Local, regional, or global events such as war, acts of terrorism, the spread of infectious illness or other public health issues, recessions, or other events could have a significant
impact on the Fund and its investments, including hampering the
ability of the portfolio manager(s) to invest the Fund’s assets as intended.
Issuer Risk: The
Fund will be affected by factors specific to the issuers of securities and other instruments in which the Fund invests, including actual or perceived changes in the financial condition or business prospects of such issuers.
Interest Rate: The
values of debt instruments may rise or fall in response to changes in interest rates, and this risk may be enhanced for securities with longer maturities.
High Yield Fixed Income Securities: There is a greater risk of issuer default, less liquidity, and increased price volatility related to high yield securities than investment grade securities.
Counterparties:
There is risk that a party upon whom the Fund relies to complete a transaction will default.
Credit Risk: If the
issuer of a debt instrument fails to pay interest or principal in a timely manner, or negative perceptions exist in the market of the issuer’s ability to make such payments, the price of the security may decline.
Prospectus: For
additional information on risks, please see the Fund’s prospectus.
Asset
Allocation
The
following table presents asset allocation within certain industries as a percentage of total investments as of September 30, 2021.
| Corporate
Bonds and Notes |
|
88%
|
| Oil,
Gas & Consumable Fuels |
10%
|
|
| Telecommunications
|
7
|
|
| Media
|
6
|
|
| All
other Corporate Bonds and Notes |
65
|
|
| Short-Term
Investment |
|
7
|
| Preferred
Stock |
|
3
|
| Common
Stocks |
|
2
|
| Total
|
|
100%
|
For information regarding the indexes and certain
investment terms, see the Key Investment Terms starting on page 6.
AllianzGI High Yield Bond Fund
(Continued)
Average Annual Total Returns1 for periods ended 9/30/21
| |
|
1
Year |
5
Years |
10
Years |
| Class
A shares at NAV2 |
12.20 %
|
4.83%
|
5.67%
|
| Class
A shares at POP3,4 |
7.99
|
4.03
|
5.27
|
| Class
C shares at NAV2 and with CDSC4 |
11.32
|
4.13
|
4.92
|
| Class
P shares at NAV2 |
12.47
|
5.21
|
5.99
|
| Institutional
Class shares at NAV2 |
12.43
|
5.17
|
6.00
|
| Administrative
Class shares at NAV2 |
14.60
|
5.49
|
5.92
|
| ICE
BofA U.S. High Yield Index |
11.46
|
6.35
|
7.30
|
| Fund
Expense Ratios5: Gross 1.14%, Net 1.12%; Class C shares: Gross 1.76%, Net 1.76%; Class P shares: Gross 0.88%, Net 0.80%; Institutional Class
shares: Gross 0.87%, Net 0.83%; Administrative Class shares: Gross 1.16%, Net 1.00%. |
|
|
|
|
| All
returns represent past performance which is no guarantee of future results. Current performance may be higher or lower than the performance shown. The investment return and principal value of an investment will fluctuate so that an investor’s
shares, when redeemed, may be worth more or less than their original cost. The above table and graph below do not reflect the deduction of taxes that a shareholder would pay on fund distributions or the redemption of shares. Please visit Virtus.com
for performance data current to the most recent month-end. |
Growth of $10,000 for periods ended 9/30
This chart assumes an initial investment of $10,000
made on September 30, 2011, for Class A shares, Class C shares, Class P shares, Institutional Class shares, and Administrative Class shares including any applicable sales charges or fees. Performance assumes reinvestment of dividends and capital
gain distributions.
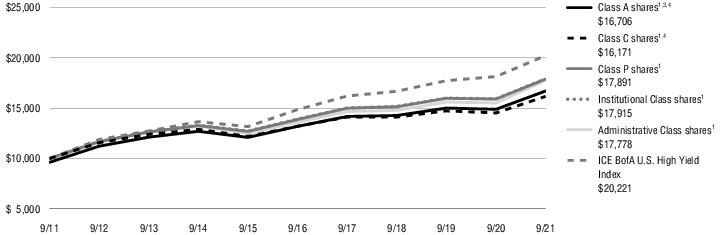
|
1 |
Total
returns are historical and include changes in share price and the reinvestment of both dividends and capital gain distributions. |
|
2 |
“NAV”
(Net Asset Value) total returns do not include the effect of any sales charge. |
|
3 |
“POP”
(Public Offering Price) total returns include the effect of the maximum front-end 3.75% sales charge. |
|
4 |
“CDSC”
(contingent deferred sales charge) is applied to redemptions of certain classes of shares that do not have a sales charge applied at the time of purchase. CDSC for certain redemptions of Class A shares made within 18 months of a finder’s fee
being paid and all Class C shares are 1% within the first year and 0% thereafter. |
|
5 |
The
expense ratios of the Fund are set forth according to the prospectus for the Fund effective February 1, 2021, as supplemented and revised, and may differ from the expense ratios disclosed in the Financial Highlights tables in this report. See the
Financial Highlights for more current expense ratios. Net Expense: Expenses reduced by a contractual expense limitation in effect through February 1, 2023. Gross Expense: Does not reflect the effect of the expense limitation. Expense ratios include
fees and expenses associated with any underlying funds. |
The index is unmanaged and not available for direct
investment; therefore, its performance does not reflect the expenses associated with active management of an actual portfolio.
For information regarding the indexes and certain investment terms,
see the Key Investment Terms starting on page 6.
| |
Ticker Symbols: |
| |
Class A :
AOPAX |
| |
Class C:
AOPCX |
| |
Class P:
ALOPX |
| |
Institutional
Class: ALOIX |
| |
Class R6:
AIISX |
AllianzGI International Small-Cap Fund Fund Summary (Unaudited)
Portfolio Manager Commentary by
Allianz Global Investors U.S. LLC
| ■
|
The Fund is
diversified and has an investment objective of seeking maximum long-term capital appreciation. There is no guarantee that the Fund will meet its objective. |
| ■
|
For
the fiscal year ended September 30, 2021, the Fund’s Class A shares at NAV returned 23.32%, Class C shares at NAV returned 22.36%, Class P shares at NAV returned
23.48%†, Institutional Class shares at NAV returned 23.55%, and Class R6 shares at NAV returned 23.60%. For the same period, the MSCI World ex USA Small Cap Index, the
Fund’s style-specific benchmark appropriate for comparison, returned 30.14% and MSCI EAFE® Small Cap Index (net), a broad-based index, returned 29.02%.
|
† See footnote 5 on page 33.
All performance figures assume
reinvestment of distributions and exclude the effect of sales charges. Performance data quoted represents past results. Past performance is no guarantee of future results, and current performance may be higher or lower than the performance shown
above. Investment return and principal value will fluctuate so your shares, when redeemed, may be worth more or less than their original cost. Please visit Virtus.com for performance data current to the most recent month-end.
How did the markets perform during the Fund’s
fiscal year ended September 30, 2021?
International equity markets in general, and
international small-cap stocks in particular, surged over the 12 months ended September 30, 2021, with many western markets reaching new highs in early September of 2021. The rally began in November of 2020, following news that COVID-19 vaccines
under development had far higher efficacy rates than expected. Joe Biden’s victory in the U.S. presidential election also lifted expectations of massive fiscal stimulus to support the world’s largest economy. As COVID-19 vaccination
campaigns picked up speed in 2021, there was growing optimism about a swift global economic recovery from the pandemic. Robust corporate earnings growth further buoyed global stocks.
Over the 12-month period, international small-cap
stocks outperformed international large-caps.
What factors affected the Fund’s performance
during its fiscal year?
For the 12-month
period ended September 30, 2021, the Fund underperformed its benchmark, the MSCI World Ex USA Small Cap Index (net).
The Fund represents the stocks in which we have the
highest conviction from three underlying regional small-cap strategies: Europe, Japan, and Asia ex-Japan. Stock selection is the key driver of relative returns, as the regional allocation of the Fund is neutral to the benchmark, and the Fund has
risk controls to ensure that sector deviations do not become too large.
In absolute terms, all three small-cap markets
performed strongly for the fiscal year. European small-caps registered the strongest gains, followed by small-caps from Asia ex-Japan, and finally Japan. In relative terms, the Japanese portfolio outperformed its local market. The Asia ex-Japan and
the European portfolios lagged their respective indexes.
The Fund’s small-cap portfolio of quality
companies, which is exposed to structural growth trends, was not as favorably positioned as the broader equity markets during the period. The Fund saw a negative contribution from stock selection, which detracted from performance in the consumer
discretionary, industrials, and materials sectors. Health care was the most important contributor to performance, as a result of successful stock picking, followed by information technology and real estate. Sector allocation was a slight detractor.
The Fund’s underweight positions in energy and materials, and an overweight in health care, weighed on relative performance. Nevertheless, the Fund’s underweight positions in consumer staples, real estate, and utilities companies were
favorable.
Positive contributors to the
Fund’s 12-month performance included the following stocks: ASM International (Netherlands), JEOL (Japan), Siltronic (Germany), Alchip Technologies (Taiwan), and Strorebrand (Norway). ASM International operates in more than 14 countries and
produces equipment for front-end chip-making processes, such as epitaxy (film deposition), diffusion/oxidation, and chemical vapor deposition. JEOL manufactures electron optics instruments and analytical instruments. Siltronic manufactures hyper
pure silicon wafers for use in
computers, smartphones, flat panel displays, navigation systems,
automotive engine control systems, and many other applications. Alchip provides silicon design and manufacturing services and offers a range of system on chip (SoC) design solutions for low power, high performance, and cost considerations.
Storebrand Technologies offers insurance, asset management, and banking services.
Detractors from the Fund’s 12-month
performance included the following stocks: ASOS (U.K.), Marui Group (Hong Kong), Scout24 (Germany), HomeServe (U.K.), and Fuji Oil Holdings (Japan). ASOS is a leader in the growing online fashion market aimed at young adults, and has been increasing
sales at a compound annual growth rate (CAGR) of more than 25% from 2012 to 2018. Marui Group operates department stores that sell clothing, accessories, home appliances, and food, and also provides consumer loan services in Japan. Scout24 operates
as a platforms-service company, specializing in the real estate and automotive sectors, and serves clients in Europe. HomeServe provides home emergency and repair services. Fuji Oil develops and manufactures specialty vegetable oils and fats, oils-
and fats-processed foods such as chocolate, and soy protein-related products.
The preceding information is the opinion of
portfolio management only through the end of the period stated on the cover. Any such opinions are subject to change at any time based upon market or other conditions and should not be relied upon as investment advice. Past performance is no
guarantee of future results, and there is no guarantee that market forecasts will be realized.
Market Volatility:
Local, regional, or global events such as war, acts of terrorism, the spread of infectious illness or other public health issues, recessions, or other events could have a significant impact on the Fund and its investments, including hampering the
ability of the portfolio manager(s) to invest the Fund’s assets as intended.
Issuer Risk: The
Fund will be affected by factors specific to the issuers of securities and other instruments in which the Fund invests, including actual or perceived changes in the financial condition or business prospects of such issuers.
Equity Securities:
The market price of equity securities may be adversely affected by financial
For information regarding the indexes and certain
investment terms, see the Key Investment Terms starting on page 6.
AllianzGI International
Small-Cap Fund (Continued)
market, industry, or issuer-specific events. Focus on a particular
style or on small or medium-sized companies may enhance that risk.
Foreign & Emerging Markets: Investing in foreign securities, especially in emerging markets, subjects the Fund to additional risks such as increased volatility, currency fluctuations, less liquidity, and political, regulatory, economic, and market
risk.
Prospectus: For additional information on risks, please see the Fund’s prospectus.
Asset
Allocation
The
following table presents asset allocation within certain industries as a percentage of total investments as of September 30, 2021.
| Machinery
|
8%
|
| Semiconductors
& Semiconductor Equipment |
8
|
| Insurance
|
6
|
| Commercial
Services & Supplies |
5
|
| Trading
Companies & Distributors |
5
|
| Electronic
Equipment, Instruments & Components |
5
|
| Healthcare
Equipment & Supplies |
5
|
| IT
Services |
5
|
| Chemicals
|
4
|
| Real
Estate Management & Development |
3
|
| Other
(includes short-term investment) |
46
|
| Total
|
100%
|
For information regarding the indexes and certain
investment terms, see the Key Investment Terms starting on page 6.
AllianzGI International Small-Cap
Fund (Continued)
Average Annual Total Returns1 for periods ended 9/30/21
| |
|
1
Year |
5
Years |
10
Years |
Since
inception |
Inception
date |
| Class
A shares at NAV2 |
|
23.32 %
|
8.62 %
|
9.83 %
|
— %
|
—
|
| Class
A shares at POP3,4 |
|
16.54
|
7.39
|
9.21
|
—
|
—
|
| Class
C shares at NAV2 and with CDSC4 |
|
22.36
|
7.76
|
8.98
|
—
|
—
|
| Class
P shares at NAV2 |
|
23.48
5 |
8.78
|
10.00
|
—
|
—
|
| Institutional
Class shares at NAV2 |
|
23.55
|
8.83
|
10.08
|
—
|
—
|
| Class
R6 shares at NAV2 |
|
23.60
|
8.89
|
—
|
9.14
|
2/1/16
|
| MSCI
World Ex USA Small Cap Index (net) |
|
30.14
|
10.33
|
10.03
|
11.72
6 |
—
|
| MSCI
EAFE Small Cap Index (net) |
|
29.02
|
10.38
|
10.73
|
11.41
6 |
—
|
| Fund
Expense Ratios7: Gross 1.85%, Net 1.25%; Class C shares: Gross 2.58%,
Net 2.00%; Class P shares: Gross 1.60%, Net 1.10%; Institutional Class shares: Gross 1.62%, Net 1.04%; Class R6 shares: Gross 1.54%, Net 1.00%. |
|
|
|
|
|
|
| All
returns represent past performance which is no guarantee of future results. Current performance may be higher or lower than the performance shown. The investment return and principal value of an investment will fluctuate so that an investor’s
shares, when redeemed, may be worth more or less than their original cost. The above table and graph below do not reflect the deduction of taxes that a shareholder would pay on fund distributions or the redemption of shares. Please visit Virtus.com
for performance data current to the most recent month-end. |
Growth of $10,000 for periods ended 9/30
This chart assumes an initial investment of $10,000
made on September 30, 2011, for Class A shares, Class C shares, Class P shares, and Institutional Class shares including any applicable sales charges or fees. The performance of the other share class may be greater or less than that shown based on
differences in inception dates, fees, and sales charges. Performance assumes reinvestment of dividends and capital gain distributions.
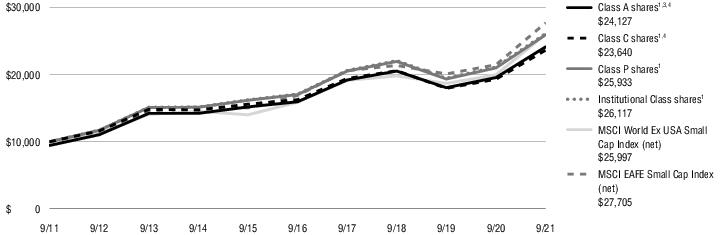
|
1 |
Total
returns are historical and include changes in share price and the reinvestment of both dividends and capital gain distributions. |
|
2 |
“NAV”
(Net Asset Value) total returns do not include the effect of any sales charge. |
|
3 |
“POP”
(Public Offering Price) total returns include the effect of the maximum front-end 5.50% sales charge. |
|
4 |
“CDSC”
(contingent deferred sales charge) is applied to redemptions of certain classes of shares that do not have a sales charge applied at the time of purchase. CDSC for certain redemptions of Class A shares made within 18 months of a finder’s fee
being paid and all Class C shares are 1% within the first year and 0% thereafter. |
|
5 |
Total
Return for the report period presented in the table differs from the return in the Financial Highlights. The total return presented in the above table is calculated based on the NAV at which shareholder transactions were processed. The total return
presented in the Financial Highlights section of the report is calculated in the same manner, but also takes into account certain adjustments that are necessary under generally accepted accounting principles required in the annual report and
semiannual report. |
|
6 |
The
since inception index return is from the inception date of Class R6 shares. |
|
7 |
The
expense ratios of the Fund are set forth according to the prospectus for the Fund effective February 1, 2021, as supplemented and revised, and may differ from the expense ratios disclosed in the Financial Highlights tables in this report. See the
Financial Highlights for more current expense ratios. Net Expense: Expenses reduced by a contractual expense limitation in effect through February 1, 2023. Gross Expense: Does not reflect the effect of the expense limitation. Expense ratios include
fees and expenses associated with any underlying funds. |
The indexes are unmanaged and not available for
direct investment; therefore, their performance does not reflect the expenses associated with active management of an actual portfolio.
For information regarding the indexes and certain investment terms,
see the Key Investment Terms starting on page 6.
AllianzGI Preferred Securities
and Income Fund Fund Summary (Unaudited)
| |
Ticker Symbols: |
| |
Class P:
APUPX |
| |
Institutional
Class: APEIX |
| |
Class R6:
ARISX |
Portfolio Manager Commentary by
Allianz Global Investors U.S. LLC
| ■
|
The Fund is
diversified and has an investment objective of seeking total return consisting of high current income and capital appreciation. There is no guarantee that the Fund will meet its objective. |
| ■
|
For
the fiscal year ended September 30, 2021, the Fund’s Class P shares at NAV returned 17.18%, Institutional Class shares at NAV returned 17.20%†, and Class R6 shares
at NAV returned 17.32%. For the same period, the ICE BofA Fixed Rate Preferred Securities Index, the Fund’s style-specific benchmark appropriate for comparison, returned 6.86% and S&P 500® Financials Index, a broad-based index, returned 59.13%. |
† See footnote 3 on page 36.
All performance figures assume
reinvestment of distributions and exclude the effect of sales charges. Performance data quoted represents past results. Past performance is no guarantee of future results, and current performance may be higher or lower than the performance shown
above. Investment return and principal value will fluctuate so your shares, when redeemed, may be worth more or less than their original cost. Please visit Virtus.com for performance data current to the most recent month-end.
How did the markets perform during the Fund’s
fiscal year ended September 30, 2021?
Despite the longer-term trend of the difference
between senior and subordinated security yields narrowing, preferred market valuations still looked attractive on a relative basis, because yields on senior securities rallied even further, providing room for the spread between senior and
subordinated securities to come down. Balanced new issuance and redemption trends combined with yield demand also created a supportive technical environment.
What factors affected the Fund’s performance
during its fiscal year?
For the 12-month
period ended September 30, 2021, the Fund outperformed its benchmark, the ICE BofAML Fixed Rate Preferred Securities Index. Returns for both the Fund and the benchmark reflected the rebound from the pandemic-driven market weakness. The Fund’s
relative performance benefited from a strong rebound in lower-rated
securities, and opportunistic increases in the Fund’s
exposure to sectors whose growth was impacted by the pandemic, such as pipelines and miscellaneous manufacturing. Out-of-benchmark exposures to floating rate securities, European bank additional tier 1 securities (AT1s ), and common equities also
contributed positively to relative performance. Positive security selection in pipelines, banks, insurance, diversified financial services, and miscellaneous manufacturing also helped relative performance, along with exposure to securities with
coupons indexed with a spread to five- and 10-year Treasuries versus those indexed to short-term, three-month London Interbank Offered Rates (LIBOR).
Fund performance benefited from an overweight
allocation to below-investment-grade securities. Below-investment-grade preferred securities, as measured by the ICE BofA US High Yield Institutional Capital Securities Index (HIPS), outperformed the benchmark, which includes only investment grade
securities. Given the concentrated nature of the benchmark’s positions in the three largest U.S. financial institutions, collectively 40%, the process of diversifying to large U.S. regional banks, diversified financials, and European AT1s
results in a significant amount of exposure to BB-rated securities. The Fund’s overweight position in the pipeline sector also contributed to the allocation to below-investment-grade securities. An out-of-benchmark allocation to floating rate
hybrids, securities which have passed their initial call date and transitioned to floating rate coupons, was among the top contributors to Fund performance, benefiting from the rebound of economic activity, which drove Treasury yields higher. A
modest allocation to a few select higher dividend-yielding pipeline common equities also contributed to Fund performance. Detracting from performance over the 12-month period was the Fund’s positioning in securities with 10-year call
structures, which lagged when rates climbed steeply in the first quarter of 2021. The Fund reduced its holdings in these securities during the fiscal year ended September 30, 2021.
Additionally, given the strong rebound in
performance across markets following the introduction of COVID-19 vaccines, the Fund took profits on many of its overweight positions.
The preceding information is the opinion of
portfolio management only through the end of the period
stated on the cover. Any such opinions are subject to change at any
time based upon market or other conditions and should not be relied upon as investment advice. Past performance is no guarantee of future results, and there is no guarantee that market forecasts will be realized.
Market Volatility:
Local, regional, or global events such as war, acts of terrorism, the spread of infectious illness or other public health issues, recessions, or other events could have a significant impact on the portfolio and its investments, including hampering
the ability of the portfolio manager(s) to invest the portfolio’s assets as intended.
Issuer Risk: The
portfolio will be affected by factors specific to the issuers of securities and other instruments in which the portfolio invests, including actual or perceived changes in the financial condition or business prospects of such issuers.
Equity Securities:
The market price of equity securities may be adversely affected by financial market, industry, or issuer-specific events. Focus on a particular style or on small or medium-sized companies may enhance that
risk.
Preferred Stocks: Preferred stocks may decline in price, fail to pay dividends, or be illiquid.
Debt Instruments:
Debt instruments are subject to greater levels of credit and liquidity risk, may be speculative and may decline in value due to changes in interest rates or an issuer’s or counterparty’s deterioration or
default.
Convertible Securities: A convertible security may be called for redemption at a time and price unfavorable to the portfolio.
Contingent Convertible Securities: Contingent convertible securities (“CoCos”) are subject to greater levels of credit and liquidity risk than fixed income securities generally. They may rank junior to other creditors in the event of a
liquidation or other bankruptcy-related event and become further subordinated as a result of conversion from debt to equity.
High Yield Fixed Income Securities: There is a greater risk of issuer default, less liquidity, and increased price volatility related to high yield securities than investment grade securities.
For information regarding the indexes and certain
investment terms, see the Key Investment Terms starting on page 6.
AllianzGI Preferred Securities
and Income Fund (Continued)
Liquidity: Certain securities may
be difficult to sell at a time and price beneficial to the portfolio.
ABS/MBS: Changes in
interest rates can cause both extension and prepayment risks for asset- and mortgage-backed securities. These securities are also subject to risks associated with the non-repayment of underlying collateral, including losses to the
portfolio.
Foreign Investing: Investing in foreign securities subjects the portfolio to additional risks such as increased volatility, currency fluctuations, less liquidity, and political, regulatory, economic, and market risk.
Variable Distribution Risk: Periodic distributions by investments of variable or floating interest rates vary with fluctuations in market interest rates.
Prospectus: For additional
information on risks, please see the Fund’s prospectus.
Asset
Allocation
The
following table presents asset allocation within certain sectors as a percentage of total investments as of September 30, 2021.
| Corporate
Bonds and Notes |
|
62%
|
| Financials
|
42%
|
|
| Energy
|
7
|
|
| Consumer,
Cyclical |
5
|
|
| All
other Corporate Bonds and Notes |
8
|
|
| Preferred
Stocks |
|
34
|
| Short-Term
Investment |
|
3
|
| U.S.
Government Security |
|
1
|
| Total
|
|
100%
|
For information regarding the indexes and certain
investment terms, see the Key Investment Terms starting on page 6.
AllianzGI Preferred Securities
and Income Fund (Continued)
Average Annual Total Returns1 for periods ended 9/30/21
| |
|
1
Year |
Since
inception |
Inception
date |
| Class
P shares at NAV2 |
|
17.18 %
|
8.53 %
|
5/30/18
|
| Institutional
Class shares at NAV2 |
|
17.20
3 |
8.60
|
5/30/18
|
| Class
R6 shares at NAV2 |
|
17.32
|
8.64
|
5/30/18
|
| ICE
BofA Fixed Rate Preferred Securities Index |
|
6.86
|
6.71
4 |
—
|
| S&P
500® Financials Index |
|
59.13
|
12.43
4 |
—
|
| Fund
Expense Ratios5: Class P shares: Gross 1.07%, Net 0.60%; Institutional
Class shares: Gross 1.13%, Net 0.55%; Class R6 shares: Gross 1.07%, Net 0.50%. |
|
|
|
|
| All
returns represent past performance which is no guarantee of future results. Current performance may be higher or lower than the performance shown. The investment return and principal value of an investment will fluctuate so that an investor’s
shares, when redeemed, may be worth more or less than their original cost. The above table and graph below do not reflect the deduction of taxes that a shareholder would pay on fund distributions or the redemption of shares. Please visit Virtus.com
for performance data current to the most recent month-end. |
Growth of $10,000 for periods ended 9/30
This chart assumes an initial investment of $10,000
made on May 30, 2018 (inception date of the Fund), for Class P shares, Institutional Class shares, and Class R6 shares including any applicable sales charges or fees. Performance assumes reinvestment of dividends and capital gain
distributions.
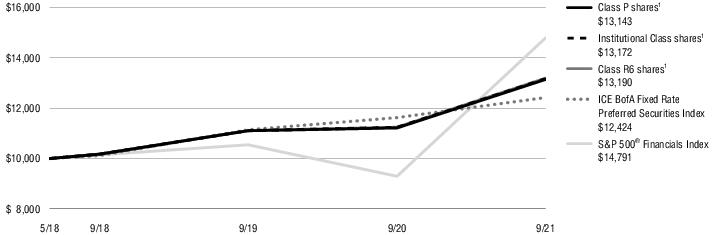
|
1 |
Total
returns are historical and include changes in share price and the reinvestment of both dividends and capital gain distributions. |
|
2 |
“NAV”
(Net Asset Value) total returns do not include the effect of any sales charge. |
|
3 |
Total
Return for the report period presented in the table differs from the return in the Financial Highlights. The total return presented in the above table is calculated based on the NAV at which shareholder transactions were processed. The total return
presented in the Financial Highlights section of the report is calculated in the same manner, but also takes into account certain adjustments that are necessary under generally accepted accounting principles required in the annual report and
semiannual report. |
|
4 |
The
since inception index return is from the Fund’s inception date. |
|
5 |
The
expense ratios of the Fund are set forth according to the prospectus for the Fund effective February 1, 2021, as supplemented and revised, and may differ from the expense ratios disclosed in the Financial Highlights tables in this report. See the
Financial Highlights for more current expense ratios. Net Expense: Expenses reduced by a contractual expense limitation in effect through February 1, 2023. Gross Expense: Does not reflect the effect of the expense limitation. Expense ratios include
fees and expenses associated with any underlying funds. |
The indexes are unmanaged and not available for
direct investment; therefore, their performance does not reflect the expenses associated with active management of an actual portfolio.
For information regarding the indexes and certain investment terms,
see the Key Investment Terms starting on page 6.
| |
Ticker Symbols: |
| |
Class A :
ASHAX |
| |
Class C:
ASHCX |
| |
Class P:
ASHPX |
| |
Institutional
Class: ASHIX |
| |
Class R6:
ASHSX |
AllianzGI Short Duration High Income Fund Fund Summary (Unaudited)
Portfolio Manager Commentary by
Allianz Global Investors U.S. LLC
| ■
|
The Fund is
diversified and has an investment objective of seeking a high level of current income with lower volatility than the broader high yield market. There is no guarantee that the Fund will meet its objective.
|
| ■
|
For
the fiscal year ended September 30, 2021, the Fund’s Class A shares at NAV returned 10.57%†, Class C shares at NAV returned 10.26%†, Class P shares at NAV returned 10.74%†, Institutional Class shares at NAV returned 10.91%, and
Class R6 shares at NAV returned 10.95%. For the same period, the ICE BofA 1-3 Year BB U.S. Cash Pay High Yield Index, the Fund’s style-specific benchmark appropriate for comparison, returned 6.40%. |
† See footnote 3 on page 38.
All performance figures assume
reinvestment of distributions and exclude the effect of sales charges. Performance data quoted represents past results. Past performance is no guarantee of future results, and current performance may be higher or lower than the performance shown
above. Investment return and principal value will fluctuate so your shares, when redeemed, may be worth more or less than their original cost. Please visit Virtus.com for performance data current to the most recent month-end.
How did the markets perform during the Fund’s
fiscal year ended September 30, 2021?
High yield bonds produced a positive return for the
12-month period, with the ICE BofA U.S. High Yield Index returning 11.46%. By way of comparison, the 10-year U.S. Treasury returned -6.22%, and the S&P 500® Index
gained 30.00%.
Over the fiscal year, high
yield bond prices rose, yields fell, and credit spreads (the additional yield an investor receives above the risk-free rate) tightened against a backdrop of improving credit fundamentals, declining default rates, and a rising upgrade-to-downgrade
ratio.
All high yield bond industries advanced for the
period. Theaters & entertainment, printing & publishing, and energy outperformed, while cable & satellite TV, utilities, and telecom-wireless underperformed.
Performance dispersion among credit quality
categories widened over the 12-month period as the market recovery broadened and interest rates trended higher. For the period, issues rated BB, B, and CCC returned 9.7%, 10.0%, and 24.1%, respectively.
Lastly, high yield bond new issuance in 2021 was
robust as of the end of September, and was on track to surpass 2020’s annual record.
What factors affected the Fund’s performance
during its fiscal year?
The Fund produced a
positive total return for the fiscal year ended September 30, 2021, and delivered a high level of income over the same period.
Performance during the reporting period benefited
from industry weightings and active credit selection. Industry exposures that had the greatest positive impact on performance were financial services, energy, and aerospace. There were no industries that detracted from performance for the
period.
The Fund remained focused on credit
quality, liquidity, and minimizing premiums paid. Average duration in the Fund remained relatively low and well below the average yield and coupon during the fiscal year.
The preceding information is the opinion of
portfolio management only through the end of the period stated on the cover. Any such opinions are subject to change at any time based upon market or other conditions and should not be relied upon as investment advice. Past performance is no
guarantee of future results, and there is no guarantee that market forecasts will be realized.
Debt Instruments:
Debt instruments are subject to greater levels of credit and liquidity risk, may be speculative and may decline in value due to changes
in interest rates or an issuer’s or counterparty’s
deterioration or default.
High Yield Fixed
Income Securities: There is a greater risk of issuer default, less liquidity, and increased price volatility related to high yield securities than investment grade securities.
Market Volatility:
Local, regional, or global events such as war, acts of terrorism, the spread of infectious illness or other public health issues, recessions, or other events could have a significant impact on the Fund and its investments, including hampering the
ability of the portfolio manager(s) to invest the Fund’s assets as intended.
Issuer Risk: The
Fund will be affected by factors specific to the issuers of securities and other instruments in which the Fund invests, including actual or perceived changes in the financial condition or business prospects of such issuers.
Interest Rate: The
values of debt instruments may rise or fall in response to changes in interest rates, and this risk may be enhanced for securities with longer maturities.
Credit Risk: If the
issuer of a debt instrument fails to pay interest or principal in a timely manner, or negative perceptions exist in the market of the issuer’s ability to make such payments, the price of the security may decline.
Prospectus: For
additional information on risks, please see the Fund’s prospectus.
Asset
Allocation
The
following table presents asset allocation within certain industries as a percentage of total investments as of September 30, 2021.
| Corporate
Bonds and Notes |
|
89%
|
| Diversified
Financial Services |
9%
|
|
| Oil,
Gas & Consumable Fuels |
9
|
|
| Pipelines
|
9
|
|
| All
other Corporate Bonds and Notes |
62
|
|
| Leveraged
Loans |
|
7
|
| Short-Term
Investment |
|
4
|
| Total
|
|
100%
|
For information regarding the indexes and certain
investment terms, see the Key Investment Terms starting on page 6.
AllianzGI Short Duration High
Income Fund (Continued)
Average Annual Total Returns1 for periods ended 9/30/21
| |
|
1
Year |
5
Years |
Since
inception |
Inception
date |
| Class
A shares at NAV2 |
|
10.57 %
3 |
4.15 %
|
4.74 %
|
10/3/11
|
| Class
A shares at POP4,5 |
|
8.09
|
3.68
|
4.50
|
10/3/11
|
| Class
C shares at NAV2 and with CDSC5 |
|
10.26
3 |
3.89
|
4.43
|
10/3/11
|
| Class
P shares at NAV2 |
|
10.74
3 |
4.40
|
4.95
|
10/3/11
|
| Institutional
Class shares at NAV2 |
|
10.91
|
4.44
|
5.02
|
10/3/11
|
| Class
R6 shares at NAV2 |
|
10.95
|
—
|
4.48
|
2/1/17
|
| ICE
BofA 1-3 Year BB U.S. Cash Pay High Yield Index |
|
6.40
|
4.52
|
—
6 |
—
|
| Fund
Expense Ratios7: Class A shares: Gross 1.00%, Net 0.86%; Class C
shares: Gross 1.23%, Net 1.11%; Class P shares: Gross 0.77%, Net 0.65%; Institutional Class shares: Gross 0.75%, Net 0.60%; Class R6 shares: Gross 0.69%, Net 0.55%. |
|
|
|
|
|
| All
returns represent past performance which is no guarantee of future results. Current performance may be higher or lower than the performance shown. The investment return and principal value of an investment will fluctuate so that an investor’s
shares, when redeemed, may be worth more or less than their original cost. The above table and graph below do not reflect the deduction of taxes that a shareholder would pay on fund distributions or the redemption of shares. Please visit Virtus.com
for performance data current to the most recent month-end. |
Growth of $10,000 for periods ended 9/30
This chart assumes an initial investment of $10,000
made on October 3, 2011 (inception date of the Fund), for Class A shares, Class C shares, Class P shares, and Institutional Class shares including any applicable sales charges or fees. The performance of the other share class may be greater or less
than that shown based on differences in inception dates, fees, and sales charges. Performance assumes reinvestment of dividends and capital gain distributions.
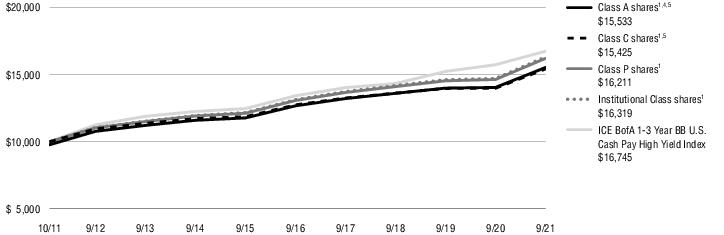
|
1 |
Total
returns are historical and include changes in share price and the reinvestment of both dividends and capital gain distributions. |
|
2 |
“NAV”
(Net Asset Value) total returns do not include the effect of any sales charge. |
|
3 |
Total
Return for the report period presented in the table differs from the return in the Financial Highlights. The total return presented in the above table is calculated based on the NAV at which shareholder transactions were processed. The total return
presented in the Financial Highlights section of the report is calculated in the same manner, but also takes into account certain adjustments that are necessary under generally accepted accounting principles required in the annual report and
semiannual report. |
|
4 |
“POP”
(Public Offering Price) total returns include the effect of the maximum front-end 2.25% sales charge. |
|
5 |
“CDSC”
(contingent deferred sales charge) is applied to redemptions of certain classes of shares that do not have a sales charge applied at the time of purchase. CDSC for certain redemptions of Class A shares made within 18 months of a finder’s fee
being paid and all Class C shares are 1% within the first year and 0% thereafter. |
|
6 |
The
since inception index returned 5.29% from the inception date of Class A shares, Class C shares, Class P shares, and Institutional Class shares and 4.56% from the inception date of Class R6 shares. |
|
7 |
The
expense ratios of the Fund are set forth according to the prospectus for the Fund effective February 1, 2021, as supplemented and revised, and may differ from the expense ratios disclosed in the Financial Highlights tables in this report. See the
Financial Highlights for more current expense ratios. Net Expense: Expenses reduced by a contractual expense limitation in effect through February 1, 2023. Gross Expense: Does not reflect the effect of the expense limitation. Expense ratios include
fees and expenses associated with any underlying funds. |
The index is unmanaged and not available for direct
investment; therefore, its performance does not reflect the expenses associated with active management of an actual portfolio.
For information regarding the indexes and certain investment terms,
see the Key Investment Terms starting on page 6.
| |
Ticker Symbols: |
| |
Class A :
AWTAX |
| |
Class C:
AWTCX |
| |
Class P:
AWTPX |
| |
Institutional
Class: AWTIX |
AllianzGI Water Fund
Fund Summary (Unaudited)
Portfolio Manager Commentary by
Allianz Global Investors U.S. LLC
| ■
|
The Fund is
non-diversified and has an investment objective of seeking long-term capital appreciation. There is no guarantee that the Fund will meet its objective. |
| ■
|
For
the fiscal year ended September 30, 2021, the Fund’s Class A shares at NAV returned 29.41%, Class C shares at NAV returned 28.48%, Class P shares at NAV returned 29.77%, and Institutional Class shares at NAV returned 29.76%. For the same
period, the S&P 500® Global Water Index, the Fund’s style-specific benchmark appropriate for comparison, returned 37.41% and MSCI AC World Index (net), a
broad-based index, returned 27.44%. |
All performance figures assume
reinvestment of distributions and exclude the effect of sales charges. Performance data quoted represents past results. Past performance is no guarantee of future results, and current performance may be higher or lower than the performance shown
above. Investment return and principal value will fluctuate so your shares, when redeemed, may be worth more or less than their original cost. Please visit Virtus.com for performance data current to the most recent month-end.
How did the markets perform during the Fund’s
fiscal year ended September 30, 2021?
For the 12-month period ended September 30, 2021,
global equity markets surged, with many western markets reaching new highs in early September of 2021. The rally began in November of 2020, following news that COVID-19 vaccines under development had far higher efficacy rates than expected. Joe
Biden’s victory in the U.S. presidential election also lifted expectations of massive fiscal stimulus to support the world’s largest economy. As COVID-19 vaccination campaigns picked up speed in 2021, there was growing optimism about a
swift global economic recovery from the pandemic. Robust corporate earnings growth further buoyed global stocks.
Every sector in the MSCI AC World Index rallied
during the fiscal year. Energy stocks soared as oil prices rallied sharply amid expectations of stronger demand. The financials sector was another leader, boosted by strengthening economic activity and
higher long-term bond yields, which lifted the outlook for
banks’ profit margins. While defensive sectors such as consumer staples and utilities were among the weakest performers, they still recorded double-digit gains.
Economic news showed that the global economy was
recovering from the pandemic-related shock. However, as supply chain blockages and rising wages pushed inflation rates higher, speculation grew that central banks would soon start to taper their pandemic stimulus measures, raise interest rates, or
both. While rates rose in several markets, Group of Seven (G7) nations did not follow suit during the reporting period. In September of 2021, the U.S. Federal Reserve (the Fed) signalled that it might start to taper later in the year, and a greater
number of U.S. policymakers predicted that rates would rise in 2022. In the same month, the European Central Bank (ECB) decided to trim its monthly asset purchases, while the Bank of England indicated that it might soon raise rates to combat
inflation.
What factors affected the
Fund’s performance during its fiscal year?
The Fund delivered strong absolute results during
the fiscal year ended September 30, 2021.
Positive performance was driven by stock selection,
particularly within the health care and industrials sectors. Sector allocation detracted from results during the period.
From an individual stock perspective, Xylem (smart
water technology provider), Alfa Laval (fluid control), Arcadis (environmental engineering), Danaher (water diagnostic and treatment solutions), and Tetra Tech (environmental engineering) were the strongest absolute contributors to results.
In contrast, Fortune Brands (water efficiency
building products), Kubota (water efficient agriculture equipment), Wienerberger (building materials), American States Water (U.S. Water utility), and Veolia (French water utility) were the largest absolute detractors from results. The Fund exited
its position in American States Water during the reporting period.
The preceding information is the opinion of
portfolio management only through the end of the period stated on the cover. Any such opinions are subject to change at any time based upon market or other conditions and should not be relied upon as investment advice. Past performance is no
guarantee of future results, and there is no guarantee that market forecasts will be realized.
Market Volatility:
Local, regional, or global events such as war, acts of terrorism, the spread of infectious illness or other public health issues, recessions, or other events could have a significant impact on the Fund and its investments, including hampering the
ability of the portfolio manager(s) to invest the Fund’s assets as intended.
Issuer Risk: The
Fund will be affected by factors specific to the issuers of securities and other instruments in which the Fund invests, including actual or perceived changes in the financial condition or business prospects of such issuers.
Equity Securities:
The market price of equity securities may be adversely affected by financial market, industry, or issuer-specific events. Focus on a particular style or on small or medium-sized companies may enhance that
risk.
Water-Related Risk: Because the Fund focuses its investments in water-related companies, it is particularly affected by events or factors relating to this sector, which may increase risk and volatility.
Focused Investments:
To the extent the Fund focuses its investments on a limited number of issuers, sectors, industries or geographic regions, it may be subject to increased risk and volatility.
Foreign Investing:
Investing in foreign securities subjects the Fund to additional risks such as increased volatility, currency fluctuations, less liquidity, and political, regulatory, economic, and market risk.
Sustainable Investing: Because the Fund focuses on investments in companies that the Manager believes exhibit strong environmental, social, and corporate governance records, the Fund’s universe of investments may be smaller than that of
other funds and broad equity benchmark indices.
Prospectus: For
additional information on risks, please see the Fund’s prospectus.
For information regarding the indexes and certain
investment terms, see the Key Investment Terms starting on page 6.
AllianzGI Water Fund
(Continued)
Asset
Allocation
The
following table presents asset allocation within certain industries as a percentage of total investments as of September 30, 2021.
| Machinery
|
36%
|
| Water
Utilities |
11
|
| Electronic
Equipment, Instruments & Components |
10
|
| Building
Products |
10
|
| Life
Sciences Tools & Services |
7
|
| Healthcare
Equipment & Supplies |
5
|
| Multi-Utilities
|
4
|
| Commercial
Services & Supplies |
4
|
| Chemicals
|
4
|
| Construction
& Engineering |
4
|
| Other
(includes short-term investment) |
5
|
| Total
|
100%
|
For information regarding the indexes and certain
investment terms, see the Key Investment Terms starting on page 6.
AllianzGI Water Fund
(Continued)
Average Annual Total Returns1 for periods ended 9/30/21
| |
|
1
Year |
5
Years |
10
Years |
| Class
A shares at NAV2 |
29.41 %
|
11.83%
|
12.26%
|
| Class
A shares at POP3,4 |
22.29
|
10.57
|
11.63
|
| Class
C shares at NAV2 and with CDSC4 |
28.48
|
10.99
|
11.42
|
| Class
P shares at NAV2 |
29.77
|
12.13
|
12.54
|
| Institutional
Class shares at NAV2 |
29.76
|
12.14
|
12.60
|
| MSCI
AC World Index (net) |
27.44
|
13.20
|
11.90
|
| S&P
Global Water Index (net) |
37.41
|
14.87
|
14.00
|
| Fund
Expense Ratios5: Gross 1.49%, Net 1.22%; Class C shares: Gross 2.23%, Net 1.97%; Class P shares: Gross 1.25%, Net 0.94%; Institutional Class
shares: Gross 1.27%, Net 0.93%. |
|
|
|
|
| All
returns represent past performance which is no guarantee of future results. Current performance may be higher or lower than the performance shown. The investment return and principal value of an investment will fluctuate so that an investor’s
shares, when redeemed, may be worth more or less than their original cost. The above table and graph below do not reflect the deduction of taxes that a shareholder would pay on fund distributions or the redemption of shares. Please visit Virtus.com
for performance data current to the most recent month-end. |
Growth of $10,000 for periods ended 9/30
This chart assumes an initial investment of $10,000
made on September 30, 2011, for Class A shares, Class C shares, Class P shares, and Institutional Class shares including any applicable sales charges or fees. Performance assumes reinvestment of dividends and capital gain distributions.
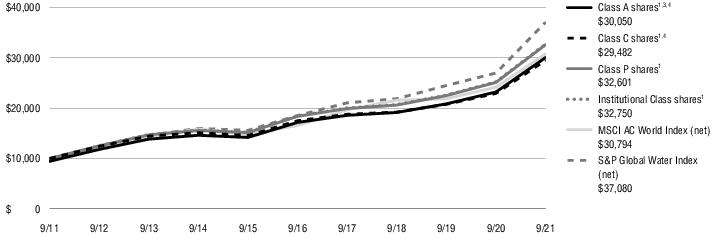
|
1 |
Total
returns are historical and include changes in share price and the reinvestment of both dividends and capital gain distributions. |
|
2 |
“NAV”
(Net Asset Value) total returns do not include the effect of any sales charge. |
|
3 |
“POP”
(Public Offering Price) total returns include the effect of the maximum front-end 5.50% sales charge. |
|
4 |
“CDSC”
(contingent deferred sales charge) is applied to redemptions of certain classes of shares that do not have a sales charge applied at the time of purchase. CDSC for certain redemptions of Class A shares made within 18 months of a finder’s fee
being paid and all Class C shares are 1% within the first year and 0% thereafter. |
|
5 |
The
expense ratios of the Fund are set forth according to the prospectus for the Fund effective February 1, 2021, as supplemented and revised, and may differ from the expense ratios disclosed in the Financial Highlights tables in this report. See the
Financial Highlights for more current expense ratios. Net Expense: Expenses reduced by a contractual expense limitation in effect through February 1, 2023. Gross Expense: Does not reflect the effect of the expense limitation. Expense ratios include
fees and expenses associated with any underlying funds. |
The indexes are unmanaged and not available for
direct investment; therefore, their performance does not reflect the expenses associated with active management of an actual portfolio.
For information regarding the indexes and certain investment terms,
see the Key Investment Terms starting on page 6.
| |
Ticker Symbols: |
| |
Class A :
AZMAX |
| |
Class C:
AZMCX |
| |
Class P:
AZMPX |
| |
Institutional
Class: AZMIX |
NFJ Emerging Markets Value Fund Fund Summary (Unaudited)
Portfolio Manager Commentary by
NFJ Investment Group, LLC
| ■
|
The Fund is
diversified and has an investment objective of seeking long-term capital appreciation. There is no guarantee that the Fund will meet its objective. |
| ■
|
For
the fiscal year ended September 30, 2021, the Fund’s Class A shares at NAV returned 12.24%, Class C shares at NAV returned 11.40%, Class P shares at NAV returned 12.40%, and Institutional Class shares at NAV returned 12.50%. For the same
period, the MSCI Emerging Markets Index (net), the Fund’s style-specific benchmark appropriate for comparison, returned 18.20%. |
All performance figures assume
reinvestment of distributions and exclude the effect of sales charges. Performance data quoted represents past results. Past performance is no guarantee of future results, and current performance may be higher or lower than the performance shown
above. Investment return and principal value will fluctuate so your shares, when redeemed, may be worth more or less than their original cost. Please visit Virtus.com for performance data current to the most recent month-end.
How did the markets perform during the Fund’s
fiscal year ended September 30, 2021?
International equities generally rallied over the
12-month period, buoyed by the prospect of COVID-19 vaccinations, further stimulus measures, and a recovering global economy. That said, the market rally based on expectations of the economy reopening largely faltered toward the end of the reporting
period as investors grappled with the rise of the Delta variant, the Evergrande crisis in China, and central banks around the globe tightening monetary policy in an effort to battle spiking inflation. Rising inflation presented particular challenges
in the emerging markets, with central banks in Brazil, Russia, and Mexico hiking interest rates in 2021.
Within the MSCI Emerging Markets Index (net),
Russia, India, and Taiwan led returns, while China
slumped 7.5% for the reporting period. The index’s
best-performing sectors were materials and energy, which rose more than 45%, followed by strength from information technology and utilities. In contrast, consumer discretionary and real estate slumped into negative territory, followed by weakness
from the communication services and health care sectors over the 12 months.
What factors affected the Fund’s performance
during its fiscal year?
For the 12-month
period ended September 30, 2021, the Fund underperformed its benchmark MSCI Emerging Markets Index (net).
Negative stock selection drove performance results,
largely due to stock picking in the consumer discretionary and materials sectors, as holdings failed to keep pace with benchmark shares. These results were only somewhat offset by positive stock selection in the information technology and
industrials sectors.
Sector allocation
modestly detracted over the period, largely due to underweight positions in materials and energy, which dampened relative returns. Conversely, an underweight in consumer discretionary and an overweight in information technology benefitted
results.
By country, stock selection was
strong across the U.S., China, South Korea, and Taiwan, while selection in India, Brazil, South Africa, and Saudi Arabia dampened relative returns. From an allocation standpoint, overweight positions in the Netherlands, Hong Kong, and the U.S.
contributed, while underweight exposures across Russia, Taiwan, and India detracted from relative performance.
The preceding information is the opinion of
portfolio management only through the end of the period stated on the cover. Any such opinions are subject to change at any time based upon market or other conditions and should not be relied upon as investment advice. Past performance is no
guarantee of future results, and there is no guarantee that market forecasts will be realized.
Market Volatility:
Local, regional, or global events such as war, acts of terrorism, the spread of infectious illness or other public health issues, recessions, or other events could have a significant impact on the Fund and its investments, including hampering the
ability of the portfolio manager(s) to invest the Fund’s assets as intended.
Issuer Risk: The
Fund will be affected by factors specific to the issuers of securities and other instruments in which the Fund invests, including actual or perceived changes in the financial condition or business prospects of such issuers.
Equity Securities:
The market price of equity securities may be adversely affected by financial market, industry, or issuer-specific events. Focus on a particular style or on small or medium-sized companies may enhance that
risk.
Foreign & Emerging Markets: Investing in foreign securities, especially in emerging markets, subjects the Fund to additional risks such as increased volatility, currency fluctuations, less liquidity, and political, regulatory, economic, and market
risk.
Prospectus: For additional information on risks, please see the Fund’s prospectus.
Asset
Allocation
The
following table presents asset allocation within certain sectors as a percentage of total investments as of September 30, 2021.
| Information
Technology |
32%
|
| Financials
|
15
|
| Consumer
Discretionary |
12
|
| Communication
Services |
10
|
| Materials
|
6
|
| Consumer
Staples |
6
|
| Industrials
|
5
|
| Other
(includes short-term investment) |
14
|
| Total
|
100%
|
For information regarding the indexes and certain
investment terms, see the Key Investment Terms starting on page 6.
NFJ Emerging Markets Value Fund
(Continued)
Average Annual Total Returns1 for periods ended 9/30/21
| |
|
1
Year |
5
Years |
Since
inception |
Inception
date |
| Class
A shares at NAV2 |
|
12.24 %
|
8.83 %
|
5.96 %
|
12/18/12
|
| Class
A shares at POP3,4 |
|
6.07
|
7.61
|
5.28
|
12/18/12
|
| Class
C shares at NAV2 and with CDSC4 |
|
11.40
|
8.03
|
5.18
|
12/18/12
|
| Class
P shares at NAV2 |
|
12.40
|
8.99
|
6.13
|
12/18/12
|
| Institutional
Class shares at NAV2 |
|
12.50
|
9.11
|
6.23
|
12/18/12
|
| MSCI
Emerging Markets Index (net) |
|
18.20
|
9.23
|
4.53
5 |
—
|
| Fund
Expense Ratios6: Class A shares: Gross 1.68%, Net 1.14%; Class C
shares: Gross 2.37%, Net 1.89%; Class P shares: Gross 1.42%, Net 0.99%; Institutional Class shares: Gross 1.42%, Net 0.89%. |
|
|
|
|
|
| All
returns represent past performance which is no guarantee of future results. Current performance may be higher or lower than the performance shown. The investment return and principal value of an investment will fluctuate so that an investor’s
shares, when redeemed, may be worth more or less than their original cost. The above table and graph below do not reflect the deduction of taxes that a shareholder would pay on fund distributions or the redemption of shares. Please visit Virtus.com
for performance data current to the most recent month-end. |
Growth of $10,000 for periods ended 9/30
This chart assumes an initial investment of $10,000
made on December 18, 2012 (inception date of the Fund), for Class A shares, Class C shares, Class P shares, and Institutional Class shares including any applicable sales charges or fees. Performance assumes reinvestment of dividends and capital gain
distributions.
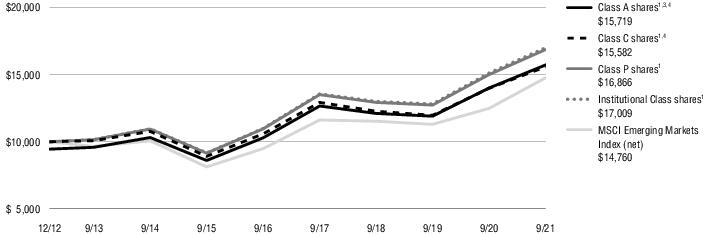
|
1 |
Total
returns are historical and include changes in share price and the reinvestment of both dividends and capital gain distributions. |
|
2 |
“NAV”
(Net Asset Value) total returns do not include the effect of any sales charge. |
|
3 |
“POP”
(Public Offering Price) total returns include the effect of the maximum front-end 5.50% sales charge. |
|
4 |
“CDSC”
(contingent deferred sales charge) is applied to redemptions of certain classes of shares that do not have a sales charge applied at the time of purchase. CDSC for certain redemptions of Class A shares made within 18 months of a finder’s fee
being paid and all Class C shares are 1% within the first year and 0% thereafter. |
|
5 |
The
since inception index return is from the Fund’s inception date. |
|
6 |
The
expense ratios of the Fund are set forth according to the prospectus for the Fund effective February 1, 2021, as supplemented and revised, and may differ from the expense ratios disclosed in the Financial Highlights tables in this report. See the
Financial Highlights for more current expense ratios. Net Expense: Expenses reduced by a contractual expense limitation in effect through February 1, 2023. Gross Expense: Does not reflect the effect of the expense limitation. Expense ratios include
fees and expenses associated with any underlying funds. |
The index is unmanaged and not available for direct
investment; therefore, its performance does not reflect the expenses associated with active management of an actual portfolio.
For information regarding the indexes and certain investment terms,
see the Key Investment Terms starting on page 6.
AllianzGI Convertible
Fund
SCHEDULE OF INVESTMENTS
September 30, 2021
($ reported in thousands)
| |
Shares
|
|
Value
|
| |
|
|
|
| Convertible
Preferred Stocks—15.7% |
| Auto
Components—1.0% |
|
|
| Aptiv
plc Series A, 5.500% |
183,535
|
|
$ 30,926
|
| Capital
Markets—0.8% |
|
|
| KKR
& Co., Inc. Series C, 6.000% |
317,090
|
|
25,053
|
Commercial
Services &
Supplies—0.6% |
|
|
| GFL
Environmental, Inc., 6.000% |
224,860
|
|
19,122
|
| Diversified
Financial Services—0.4% |
|
|
| Chewy,
Inc.2020 Mandatory Exchangeable Trust 144A, 6.500%(1) |
8,450
|
|
13,072
|
| Electric
Utilities—2.4% |
|
|
| NextEra
Energy, Inc., 5.279% |
1,042,035
|
|
53,102
|
| NextEra
Energy, Inc., 6.219% |
380,645
|
|
19,455
|
| |
|
|
72,557
|
| |
|
|
|
| |
Healthcare
Equipment &
Supplies—2.8% |
|
|
| Boston
Scientific Corp. Series A, 5.500% |
223,960
|
|
26,069
|
| Danaher
Corp. Series A, 4.750% |
28,380
|
|
57,555
|
| |
|
|
83,624
|
| |
|
|
|
| |
Independent
Power Producers &
Energy Traders—0.5% |
|
|
| AES
Corp. (The), 6.875% |
164,985
|
|
15,905
|
Life
Sciences Tools &
Services—1.1% |
|
|
| Avantor,
Inc. Series A, 6.250% |
259,735
|
|
32,703
|
| Machinery—1.9%
|
|
|
| Colfax
Corp., 5.750% |
88,280
|
|
16,470
|
| RBC
Bearings, Inc. Series A, 5.000% |
153,120
|
|
17,068
|
| Stanley
Black & Decker, Inc., 5.250% |
214,275
|
|
22,550
|
| |
|
|
56,088
|
| |
|
|
|
| |
| Pharmaceuticals—0.5%
|
|
|
| Elanco
Animal Health, Inc., 5.000% |
320,135
|
|
15,965
|
| |
Shares
|
|
Value
|
| |
|
|
|
| Professional
Services—0.5% |
|
|
| Clarivate
plc Series A, 5.250% |
153,815
|
|
$
13,334 |
Semiconductors
& Semiconductor
Equipment—2.2% |
|
|
| Broadcom,
Inc. Series A, 8.000% |
42,075
|
|
64,460
|
Wireless
Telecommunication
Services—1.0% |
|
|
| T-Mobile
US 2020 Cash Mandatory Exchangeable Trust 144A, 5.250%(1) |
27,460
|
|
31,051
|
Total
Convertible Preferred Stocks
(Identified Cost $389,052) |
|
473,860
|
| |
|
|
|
| |
| |
|
|
|
| |
| |
Par
Value |
|
| Convertible
Bonds and Notes—80.5% |
| Airlines—1.2%
|
|
JetBlue
Airways Corp. 144A
0.500%, 4/1/26(1) |
$ 2,980
|
2,920
|
Southwest
Airlines Co.
1.250%, 5/1/25 |
21,895
|
32,706
|
| |
|
35,626
|
| |
|
|
| |
| Auto
Manufacturers—2.7% |
|
Ford
Motor Co. 144A
0.000%, 3/15/26(1) |
30,725
|
33,125
|
NIO,
Inc. 144A
0.500%, 2/1/27(1) |
17,025
|
13,859
|
Tesla,
Inc.
2.000%, 5/15/24 |
2,760
|
34,437
|
| |
|
81,421
|
| |
|
|
| |
| Biotechnology—1.7%
|
|
Bridgebio
Pharma, Inc. 144A
2.250%, 2/1/29(1) |
17,800
|
15,424
|
Exact
Sciences Corp.
0.375%, 3/15/27 |
14,505
|
16,427
|
Guardant
Health, Inc. 144A
0.000%, 11/15/27(1) |
9,790
|
11,209
|
NeoGenomics,
Inc.
0.250%, 1/15/28 |
7,185
|
7,266
|
| |
|
50,326
|
| |
|
|
| |
| Commercial
Services—4.1% |
|
Chegg,
Inc.
0.000%, 9/1/26 |
18,420
|
18,153
|
| |
Par
Value |
|
Value
|
| |
|
|
|
| Commercial
Services—continued |
|
|
Repay
Holdings Corp. 144A
0.000%, 2/1/26(1) |
$ 16,090
|
|
$ 15,537
|
| Shift4
Payments, Inc. |
|
|
|
| 144A
0.000%, 12/15/25(1) |
21,750
|
|
26,125
|
| 144A
0.500%, 8/1/27(1) |
5,875
|
|
5,831
|
| Square,
Inc. |
|
|
|
| 0.500%,
5/15/23 |
3,055
|
|
9,396
|
| 144A
0.000%, 5/1/26(1) |
14,520
|
|
16,632
|
| 144A
0.250%, 11/1/27(1) |
28,035
|
|
33,055
|
| |
|
|
124,729
|
| |
|
|
|
| |
| Computers—2.7%
|
|
|
CyberArk
Software Ltd.
0.000%, 11/15/24 |
12,735
|
|
15,096
|
Lumentum
Holdings, Inc.
0.500%, 12/15/26 |
8,540
|
|
9,380
|
Pure
Storage, Inc.
0.125%, 4/15/23 |
27,030
|
|
31,263
|
Zscaler,
Inc.
0.125%, 7/1/25 |
13,350
|
|
24,346
|
| |
|
|
80,085
|
| |
|
|
|
| |
| Cosmetics
& Personal Care—0.8% |
|
|
Beauty
Health Co. (The) 144A
1.250%, 10/1/26(1) |
22,515
|
|
24,879
|
| Diversified
Financial Services—2.8% |
|
|
Coinbase
Global, Inc. 144A
0.500%, 6/1/26(1) |
23,985
|
|
23,973
|
Hannon
Armstrong Sustainable Infrastructure Capital, Inc.
0.000%, 8/15/23 |
12,425
|
|
14,916
|
SoFi
Technologies, Inc. 144A
0.000%, 10/15/26(1) |
22,105
|
|
22,644
|
Upstart
Holdings, Inc. 144A
0.250%, 8/15/26(1) |
15,525
|
|
21,289
|
| |
|
|
82,822
|
| |
|
|
|
| |
| Electronics—0.3%
|
|
|
II-VI,
Inc.
0.250%, 9/1/22 |
6,905
|
|
9,170
|
See Notes to Financial Statements
AllianzGI Convertible
Fund
SCHEDULE OF INVESTMENTS (Continued)
September 30, 2021
($ reported in
thousands)
| |
Par
Value |
|
Value
|
| |
|
|
|
| Energy-Alternate
Sources—1.6% |
|
|
| Enphase
Energy, Inc. |
|
|
|
| 144A
0.000%, 3/1/26(1) |
$ 17,580
|
|
$ 16,393
|
| 144A
0.000%, 3/1/28(1) |
18,870
|
|
17,455
|
Sunnova
Energy International, Inc. 144A
0.250%, 12/1/26(1) |
13,090
|
|
14,910
|
| |
|
|
48,758
|
| |
|
|
|
| |
| Entertainment—3.2%
|
|
|
DraftKings,
Inc. 144A
0.000%, 3/15/28(1) |
39,010
|
|
34,348
|
Live
Nation Entertainment, Inc.
2.000%, 2/15/25 |
34,455
|
|
39,486
|
Vail
Resorts, Inc. 144A
0.000%, 1/1/26(1) |
21,850
|
|
23,325
|
| |
|
|
97,159
|
| |
|
|
|
| |
Equity
Real Estate Investment Trusts
(REITs)—0.7% |
|
|
Pebblebrook
Hotel Trust
1.750%, 12/15/26 |
18,195
|
|
20,315
|
| Healthcare-Products—4.9%
|
|
|
CONMED
Corp.
2.625%, 2/1/24 |
9,175
|
|
14,181
|
Envista
Holdings Corp.
2.375%, 6/1/25 |
11,260
|
|
23,360
|
Insulet
Corp.
0.375%, 9/1/26 |
15,060
|
|
20,943
|
Natera,
Inc.
2.250%, 5/1/27 |
8,975
|
|
26,835
|
Novocure
Ltd. 144A
0.000%, 11/1/25(1) |
14,050
|
|
14,949
|
Omnicell,
Inc.
0.250%, 9/15/25 |
17,500
|
|
27,908
|
Repligen
Corp.
0.375%, 7/15/24 |
7,875
|
|
19,915
|
| |
|
|
148,091
|
| |
|
|
|
| |
| Healthcare-Services—1.8%
|
|
|
Accolade,
Inc. 144A
0.500%, 4/1/26(1) |
12,380
|
|
13,603
|
Anthem,
Inc.
2.750%, 10/15/42 |
2,815
|
|
14,858
|
Oak
Street Health, Inc. 144A
0.000%, 3/15/26(1) |
15,755
|
|
14,243
|
Teladoc
Health, Inc.
1.250%, 6/1/27 |
11,095
|
|
11,144
|
| |
|
|
53,848
|
| |
|
|
|
| |
| Internet—17.9%
|
|
|
Airbnb,
Inc. 144A
0.000%, 3/15/26(1) |
30,805
|
|
30,266
|
| |
Par
Value |
|
Value
|
| |
|
|
|
| Internet—continued
|
|
|
Booking
Holdings, Inc.
0.750%, 5/1/25 |
$ 16,830
|
|
$ 24,715
|
| Etsy,
Inc. |
|
|
|
| 0.125%,
9/1/27 |
21,030
|
|
27,644
|
| 144A
0.250%, 6/15/28(1) |
26,050
|
|
29,554
|
Expedia
Group, Inc. 144A
0.000%, 2/15/26(1) |
14,745
|
|
15,919
|
FireEye,
Inc.
0.875%, 6/1/24 |
14,050
|
|
14,937
|
Match
Group Financeco 2, Inc. 144A
0.875%, 6/15/26(1) |
24,300
|
|
45,562
|
Match
Group Financeco 3, Inc. 144A
2.000%, 1/15/30(1) |
1,340
|
|
2,708
|
NortonLifeLock,
Inc. 144A
2.000%, 8/15/22(1) |
10,605
|
|
13,543
|
Okta,
Inc.
0.375%, 6/15/26 |
18,860
|
|
23,028
|
| Palo
Alto Networks, Inc. |
|
|
|
| 0.750%,
7/1/23 |
10,830
|
|
19,682
|
| 0.375%,
6/1/25 |
27,720
|
|
45,768
|
Sea
Ltd.
0.250%, 9/15/26 |
22,135
|
|
22,401
|
Shopify,
Inc.
0.125%, 11/1/25 |
19,940
|
|
24,407
|
| Snap,
Inc. |
|
|
|
| 0.750%,
8/1/26 |
3,695
|
|
12,053
|
| 144A
0.000%, 5/1/27(1) |
41,075
|
|
47,198
|
TechTarget,
Inc. 144A
0.125%, 12/15/25(1) |
11,415
|
|
15,088
|
| Twitter,
Inc. |
|
|
|
| 0.250%,
6/15/24 |
10,935
|
|
13,769
|
| 144A
0.000%, 3/15/26(1) |
16,170
|
|
15,011
|
Uber
Technologies, Inc. 144A
0.000%, 12/15/25(1) |
34,255
|
|
33,317
|
Upwork,
Inc. 144A
0.250%, 8/15/26(1) |
14,890
|
|
15,172
|
| Wayfair,
Inc. |
|
|
|
| 0.625%,
10/1/25 |
14,665
|
|
14,658
|
| 1.000%,
8/15/26 |
3,565
|
|
6,608
|
Zendesk,
Inc.
0.625%, 6/15/25 |
10,215
|
|
12,988
|
Zillow
Group, Inc.
2.750%, 5/15/25 |
8,935
|
|
13,911
|
| |
|
|
539,907
|
| |
|
|
|
| |
| Iron
& Steel—0.4% |
|
|
Cleveland-Cliffs,
Inc.
1.500%, 1/15/25 |
4,485
|
|
11,486
|
| Leisure
Time—2.1% |
|
|
Callaway
Golf Co.
2.750%, 5/1/26 |
11,460
|
|
20,048
|
| |
Par
Value |
|
Value
|
| |
|
|
|
| Leisure
Time—continued |
|
|
NCL
Corp., Ltd.
5.375%, 8/1/25 |
$ 9,230
|
|
$ 15,755
|
Royal
Caribbean Cruises Ltd. 144A
2.875%, 11/15/23(1) |
21,850
|
|
28,241
|
| |
|
|
64,044
|
| |
|
|
|
| |
| Machinery-Diversified—1.5%
|
|
|
Chart
Industries, Inc. 144A
1.000%, 11/15/24(1) |
6,985
|
|
22,801
|
Middleby
Corp. (The)
1.000%, 9/1/25 |
14,440
|
|
20,599
|
| |
|
|
43,400
|
| |
|
|
|
| |
| Media—3.1%
|
|
|
| DISH
Network Corp. |
|
|
|
| 3.375%,
8/15/26 |
13,770
|
|
14,314
|
| 144A
0.000%, 12/15/25(1) |
23,570
|
|
28,166
|
Liberty
Broadband Corp. 144A
2.750%, 9/30/50(1) |
27,640
|
|
29,178
|
Liberty
Media Corp.
1.375%, 10/15/23 |
16,140
|
|
21,974
|
| |
|
|
93,632
|
| |
|
|
|
| |
| Mining—0.8%
|
|
|
MP
Materials Corp. 144A
0.250%, 4/1/26(1) |
13,610
|
|
13,812
|
SSR
Mining, Inc.
2.500%, 4/1/39 |
10,010
|
|
11,418
|
| |
|
|
25,230
|
| |
|
|
|
| |
| Oil,
Gas & Consumable Fuels—2.0% |
|
|
EQT
Corp.
1.750%, 5/1/26 |
14,355
|
|
22,631
|
Pioneer
Natural Resources Co.
0.250%, 5/15/25 |
22,755
|
|
36,726
|
| |
|
|
59,357
|
| |
|
|
|
| |
| Pharmaceuticals—2.6%
|
|
|
| Dexcom,
Inc. |
|
|
|
| 0.750%,
12/1/23 |
2,785
|
|
9,258
|
| 0.250%,
11/15/25 |
43,015
|
|
50,973
|
Jazz
Investments I Ltd.
2.000%, 6/15/26 |
14,840
|
|
17,131
|
| |
|
|
77,362
|
| |
|
|
|
| |
| Private
Equity—0.7% |
|
|
Digitalbridge
Operating Co. LLC 144A
5.750%, 7/15/25(1) |
7,660
|
|
21,047
|
See Notes to Financial Statements
AllianzGI Convertible
Fund
SCHEDULE OF INVESTMENTS (Continued)
September 30, 2021
($ reported in
thousands)
| |
Par
Value |
|
Value
|
| |
|
|
|
| Retail—1.7%
|
|
|
Burlington
Stores, Inc.
2.250%, 4/15/25 |
$ 15,860
|
|
$ 23,037
|
Dick’s
Sporting Goods, Inc.
3.250%, 4/15/25 |
4,440
|
|
16,287
|
RH
0.000%, 9/15/24 |
3,750
|
|
11,792
|
| |
|
|
51,116
|
| |
|
|
|
| |
| Semiconductors—2.9%
|
|
|
Cree,
Inc.
1.750%, 5/1/26 |
3,150
|
|
5,816
|
MACOM
Technology Solutions Holdings, Inc. 144A
0.250%, 3/15/26(1) |
21,900
|
|
23,214
|
Microchip
Technology, Inc.
0.125%, 11/15/24 |
27,560
|
|
31,155
|
ON
Semiconductor Corp. 144A
0.000%, 5/1/27(1) |
23,860
|
|
28,231
|
| |
|
|
88,416
|
| |
|
|
|
| |
| Software—15.5%
|
|
|
Avalara,
Inc. 144A
0.250%, 8/1/26(1) |
21,515
|
|
22,087
|
Bentley
Systems, Inc. 144A
0.125%, 1/15/26(1) |
15,220
|
|
17,511
|
| Bill.com
Holdings, Inc. |
|
|
|
| 144A
0.000%, 12/1/25(1) |
10,880
|
|
19,316
|
| 144A
0.000%, 4/1/27(1) |
14,095
|
|
14,773
|
Blackline,
Inc. 144A
0.000%, 3/15/26(1) |
18,270
|
|
17,954
|
Cerence,
Inc.
3.000%, 6/1/25 |
5,340
|
|
14,237
|
Ceridian
HCM Holding, Inc. 144A
0.250%, 3/15/26(1) |
14,120
|
|
15,207
|
Cloudflare,
Inc. 144A
0.000%, 8/15/26(1) |
25,220
|
|
24,337
|
Coupa
Software, Inc.
0.375%, 6/15/26 |
16,220
|
|
17,507
|
| |
Par
Value |
|
Value
|
| |
|
|
|
| Software—continued
|
|
|
Datadog,
Inc.
0.125%, 6/15/25 |
$ 9,165
|
|
$
15,131 |
DocuSign,
Inc. 144A
0.000%, 1/15/24(1) |
19,820
|
|
20,672
|
Five9,
Inc.
0.500%, 6/1/25 |
14,440
|
|
19,473
|
HubSpot,
Inc.
0.375%, 6/1/25 |
10,050
|
|
24,322
|
Jamf
Holding Corp. 144A
0.125%, 9/1/26(1) |
20,730
|
|
21,572
|
MongoDB,
Inc.
0.250%, 1/15/26 |
11,490
|
|
26,181
|
Nutanix,
Inc. 144A
0.250%, 10/1/27(1) |
40,142
|
|
39,529
|
Porch
Group, Inc. 144A
0.750%, 9/15/26(1) |
30,545
|
|
30,430
|
ServiceNow,
Inc.
0.000%, 6/1/22 |
1,155
|
|
5,326
|
| Splunk,
Inc. |
|
|
|
| 0.500%,
9/15/23 |
12,015
|
|
14,043
|
| 1.125%,
9/15/25 |
11,830
|
|
14,440
|
Tyler
Technologies, Inc. 144A
0.250%, 3/15/26(1) |
25,270
|
|
27,648
|
Workday,
Inc.
0.250%, 10/1/22 |
15,845
|
|
27,125
|
Workiva,
Inc.
1.125%, 8/15/26 |
1,130
|
|
2,099
|
Zynga,
Inc. 144A
0.000%, 12/15/26(1) |
16,415
|
|
15,851
|
| |
|
|
466,771
|
| |
|
|
|
| |
| Telecommunications—0.8%
|
|
|
Viavi
Solutions, Inc.
1.000%, 3/1/24 |
18,295
|
|
23,783
|
Total
Convertible Bonds and Notes
(Identified Cost $2,116,519) |
|
2,422,780
|
| |
|
|
|
| |
| |
|
|
|
| |
Total
Long-Term Investments—96.2%
(Identified Cost $2,505,571) |
|
2,896,640
|
| |
|
|
|
| |
| |
|
|
|
| |
| |
Shares
|
|
Value
|
| Short-Term
Investment—4.6% |
| Money
Market Mutual Fund—4.6% |
| Dreyfus
Government Cash Management Fund - Institutional Shares (seven-day effective yield 0.030%)(2) |
140,257,328
|
|
$
140,257 |
Total
Short-Term Investment
(Identified Cost $140,257) |
|
140,257
|
| |
|
|
|
| |
| |
|
|
|
| |
TOTAL
INVESTMENTS—100.8%
(Identified Cost $2,645,828) |
|
$3,036,897
|
| Other
assets and liabilities, net—(0.8)% |
|
(24,701)
|
| NET
ASSETS—100.0% |
|
$3,012,196
|
| Abbreviations:
|
| LLC
|
Limited
Liability Company |
| REIT
|
Real
Estate Investment Trust |
| Footnote
Legend: |
|
(1) |
Security
exempt from registration under Rule 144A of the Securities Act of 1933. These securities may be resold in transactions exempt from registration, normally to qualified institutional buyers. At September 30, 2021, these securities amounted to a value
of $1,204,766 or 40.0% of net assets. |
|
(2) |
Shares
of this fund are publicly offered, and its prospectus and annual report are publicly available. |
| Country
Weightings (Unaudited)† |
| United
States |
93%
|
| Jersey
|
2
|
| Canada
|
2
|
| Cayman
Islands |
1
|
| Bermuda
|
1
|
| Liberia
|
1
|
| Total
|
100%
|
|
† % of total investments as of September 30, 2021. |
For information regarding the abbreviations, see the Key
Investment Terms starting on page 6.
See Notes to Financial Statements
AllianzGI Convertible
Fund
SCHEDULE OF INVESTMENTS (Continued)
September 30, 2021
($ reported in
thousands)
The following table summarizes the market value of the
Fund’s investments as of September 30, 2021, based on the inputs used to value them (See Security Valuation Note 2A in the Notes to Financial Statements):
| |
Total
Value at
September 30, 2021 |
|
Level
1
Quoted Prices |
|
Level
2
Significant
Observable
Inputs |
| Assets:
|
|
|
|
|
|
| Debt
Securities: |
|
|
|
|
|
| Convertible
Bonds and Notes |
$2,422,780
|
|
$
— |
|
$2,422,780
|
| Equity
Securities: |
|
|
|
|
|
| Convertible
Preferred Stocks |
473,860
|
|
429,737
|
|
44,123
|
| Money
Market Mutual Fund |
140,257
|
|
140,257
|
|
—
|
| Total
Investments |
$3,036,897
|
|
$569,994
|
|
$2,466,903
|
There were no securities
valued using significant unobservable inputs (Level 3) at September 30, 2021.
There were no transfers into or out of Level 3 related
to securities held at September 30, 2021.
See Notes to Financial Statements
AllianzGI Core Plus Bond
Fund
SCHEDULE OF INVESTMENTS
September 30, 2021
($ reported in thousands)
| |
Par
Value |
|
Value
|
| U.S.
Government Securities—15.5% |
| U.S.
Treasury Bonds |
|
|
|
| 1.750%,
8/15/41 |
$ 1,297
|
|
$
1,240 |
| 2.375%,
5/15/51 |
1,748
|
|
1,866
|
| U.S.
Treasury Notes |
|
|
|
| 1.500%,
1/31/22(1)(2) |
1,250
|
|
1,256
|
| 0.375%,
9/15/24 |
750
|
|
747
|
| 0.750%,
8/31/26 |
2,113
|
|
2,090
|
| 1.250%,
8/15/31 |
1,222
|
|
1,192
|
Total
U.S. Government Securities
(Identified Cost $8,457) |
|
8,391
|
| |
|
|
|
| |
| |
|
|
|
| |
| Foreign
Government Security—0.4% |
United
Mexican States
4.500%, 1/31/50 |
200
|
|
204
|
Total
Foreign Government Security
(Identified Cost $215) |
|
204
|
| |
|
|
|
| |
| |
|
|
|
| |
| Mortgage-Backed
Securities—16.3% |
| Agency—16.3%
|
|
|
| Federal
Home Loan Mortgage Corp. |
|
|
|
| TBA,
2.000%(3) |
2,255
|
|
2,257
|
| TBA,
2.500%(3) |
1,350
|
|
1,389
|
| 3.000%,
1/1/50 |
619
|
|
656
|
| Federal
National Mortgage Association |
|
|
|
| 2.500%,
11/1/31 |
246
|
|
259
|
| 2.500%,
7/1/40 |
314
|
|
324
|
| 3.500%,
1/1/46 |
800
|
|
867
|
| 3.000%,
7/1/50 |
134
|
|
142
|
| 2.500%,
12/1/50 |
1,204
|
|
1,249
|
| 2.000%,
2/1/51 |
766
|
|
776
|
| 2.500%,
3/1/51 |
867
|
|
898
|
| |
|
|
8,817
|
| |
|
|
|
| |
Total
Mortgage-Backed Securities
(Identified Cost $8,726) |
|
8,817
|
| |
|
|
|
| |
| |
|
|
|
| |
| Asset-Backed
Securities—31.3% |
| Automobiles—12.0%
|
|
|
| Carmax
Auto Owner Trust |
|
|
|
2019-3,
C
2.600%, 6/16/25 |
400
|
|
413
|
2020-1,
A4
2.030%, 6/16/25 |
585
|
|
603
|
2021-1,
A4
0.530%, 10/15/26 |
135
|
|
135
|
2021-4,
A2A
0.240%, 11/15/24 |
500
|
|
500
|
Chesapeake
Funding II LLC 2019-2A, C 144A
2.270%, 9/15/31(4) |
400
|
|
408
|
| |
Par
Value |
|
Value
|
| |
|
|
|
| Automobiles—continued
|
|
|
| Ford
Credit Auto Owner Trust |
|
|
|
2018-1,
A 144A
3.190%, 7/15/31(4) |
$ 260
|
|
$ 278
|
2020-1,
A 144A
2.040%, 8/15/31(4) |
232
|
|
240
|
| GM
Financial Automobile Leasing Trust |
|
|
|
2019-3,
C
2.350%, 7/20/23 |
400
|
|
403
|
2021-2,
A3
0.340%, 5/20/24 |
180
|
|
180
|
| GM
Financial Consumer Automobile Receivables Trust |
|
|
|
2018-4,
A4
3.320%, 6/17/24 |
186
|
|
190
|
2019-4,
A3
1.750%, 7/16/24 |
137
|
|
138
|
2020-2,
A3
1.490%, 12/16/24 |
70
|
|
71
|
2021-3,
A3
0.480%, 6/16/26 |
100
|
|
100
|
| Hyundai
Auto Receivables Trust |
|
|
|
2018-A,
A4
2.940%, 6/17/24 |
157
|
|
158
|
2019-A,
A3
2.660%, 6/15/23 |
593
|
|
597
|
2019-B,
C
2.400%, 6/15/26 |
600
|
|
621
|
2021-B,
A3
0.380%, 1/15/26 |
145
|
|
145
|
Nissan
Auto Receivables Owner Trust 2021-A, A3
0.330%, 10/15/25 |
355
|
|
354
|
Tesla
Auto Lease Trust 2021-A, A3 144A
0.560%, 3/20/25(4) |
150
|
|
150
|
| Toyota
Auto Receivables Owner Trust |
|
|
|
2020-C,
A3
0.440%, 10/15/24 |
310
|
|
311
|
2021-B,
A3
0.260%, 11/17/25 |
500
|
|
499
|
| |
|
|
6,494
|
| |
|
|
|
| |
| Collateralized
Loan Obligations—2.8% |
|
|
| Bain
Capital Credit CLO Ltd. |
|
|
|
2018-1A,
A1 (3 month LIBOR + 0.960%) 144A
1.098%, 4/23/31(4)(5) |
80
|
|
80
|
2021-3A,
A (3 month LIBOR + 1.160%, Cap N/A, Floor 1.160%) 144A
1.346%, 7/24/34(4)(5) |
500
|
|
500
|
| |
Par
Value |
|
Value
|
| |
|
|
|
Collateralized
Loan
Obligations—continued |
|
|
Carlyle
US CLO Ltd. 2021-6A, A1 (3 month LIBOR + 1.160%, Cap N/A, Floor 1.160%) 144A
1.270%, 7/15/34(4)(5) |
$ 250
|
|
$ 250
|
Venture
42 CLO Ltd. 2021-42A, A1A (3 month LIBOR + 1.130%, Cap N/A, Floor 1.130%) 144A
1.311%, 4/15/34(4)(5) |
705
|
|
705
|
| |
|
|
1,535
|
| |
|
|
|
| |
| Consumer
Loans—0.6% |
|
|
OneMain
Financial Issuance Trust 2021-1A, A1 144A
1.550%, 6/16/36(4) |
300
|
|
299
|
| Credit
Card—3.9% |
|
|
| American
Express Credit Account Master Trust |
|
|
|
2018-3,
A (1 month LIBOR + 0.320%)
0.404%, 10/15/25(5) |
100
|
|
100
|
2018-5,
A (1 month LIBOR + 0.340%)
0.424%, 12/15/25(5) |
500
|
|
502
|
Citibank
Credit Card Issuance Trust 2017-A5, A5 (1 month LIBOR + 0.620%)
0.704%, 4/22/26(5) |
715
|
|
723
|
Discover
Card Execution Note Trust 2017-A7, A7 (1 month LIBOR + 0.360%)
0.444%, 4/15/25(5) |
800
|
|
803
|
| |
|
|
2,128
|
| |
|
|
|
| |
| Equipment—3.2%
|
|
|
CNH
Equipment Trust 2019-B, A3
2.520%, 8/15/24 |
55
|
|
55
|
| HPEFS
Equipment Trust |
|
|
|
2019-1A,
A3 144A
2.210%, 9/20/29(4) |
91
|
|
91
|
2019-1A,
C 144A
2.490%, 9/20/29(4) |
400
|
|
405
|
2021-1A,
A3 144A
0.320%, 3/20/31(4) |
700
|
|
699
|
2021-1A,
C 144A
0.750%, 3/20/31(4) |
500
|
|
500
|
| |
|
|
1,750
|
| |
|
|
|
| |
See Notes to Financial Statements
AllianzGI Core Plus Bond
Fund
SCHEDULE OF INVESTMENTS (Continued)
September 30, 2021
($ reported in
thousands)
| |
Par
Value |
|
Value
|
| |
|
|
|
| Other—8.8%
|
|
|
Domino’s
Pizza Master Issuer LLC 2021-1A, A2I 144A
2.662%, 4/25/51(4) |
$ 499
|
|
$
513 |
MVW
LLC 2019-2A, A 144A
2.220%, 10/20/38(4) |
307
|
|
312
|
| United
States Small Business Administration |
|
|
|
2018-20A,
1
2.920%, 1/1/38 |
183
|
|
194
|
2018-20E,
1
3.500%, 5/1/38 |
233
|
|
253
|
2018-20G,
1
3.540%, 7/1/38 |
204
|
|
222
|
2018-20I,
1
3.530%, 9/1/38 |
291
|
|
316
|
2019-20A,
1
3.370%, 1/1/39 |
226
|
|
247
|
2019-20B,
1
3.260%, 2/1/39 |
88
|
|
96
|
2019-20C,
1
3.200%, 3/1/39 |
97
|
|
106
|
2019-20F,
1
2.600%, 6/1/39 |
34
|
|
36
|
2019-25G,
1
2.690%, 7/1/44 |
132
|
|
139
|
2020-25L,
1
1.210%, 12/1/45 |
147
|
|
143
|
2021-25D,
1
1.660%, 4/1/46 |
515
|
|
517
|
2021-25I,
1
1.560%, 9/1/46 |
250
|
|
248
|
Vantage
Data Centers LLC 2020-1A, A2 144A
1.645%, 9/15/45(4) |
250
|
|
249
|
Verizon
Master Trust 2021-1, A
0.500%, 5/20/27 |
340
|
|
339
|
| Verizon
Owner Trust |
|
|
|
2019-C,
A1A
1.940%, 4/22/24 |
755
|
|
762
|
2020-C,
A
0.410%, 4/21/25 |
100
|
|
100
|
| |
|
|
4,792
|
| |
|
|
|
| |
Total
Asset-Backed Securities
(Identified Cost $16,836) |
|
16,998
|
| |
|
|
|
| |
| |
|
|
|
| |
| Corporate
Bonds and Notes—41.9% |
| Basic
Materials—1.1% |
|
|
ArcelorMittal
S.A.
7.000%, 10/15/39 |
100
|
|
141
|
Braskem
Netherlands Finance BV 144A
4.500%, 1/31/30(4) |
200
|
|
213
|
| |
Par
Value |
|
Value
|
| |
|
|
|
| Basic
Materials—continued |
|
|
Fibria
Overseas Finance Ltd.
5.500%, 1/17/27 |
$ 105
|
|
$ 120
|
Suzano
Austria GmbH
3.750%, 1/15/31 |
140
|
|
144
|
| |
|
|
618
|
| |
|
|
|
| |
| Communications—5.4%
|
|
|
Amazon.com,
Inc.
3.250%, 5/12/61 |
145
|
|
154
|
AT&T,
Inc.
3.100%, 2/1/43 |
326
|
|
313
|
| Charter
Communications Operating LLC |
|
|
|
| 2.250%,
1/15/29 |
170
|
|
170
|
| 5.375%,
4/1/38 |
110
|
|
133
|
Discovery
Communications LLC
5.200%, 9/20/47 |
85
|
|
106
|
Netflix,
Inc.
4.875%, 4/15/28 |
255
|
|
294
|
Omnicom
Group, Inc.
2.600%, 8/1/31 |
193
|
|
196
|
Time
Warner Entertainment Co. LP
8.375%, 7/15/33 |
95
|
|
141
|
T-Mobile
USA, Inc.
2.250%, 2/15/26 |
213
|
|
215
|
| Verizon
Communications, Inc. |
|
|
|
| 4.125%,
3/16/27 |
190
|
|
216
|
| 2.100%,
3/22/28 |
193
|
|
196
|
| 4.400%,
11/1/34 |
110
|
|
130
|
| ViacomCBS,
Inc. |
|
|
|
| 4.200%,
5/19/32 |
134
|
|
153
|
| 4.375%,
3/15/43 |
80
|
|
92
|
| 6.250%,
2/28/57 |
127
|
|
145
|
Vodafone
Group plc
5.125%, 6/4/81 |
180
|
|
185
|
Walt
Disney Co. (The)
7.300%, 4/30/28 |
85
|
|
113
|
| |
|
|
2,952
|
| |
|
|
|
| |
| Consumer,
Cyclical—5.4% |
|
|
American
Airlines, Inc. 144A
5.500%, 4/20/26(4) |
250
|
|
263
|
| Delta
Air Lines, Inc. |
|
|
|
| 144A
7.000%, 5/1/25(4) |
274
|
|
319
|
| 144A
4.500%, 10/20/25(4) |
184
|
|
197
|
Ford
Motor Credit Co. LLC
4.140%, 2/15/23 |
530
|
|
543
|
General
Motors Co.
5.150%, 4/1/38 |
160
|
|
191
|
| Hasbro,
Inc. |
|
|
|
| 6.350%,
3/15/40 |
130
|
|
180
|
| 5.100%,
5/15/44 |
105
|
|
127
|
| |
Par
Value |
|
Value
|
| |
|
|
|
| Consumer,
Cyclical—continued |
|
|
Lowe’s
Cos., Inc.
2.800%, 9/15/41 |
$ 167
|
|
$ 162
|
Mileage
Plus Holdings LLC 144A
6.500%, 6/20/27(4) |
710
|
|
772
|
United
Airlines, Inc. 144A
4.625%, 4/15/29(4) |
140
|
|
145
|
| |
|
|
2,899
|
| |
|
|
|
| |
| Consumer,
Non-cyclical—4.6% |
|
|
Amgen,
Inc.
2.000%, 1/15/32 |
320
|
|
308
|
Anheuser-Busch
InBev Finance, Inc.
4.000%, 1/17/43 |
180
|
|
198
|
Celgene
Corp.
5.000%, 8/15/45 |
129
|
|
151
|
Centene
Corp.
2.450%, 7/15/28 |
222
|
|
223
|
Cigna
Corp.
4.800%, 8/15/38 |
120
|
|
147
|
CVS
Health Corp.
2.700%, 8/21/40 |
295
|
|
281
|
HCA,
Inc.
5.875%, 2/15/26 |
230
|
|
264
|
PerkinElmer,
Inc.
1.900%, 9/15/28 |
165
|
|
164
|
Pilgrim’s
Pride Corp. 144A
3.500%, 3/1/32(4) |
47
|
|
48
|
STERIS
Irish FinCo Un-Ltd Co.
2.700%, 3/15/31 |
190
|
|
194
|
Takeda
Pharmaceutical Co. Ltd.
3.175%, 7/9/50 |
130
|
|
132
|
Trustees
of Tufts College
3.099%, 8/15/51 |
190
|
|
200
|
Viatris,
Inc. 144A
4.000%, 6/22/50(4) |
185
|
|
197
|
| |
|
|
2,507
|
| |
|
|
|
| |
| Energy—4.0%
|
|
|
BP
Capital Markets plc
4.875%(3) |
208
|
|
229
|
El
Paso Natural Gas Co. LLC
8.375%, 6/15/32 |
125
|
|
183
|
| Energy
Transfer LP |
|
|
|
| 6.500%,
2/1/42 |
75
|
|
97
|
Series
G
7.125%(3) |
136
|
|
143
|
Series
H
6.500%(3) |
130
|
|
135
|
| Hess
Corp. |
|
|
|
| 7.125%,
3/15/33 |
87
|
|
118
|
| 5.600%,
2/15/41 |
120
|
|
150
|
See Notes to Financial Statements
AllianzGI Core Plus Bond
Fund
SCHEDULE OF INVESTMENTS (Continued)
September 30, 2021
($ reported in
thousands)
| |
Par
Value |
|
Value
|
| |
|
|
|
| Energy—continued
|
|
|
NGPL
PipeCo LLC 144A
3.250%, 7/15/31(4) |
$ 115
|
|
$ 118
|
Northern
Natural Gas Co. 144A
3.400%, 10/16/51(4) |
231
|
|
235
|
Petroleos
Mexicanos
4.500%, 1/23/26 |
270
|
|
272
|
Plains
All American Pipeline LP Series B
6.125%(3) |
237
|
|
214
|
Targa
Resources Partners LP
5.500%, 3/1/30 |
240
|
|
262
|
| |
|
|
2,156
|
| |
|
|
|
| |
| Financials—9.2%
|
|
|
AerCap
Ireland Capital DAC
3.500%, 1/15/25 |
155
|
|
163
|
American
Express Co.
3.550%(3) |
95
|
|
97
|
American
International Group, Inc.
6.820%, 11/15/37 |
20
|
|
28
|
American
Tower Corp.
2.750%, 1/15/27 |
265
|
|
278
|
| Athene
Global Funding |
|
|
|
| 144A
2.550%, 6/29/25(4) |
82
|
|
85
|
| 144A
2.500%, 3/24/28(4) |
195
|
|
199
|
Berkshire
Hathaway Finance Corp.
2.850%, 10/15/50 |
88
|
|
87
|
Equinix,
Inc.
1.000%, 9/15/25 |
338
|
|
333
|
First
Horizon Corp.
4.000%, 5/26/25 |
406
|
|
443
|
GE
Capital International Funding Co. Unlimited Co.
4.418%, 11/15/35 |
200
|
|
240
|
| Global
Atlantic Fin Co. |
|
|
|
| 144A
3.125%, 6/15/31(4) |
160
|
|
162
|
| 144A
4.700%, 10/15/51(4) |
350
|
|
362
|
Huntington
Bancshares, Inc. Series F
5.625%(3) |
75
|
|
88
|
Huntington
Capital Trust I (3 month LIBOR + 0.700%)
0.826%, 2/1/27(5) |
107
|
|
104
|
Intercontinental
Exchange, Inc.
2.650%, 9/15/40 |
190
|
|
182
|
JPMorgan
Chase & Co. Series U (3 month LIBOR + 0.950%)
1.076%, 2/2/37(5) |
314
|
|
283
|
Liberty
Mutual Group, Inc. 144A
4.125%, 12/15/51(4) |
209
|
|
215
|
Lincoln
National Corp. (3 month LIBOR + 2.358%)
2.482%, 5/17/66(5) |
200
|
|
183
|
M&T
Bank Corp.
3.500%(3) |
114
|
|
113
|
| |
Par
Value |
|
Value
|
| |
|
|
|
| Financials—continued
|
|
|
| MetLife,
Inc. |
|
|
|
| 10.750%,
8/1/39 |
$ 154
|
|
$ 268
|
| 144A
9.250%, 4/8/38(4) |
55
|
|
84
|
NatWest
Group plc
3.073%, 5/22/28 |
200
|
|
212
|
New
York Life Insurance Co. 144A
4.450%, 5/15/69(4) |
110
|
|
138
|
Northwestern
Mutual Life Insurance Co. (The) 144A
3.850%, 9/30/47(4) |
140
|
|
160
|
Popular,
Inc.
6.125%, 9/14/23 |
295
|
|
317
|
State
Street Corp. (3 month LIBOR + 1.000%)
1.116%, 6/15/47(5) |
165
|
|
147
|
| |
|
|
4,971
|
| |
|
|
|
| |
| Industrials—1.9%
|
|
|
Avnet,
Inc.
3.000%, 5/15/31 |
185
|
|
185
|
| Boeing
Co. (The) |
|
|
|
| 7.950%,
8/15/24 |
135
|
|
161
|
| 4.875%,
5/1/25 |
125
|
|
139
|
| 3.625%,
2/1/31 |
335
|
|
359
|
Waste
Connections, Inc.
2.950%, 1/15/52 |
182
|
|
178
|
| |
|
|
1,022
|
| |
|
|
|
| |
| Technology—4.4%
|
|
|
| Analog
Devices, Inc. |
|
|
|
| 2.100%,
10/1/31 |
147
|
|
147
|
| 2.800%,
10/1/41 |
170
|
|
170
|
Apple,
Inc.
2.700%, 8/5/51 |
160
|
|
154
|
| Broadcom,
Inc. |
|
|
|
| 144A
1.950%, 2/15/28(4) |
146
|
|
144
|
| 144A
3.137%, 11/15/35(4) |
269
|
|
268
|
| 144A
3.500%, 2/15/41(4) |
109
|
|
108
|
Dell,
Inc.
7.100%, 4/15/28 |
115
|
|
148
|
Intel
Corp.
3.050%, 8/12/51 |
70
|
|
70
|
Leidos,
Inc.
7.125%, 7/1/32 |
44
|
|
60
|
MSCI,
Inc. 144A
3.625%, 11/1/31(4) |
375
|
|
390
|
NXP
B.V. 144A
3.400%, 5/1/30(4) |
215
|
|
233
|
salesforce.com,
Inc.
2.900%, 7/15/51 |
91
|
|
91
|
| VMware,
Inc. |
|
|
|
| 4.500%,
5/15/25 |
225
|
|
251
|
| 2.200%,
8/15/31 |
160
|
|
157
|
| |
|
|
2,391
|
| |
|
|
|
| |
| Utilities—5.9%
|
|
|
Boston
Gas Co. 144A
3.150%, 8/1/27(4) |
264
|
|
281
|
| |
Par
Value |
|
Value
|
| |
|
|
|
| Utilities—continued
|
|
|
Consolidated
Edison Co. of New York, Inc. Series 03-C
5.100%, 6/15/33 |
$ 89
|
|
$
106 |
Dominion
Energy, Inc. Series C
2.250%, 8/15/31 |
100
|
|
100
|
Duke
Energy Corp.
3.250%, 1/15/82 |
94
|
|
94
|
Edison
International Series A
5.375%(3) |
190
|
|
196
|
Enel
Finance International N.V 144A
2.250%, 7/12/31(4) |
200
|
|
197
|
Enel
Finance International N.V. 144A
2.650%, 9/10/24(4) |
200
|
|
210
|
| Jersey
Central Power & Light Co. |
|
|
|
| 6.150%,
6/1/37 |
85
|
|
113
|
| 144A
2.750%, 3/1/32(4) |
150
|
|
154
|
MidAmerican
Energy Co.
4.250%, 7/15/49 |
73
|
|
90
|
NextEra
Energy Capital Holdings, Inc.
1.900%, 6/15/28 |
230
|
|
230
|
Niagara
Mohawk Power Corp. 144A
1.960%, 6/27/30(4) |
170
|
|
165
|
NRG
Energy, Inc. 144A
2.450%, 12/2/27(4) |
260
|
|
264
|
| Pacific
Gas & Electric Co. |
|
|
|
| 4.500%,
12/15/41 |
45
|
|
44
|
| 4.950%,
7/1/50 |
190
|
|
202
|
PacifiCorp.
2.900%, 6/15/52 |
40
|
|
39
|
| Pennsylvania
Electric Co. |
|
|
|
| 6.150%,
10/1/38 |
125
|
|
167
|
| 144A
4.150%, 4/15/25(4) |
165
|
|
176
|
| 144A
3.250%, 3/15/28(4) |
80
|
|
84
|
Southern
California Edison Co.
3.900%, 12/1/41 |
96
|
|
98
|
Southern
Co. (The) Series A
3.750%, 9/15/51 |
193
|
|
197
|
| |
|
|
3,207
|
| |
|
|
|
| |
Total
Corporate Bonds and Notes
(Identified Cost $22,352) |
|
22,723
|
| |
|
|
|
| |
| |
|
|
|
| |
| |
Shares
|
|
| Preferred
Stocks—0.8% |
| Financials—0.8%
|
|
| Citigroup
Capital XIII (3 month LIBOR + 6.370%), 6.499%(5) |
10
(6) |
277
|
See Notes to Financial Statements
AllianzGI Core Plus Bond
Fund
SCHEDULE OF INVESTMENTS (Continued)
September 30, 2021
($ reported in
thousands)
| |
Shares
|
|
Value
|
| Financials—continued
|
|
|
| Truist
Financial Corp. Series Q, 5.100% |
160
(6) |
|
$
184 |
| |
|
|
461
|
| |
|
|
|
| |
Total
Preferred Stocks
(Identified Cost $434) |
|
461
|
| |
|
|
|
| |
| |
|
|
|
| |
Total
Long-Term Investments—106.2%
(Identified Cost $57,020) |
|
57,594
|
| |
|
|
|
| |
| |
|
|
|
| |
| Short-Term
Investment—2.0% |
| Money
Market Mutual Fund—2.0% |
| Dreyfus
Government Cash Management Fund - Institutional Shares (seven-day effective yield 0.030%) |
1,076,517
|
|
1,077
|
Total
Short-Term Investment
(Identified Cost $1,077) |
|
1,077
|
| |
|
|
|
| |
| |
|
|
|
| |
TOTAL
INVESTMENTS—108.2%
(Identified Cost $58,097) |
|
$58,671
|
| Other
assets and liabilities, net—(8.2)% |
|
(4,467)
|
| NET
ASSETS—100.0% |
|
$54,204
|
| Abbreviations:
|
| CDX.NA.HY
|
Credit
Default Swap Index North American High Yield |
| CLO
|
Collateralized
Loan Obligation |
| LIBOR
|
London
Interbank Offered Rate |
| LLC
|
Limited
Liability Company |
| LP
|
Limited
Partnership |
| MSCI
|
Morgan
Stanley Capital International |
| TBA
|
To
be announced |
| Footnote
Legend: |
|
(1) |
All
or a portion of the security is segregated as collateral for open swap contracts. |
|
(2) |
All
or a portion of the security is segregated as collateral for open futures contracts. |
|
(3) |
No
contractual maturity date. |
|
(4) |
Security
exempt from registration under Rule 144A of the Securities Act of 1933. These securities may be resold in transactions exempt from registration, normally to qualified institutional buyers. At September 30, 2021, these securities amounted to a value
of $12,265 or 22.6% of net assets. |
|
(5) |
Variable
rate security. Rate disclosed is as of September 30, 2021. Information in parenthesis represents benchmark and reference rate for each security. Certain variable rate securities are not based on a published reference rate and spread but are
determined by the issuer or agent and are based on current market conditions, or, for mortgage-backed securities, are impacted by the individual mortgages which are paying off over time. These securities do not indicate a reference rate and spread
in their descriptions. |
|
(6) |
Value
shown as par value. |
| Counterparties:
|
|
| ICE
|
Intercontinental
Exchange |
| Country
Weightings (Unaudited)† |
| United
States |
90%
|
| Cayman
Islands |
3
|
| Netherlands
|
3
|
| Ireland
|
1
|
| Puerto
Rico |
1
|
| Mexico
|
1
|
| United
Kingdom |
1
|
| Total
|
100%
|
|
† % of total investments as of September 30, 2021. |
| Exchange-Traded
Futures contracts as of September 30, 2021 were as follows: |
| Issue
|
Expiration
|
Contracts
Purchased/(Sold) |
Notional
Value |
Value
/
Unrealized
Appreciation |
|
Value
/
Unrealized
(Depreciation) |
| Long
Contracts: |
|
|
|
|
|
|
| U.S.
Treasury Long Bond Future |
December
2021 |
4
|
$
637 |
$—
|
|
$
(16) |
| 2
Year U.S. Treasury Note Future |
December
2021 |
7
|
1,541
|
—
|
|
(2)
|
| 5
Year U.S. Treasury Note Future |
December
2021 |
26
|
3,191
|
—
|
|
(20)
|
| |
|
|
|
$—
|
|
$
(38) |
| Short
Contracts: |
|
|
|
|
|
|
| 10
Year U.S. Treasury Ultra Note Future |
December
2021 |
(17)
|
(2,469)
|
48
|
|
—
|
| Total
|
|
|
|
$48
|
|
$
(38) |
| Centrally
cleared credit default swap - buy protection(1) outstanding as of September 30, 2021 were as follows: |
| Reference
Entity |
Payment
Frequency |
Counterparty
|
Fixed
Rate |
Expiration
Date |
Notional
Amount(2) |
Value
|
Premiums
Paid
(Received) |
Unrealized
Appreciation |
Unrealized
(Depreciation) |
| CDX.NA.HY.37
(3) |
Quarterly
|
ICE
|
5.000%
|
12/20/26
|
$(5,235)
|
$(482)
|
$
(493) |
$11
|
$
— |
| Citigroup,
Inc. Senior |
Quarterly
|
ICE
|
1.000%
|
12/20/26
|
(1,000)
|
(24)
|
(25)
|
1
|
—
|
| Hess
Corp. Senior |
Quarterly
|
ICE
|
1.000%
|
12/20/26
|
(560)
|
1
|
5
|
—
|
(4)
|
| International
Business Machines Corp. Senior |
Quarterly
|
ICE
|
1.000%
|
12/20/26
|
(1,385)
|
(42)
|
(42)
|
—
|
—
(4) |
For information regarding the abbreviations, see the Key Investment Terms
starting on page 6.
See Notes to Financial Statements
AllianzGI Core Plus Bond
Fund
SCHEDULE OF INVESTMENTS (Continued)
September 30, 2021
($ reported in
thousands)
| Centrally
cleared credit default swap - buy protection(1) outstanding as of September 30, 2021 were as follows: |
| Reference
Entity |
Payment
Frequency |
Counterparty
|
Fixed
Rate |
Expiration
Date |
Notional
Amount(2) |
Value
|
|
Premiums
Paid
(Received) |
|
Unrealized
Appreciation |
|
Unrealized
(Depreciation) |
| Lincoln
National Corp. Senior |
Quarterly
|
ICE
|
1.000%
|
12/20/26
|
$
(510) |
$
(7) |
|
$
(6) |
|
$—
|
|
$
(1) |
| Morgan
Stanley Senior |
Quarterly
|
ICE
|
1.000%
|
06/20/26
|
(610)
|
(13)
|
|
(11)
|
|
—
|
|
(2)
|
| Simon
Property Group LP Senior |
Quarterly
|
ICE
|
1.000%
|
12/20/26
|
(665)
|
(11)
|
|
(10)
|
|
—
|
|
(1)
|
| Southwest
Airlines Co. Senior |
Quarterly
|
ICE
|
1.000%
|
12/20/26
|
(500)
|
(3)
|
|
(1)
|
|
—
|
|
(2)
|
| Valero
Energy Corp. Senior |
Quarterly
|
ICE
|
1.000%
|
12/20/26
|
(520)
|
(2)
|
|
1
|
|
—
|
|
(3)
|
| Total
|
|
|
|
|
|
|
$(583)
|
|
$
(582) |
|
$12
|
|
$
(13) |
| Footnote
Legend: |
|
(1) |
If
the Fund is a buyer of protection and a credit event occurs, as defined under the terms of that particular swap agreement, the Fund will either: (i) receive from the seller of protection an amount equal to the notional amount of the swap and deliver
the referenced obligation or underlying investments comprising the referenced index; or (ii) receive a net settlement amount in the form of cash or investments equal to the notional amount of the swap less the recovery value of the referenced
obligation or underlying investments comprising the referenced index. |
|
(2) |
The
maximum potential amount the Fund could be required to pay as a seller of credit protection or receive as a buyer of credit protection if a credit event occurs as defined under the terms of that particular swap agreement. |
|
(3) |
Markit
CDX.NA.HY Index, is composed of 100 of the most liquid North American entities with high yield credit ratings that trade in the credit default swap market. |
|
(4) |
Amount
is less than $500. |
The
following table summarizes the market value of the Fund’s investments as of September 30, 2021, based on the inputs used to value them (See Security Valuation Note 2A in the Notes to Financial Statements):
| |
Total
Value at
September 30, 2021 |
|
Level
1
Quoted Prices |
|
Level
2
Significant
Observable
Inputs |
| Assets:
|
|
|
|
|
|
| Debt
Securities: |
|
|
|
|
|
| Asset-Backed
Securities |
$16,998
|
|
$
— |
|
$16,998
|
| Corporate
Bonds and Notes |
22,723
|
|
—
|
|
22,723
|
| Foreign
Government Security |
204
|
|
—
|
|
204
|
| Mortgage-Backed
Securities |
8,817
|
|
—
|
|
8,817
|
| U.S.
Government Securities |
8,391
|
|
—
|
|
8,391
|
| Equity
Securities: |
|
|
|
|
|
| Preferred
Stocks |
461
|
|
277
|
|
184
|
| Money
Market Mutual Fund |
1,077
|
|
1,077
|
|
—
|
| Other
Financial Instruments: |
|
|
|
|
|
| Futures
Contract |
48
|
|
48
|
|
—
|
| Centrally
Cleared Credit Default Swap |
1
|
|
—
|
|
1
|
| Total
Assets |
58,720
|
|
1,402
|
|
57,318
|
| Liabilities:
|
|
|
|
|
|
| Other
Financial Instruments: |
|
|
|
|
|
| Futures
Contracts |
(38)
|
|
(38)
|
|
—
|
| Centrally
Cleared Credit Default Swap |
(584)
|
|
—
|
|
(584)
|
| Total
Liabilities |
(622)
|
|
(38)
|
|
(584)
|
| Total
Investments |
$58,098
|
|
$1,364
|
|
$56,734
|
There were no securities
valued using significant unobservable inputs (Level 3) at September 30, 2021.
There were no transfers into or out of Level 3 related
to securities held at September 30, 2021.
See Notes to Financial Statements
AllianzGI Emerging Markets
Consumer Fund
SCHEDULE OF INVESTMENTS September 30, 2021
($ reported in thousands)
| |
Shares
|
|
Value
|
| Preferred
Stock—0.3% |
| Brazil—0.3%
|
|
|
| Banco
Bradesco S.A. |
2,700
|
|
$
10 |
Total
Preferred Stock
(Identified Cost $13) |
|
10
|
| |
|
|
|
| |
| |
|
|
|
| |
| Common
Stocks—98.8% |
| Brazil—1.5%
|
|
|
| Banco
do Brasil S.A. |
6,500
|
|
35
|
| Sao
Martinho S.A. |
3,600
|
|
23
|
| |
|
|
58
|
| |
|
|
|
| |
| China—33.0%
|
|
|
| Alibaba
Group Holding Ltd.(1) |
5,700
|
|
105
|
| ANTA
Sports Products Ltd. |
4,000
|
|
76
|
| Baidu,
Inc. Sponsored ADR(1) |
135
|
|
21
|
| Bank
of Jiangsu Co., Ltd. Class A |
18,100
|
|
16
|
| Bilibili,
Inc. Sponsored ADR(1) |
221
|
|
15
|
| China
Merchants Bank Co., Ltd. Class H |
17,000
|
|
135
|
| Chlitina
Holding Ltd. |
3,000
|
|
21
|
| Geely
Automobile Holdings Ltd. |
6,000
|
|
17
|
| Great
Wall Motor Co., Ltd. Class H |
4,500
|
|
17
|
| Greenland
Holdings Corp. Ltd. Class A |
17,124
|
|
12
|
| JD.com,
Inc. ADR(1) |
977
|
|
71
|
| JD.com,
Inc. Class A(1) |
550
|
|
20
|
| Lenovo
Group Ltd. |
62,000
|
|
81
|
| Li
Ning Co., Ltd. |
5,500
|
|
63
|
| Luzhou
Laojiao Co., Ltd. Class A |
741
|
|
25
|
| Meituan
Class B(1) |
800
|
|
26
|
| NIO,
Inc. ADR(1) |
276
|
|
10
|
| Nongfu
Spring Co., Ltd. Class H |
3,600
|
|
18
|
| Shanghai
Pharmaceuticals Holding Co., Ltd. Class A |
6,200
|
|
18
|
| Shenzhen
Mindray Bio-Medical Electronics Co., Ltd. Class A |
400
|
|
24
|
| Shenzhou
International Group Holdings Ltd. |
1,600
|
|
34
|
| Sinopharm
Group Co., Ltd. Class H |
5,200
|
|
14
|
| Tencent
Holdings Ltd. |
2,700
|
|
161
|
| Topsports
International Holdings Ltd. |
14,000
|
|
16
|
| Tsingtao
Brewery Co., Ltd. Class H |
6,000
|
|
47
|
| Weibo
Corp. Sponsored ADR(1) |
306
|
|
14
|
| Wuxi
Biologics Cayman, Inc.(1) |
6,000
|
|
97
|
| Xiaomi
Corp. Class B(1) |
8,600
|
|
24
|
| Zhejiang
Semir Garment Co., Ltd. Class A |
30,500
|
|
36
|
| |
Shares
|
|
Value
|
| |
|
|
|
| China—continued
|
|
|
| Zhongsheng
Group Holdings Ltd. |
3,500
|
|
$ 28
|
| |
|
|
1,262
|
| |
|
|
|
| |
| Cyprus—0.5%
|
|
|
| TCS
Group Holding plc GDR |
227
|
|
21
|
| Germany—3.4%
|
|
|
| Daimler
AG Registered Shares |
1,484
|
|
131
|
| Hong
Kong—0.6% |
|
|
| Yue
Yuen Industrial Holdings Ltd.(1) |
12,000
|
|
24
|
| India—7.2%
|
|
|
| Apollo
Tyres Ltd. |
6,468
|
|
20
|
| Bajaj
Auto Ltd. |
290
|
|
15
|
| Divi’s
Laboratories Ltd. |
997
|
|
64
|
| HDFC
Bank Ltd. ADR |
1,250
|
|
91
|
| Jubilant
Foodworks Ltd. |
931
|
|
51
|
| Reliance
Industries Ltd. |
1,046
|
|
35
|
| |
|
|
276
|
| |
|
|
|
| |
| Indonesia—0.4%
|
|
|
| Indofood
Sukses Makmur Tbk PT |
33,500
|
|
15
|
| Mexico—2.0%
|
|
|
| America
Movil SAB de CV Series L |
66,600
|
|
59
|
| Gruma
SAB de CV Class B |
1,375
|
|
16
|
| |
|
|
75
|
| |
|
|
|
| |
| Philippines—0.4%
|
|
|
| Globe
Telecom, Inc. |
235
|
|
14
|
| Poland—0.4%
|
|
|
| Dino
Polska S.A.(1) |
202
|
|
17
|
| Russia—1.4%
|
|
|
| Mobile
TeleSystems PJSC Sponsored ADR |
5,396
|
|
52
|
| Singapore—0.7%
|
|
|
| Sea
Ltd. ADR(1) |
87
|
|
28
|
| South
Africa—0.7% |
|
|
| Absa
Group Ltd. |
2,581
|
|
26
|
| South
Korea—15.5% |
|
|
| CJ
CheilJedang Corp. |
145
|
|
50
|
| Hana
Financial Group, Inc. |
3,063
|
|
119
|
| Hankook
Tire & Technology Co., Ltd. |
679
|
|
25
|
| Kia
Corp. |
1,305
|
|
88
|
| KIWOOM
Securities Co. Ltd. |
125
|
|
11
|
| KT
Corp. |
1,389
|
|
38
|
| LG
Electronics, Inc. |
279
|
|
30
|
| NAVER
Corp. |
116
|
|
38
|
| |
Shares
|
|
Value
|
| |
|
|
|
| South
Korea—continued |
|
|
| Samsung
Electronics Co., Ltd. |
3,138
|
|
$
194 |
| |
|
|
593
|
| |
|
|
|
| |
| Switzerland—1.9%
|
|
|
| Roche
Holding AG |
198
|
|
72
|
| Taiwan—19.5%
|
|
|
| Cathay
Financial Holding Co., Ltd. |
34,000
|
|
70
|
| Chong
Hong Construction Co., Ltd. |
7,000
|
|
20
|
| CTBC
Financial Holding Co., Ltd. |
80,000
|
|
66
|
| First
Financial Holding Co., Ltd. |
77,456
|
|
63
|
| Fubon
Financial Holding Co., Ltd. |
125,400
|
|
343
|
| Lite-On
Technology Corp. |
23,000
|
|
51
|
| momo.com,
Inc. |
1,000
|
|
58
|
| O-TA
Precision Industry Co., Ltd. |
4,000
|
|
22
|
| Qisda
Corp. |
20,000
|
|
20
|
| Yuanta
Financial Holding Co., Ltd. |
40,000
|
|
35
|
| |
|
|
748
|
| |
|
|
|
| |
| Thailand—0.7%
|
|
|
| Charoen
Pokphand Foods PCL Foreign Shares |
13,200
|
|
10
|
| Sri
Trang Gloves Thailand PCL Foreign Shares |
18,200
|
|
17
|
| |
|
|
27
|
| |
|
|
|
| |
| Turkey—1.4%
|
|
|
| Arcelik
AS |
4,141
|
|
15
|
| Turkcell
Iletisim Hizmetleri AS |
6,040
|
|
10
|
| Turkiye
Garanti Bankasi AS |
25,753
|
|
27
|
| |
|
|
52
|
| |
|
|
|
| |
| United
States—7.6% |
|
|
| Apple,
Inc. |
818
|
|
116
|
| Microsoft
Corp. |
282
|
|
79
|
| PepsiCo,
Inc. |
297
|
|
44
|
| Thermo
Fisher Scientific, Inc. |
87
|
|
50
|
| |
|
|
289
|
| |
|
|
|
| |
Total
Common Stocks
(Identified Cost $2,808) |
|
3,780
|
| |
|
|
|
| |
| |
|
|
|
| |
| Rights—0.1%
|
| Taiwan—0.1%
|
|
|
| Fubon
Financial Holding Co., Ltd.(1) |
4,345
|
|
3
|
See Notes to Financial Statements
AllianzGI Emerging Markets
Consumer Fund
SCHEDULE OF INVESTMENTS (Continued)
September 30, 2021
($ reported in
thousands)
| |
Shares
|
|
Value
|
| |
|
|
|
| Taiwan—continued
|
|
|
| Fubon
Financial Holding Co., Ltd. Preference Shares (1) |
2,643
|
|
$
— |
| |
|
|
3
|
| |
|
|
|
| |
Total
Rights
(Identified Cost $—) |
|
3
|
| |
|
|
|
| |
| |
|
|
|
| |
Total
Long-Term Investments—99.2%
(Identified Cost $2,821) |
|
3,793
|
| |
|
|
|
| |
| |
|
|
|
| |
| |
Shares
|
|
Value
|
| |
|
|
|
| |
|
|
|
| Short-Term
Investment—4.2% |
| Money
Market Mutual Fund—4.2% |
| Dreyfus
Government Cash Management Fund - Institutional Shares (seven-day effective yield 0.030%)(2) |
162,514
|
|
$
163 |
Total
Short-Term Investment
(Identified Cost $163) |
|
163
|
| |
|
|
|
| |
| |
|
|
|
| |
TOTAL
INVESTMENTS—103.4%
(Identified Cost $2,984) |
|
$3,956
|
| Other
assets and liabilities, net—(3.4)% |
|
(131)
|
| NET
ASSETS—100.0% |
|
$3,825
|
| Abbreviations:
|
| ADR
|
American
Depositary Receipt |
| GDR
|
Global
Depositary Receipt |
| LLC
|
Limited
Liability Company |
| PJSC
|
Public
Joint Stock Company |
| Footnote
Legend: |
|
(1) |
Non-income
producing. |
|
(2) |
Shares
of this fund are publicly offered, and its prospectus and annual report are publicly available. |
| Country
Weightings (Unaudited)† |
| China
|
32%
|
| Taiwan
|
19
|
| South
Korea |
15
|
| United
States |
11
|
| India
|
7
|
| Germany
|
3
|
| Mexico
|
2
|
| Other
|
11
|
| Total
|
100%
|
|
† % of total investments as of September 30, 2021. |
The following table summarizes the market
value of the Fund’s investments as of September 30, 2021, based on the inputs used to value them (See Security Valuation Note 2A in the Notes to Financial Statements):
| |
Total
Value at
September 30, 2021 |
|
Level
1
Quoted Prices |
|
Level
2
Significant
Observable
Inputs |
| Assets:
|
|
|
|
|
|
| Equity
Securities: |
|
|
|
|
|
| Common
Stocks |
$3,780
|
|
$751
|
|
$3,029
|
| Preferred
Stock |
10
|
|
10
|
|
—
|
| Rights
|
3
|
|
—
|
|
3
|
| Money
Market Mutual Fund |
163
|
|
163
|
|
—
|
| Total
Investments |
$3,956
|
|
$924
|
|
$3,032
|
There were no
securities valued using significant unobservable inputs (Level 3) at September 30, 2021.
Securities held by the Fund with an end of
period value of $10 were transferred from Level 3 to Level 1 due to a increase in trading activities at period end.
For information regarding the abbreviations, see the Key Investment Terms
starting on page 6.
See Notes to Financial Statements
AllianzGI Global
Allocation Fund
SCHEDULE OF INVESTMENTS September 30, 2021
($ reported in thousands)
| |
Par
Value |
|
Value
|
| U.S.
Government Securities—6.8% |
Tennessee
Valley Authority
1.500%, 9/15/31 |
$ 2,450
|
|
$
2,414 |
| U.S.
Treasury Bonds |
|
|
|
| 1.750%,
8/15/41 |
2,592
|
|
2,478
|
| 2.375%,
5/15/51(1) |
2,992
|
|
3,193
|
| U.S.
Treasury Notes |
|
|
|
| 0.125%,
11/30/22 |
1,300
|
|
1,300
|
| 0.125%,
8/31/23 |
3,635
|
|
3,625
|
| 0.375%,
4/15/24 |
400
|
|
400
|
| 0.375%,
9/15/24 |
2,735
|
|
2,723
|
| 0.750%,
8/31/26 |
2,871
|
|
2,840
|
| 1.250%,
8/15/31 |
371
|
|
362
|
Total
U.S. Government Securities
(Identified Cost $19,556) |
|
19,335
|
| |
|
|
|
| |
| |
|
|
|
| |
| Foreign
Government Security—0.1% |
United
Mexican States
4.500%, 1/31/50 |
240
|
|
245
|
Total
Foreign Government Security
(Identified Cost $258) |
|
245
|
| |
|
|
|
| |
| |
|
|
|
| |
| Mortgage-Backed
Securities—8.8% |
| Agency—7.8%
|
|
|
Federal
Home Loan Mortgage Multiclass Certificates 2021-P009, A2
1.878%, 1/25/31 |
921
|
|
942
|
| Federal
Home Loan Mortgage Multifamily Structured Pass Through Certificates |
|
|
|
| 1.639%,
1/25/30 |
870
|
|
874
|
| 1.493%,
9/25/30 |
1,300
|
|
1,288
|
| 2.074%,
1/25/31 |
50
|
|
52
|
| Federal
National Mortgage Association ACES |
|
|
|
2021-M1S,
A2
1.429%, 12/25/30(2) |
2,000
|
|
1,957
|
2021-M3G,
A2
1.250%, 1/25/31(2) |
1,000
|
|
966
|
2021-M2G,
A2
1.421%, 3/25/31(2) |
1,000
|
|
976
|
| Government
National Mortgage Association II |
|
|
|
Pool
#78446
3.000%, 2/20/48 |
1,245
|
|
1,303
|
Pool
#784648
3.000%, 11/20/48 |
2,632
|
|
2,724
|
Pool
#BV0838
2.500%, 8/20/50 |
5,495
|
|
5,691
|
| |
Par
Value |
|
Value
|
| |
|
|
|
| Agency—continued
|
|
|
Pool
#MA6985
2.000%, 11/20/50 |
$ 1,252
|
|
$
1,251 |
Pool
#BZ4061
2.000%, 12/20/50 |
2,088
|
|
2,121
|
Pool
#MA7366
2.000%, 5/20/51 |
2,208
|
|
2,242
|
| |
|
|
22,387
|
| |
|
|
|
| |
| Non-Agency—1.0%
|
|
|
Grace
Trust 2020-GRCE, A 144A
2.347%, 12/10/40(3) |
1,250
|
|
1,267
|
One
Bryant Park Trust 2019-OBP, A 144A
2.516%, 9/15/54(3) |
1,500
|
|
1,544
|
| |
|
|
2,811
|
| |
|
|
|
| |
Total
Mortgage-Backed Securities
(Identified Cost $25,525) |
|
25,198
|
| |
|
|
|
| |
| |
|
|
|
| |
| Asset-Backed
Securities—6.4% |
| Automobiles—1.4%
|
|
|
Ally
Auto Receivables Trust 2019-4, A3
1.840%, 6/17/24 |
700
|
|
705
|
CarMax
Auto Owner Trust 2020-2, A3
1.700%, 11/15/24 |
957
|
|
966
|
GM
Financial Automobile Leasing Trust 2021-2, A3
0.340%, 5/20/24 |
500
|
|
500
|
Tesla
Auto Lease Trust 2021-A, A3 144A
0.560%, 3/20/25(3) |
750
|
|
752
|
Toyota
Auto Receivables Owner Trust 2021-B, A3
0.260%, 11/17/25 |
1,000
|
|
997
|
| |
|
|
3,920
|
| |
|
|
|
| |
| Collateralized
Loan Obligations—1.1% |
|
|
Flatiron
CLO 17 Ltd. 2017-1A, AR (3 month LIBOR + 0.980%, Cap N/A, Floor 0.980%) 144A
1.105%, 5/15/30(2)(3) |
1,825
|
|
1,823
|
Venture
42 CLO Ltd. 2021-42A, A1A (3 month LIBOR + 1.130%, Cap N/A, Floor 1.130%) 144A
1.311%, 4/15/34(2)(3) |
1,220
|
|
1,220
|
| |
|
|
3,043
|
| |
|
|
|
| |
| |
Par
Value |
|
Value
|
| |
|
|
|
| Consumer
Loans—0.2% |
|
|
OneMain
Financial Issuance Trust 2021-1A, A1 144A
1.550%, 6/16/36(3) |
$ 500
|
|
$
499 |
| Credit
Card—0.3% |
|
|
Citibank
Credit Card Issuance Trust 2018-A2, A2 (1 month LIBOR + 0.330%)
0.417%, 1/20/25(2) |
1,000
|
|
1,003
|
| Equipment—0.1%
|
|
|
Dell
Equipment Finance Trust 2021-2, A3 144A
0.530%, 12/22/26(3) |
330
|
|
329
|
| Other—3.3%
|
|
|
| United
States Small Business Administration |
|
|
|
2017-20E,
1
2.880%, 5/1/37 |
1,683
|
|
1,802
|
2020-20G,
1
1.030%, 7/1/40 |
2,071
|
|
2,004
|
2020-25L,
1
1.210%, 12/1/45 |
1,474
|
|
1,434
|
2021-25A,
1
1.280%, 1/1/46 |
3,078
|
|
2,985
|
2021-25B,
1
1.340%, 2/1/46 |
604
|
|
588
|
2021-25I,
1
1.560%, 9/1/46 |
250
|
|
248
|
Verizon
Master Trust 2021-1, A
0.500%, 5/20/27 |
500
|
|
499
|
| |
|
|
9,560
|
| |
|
|
|
| |
Total
Asset-Backed Securities
(Identified Cost $18,627) |
|
18,354
|
| |
|
|
|
| |
| |
|
|
|
| |
| Corporate
Bonds and Notes—14.4% |
| Advertising—0.1%
|
|
|
Omnicom
Group, Inc.
2.600%, 8/1/31 |
132
|
|
134
|
| Aerospace
& Defense—0.3% |
|
|
| BAE
Systems plc |
|
|
|
| 144A
3.400%, 4/15/30(3) |
30
|
|
32
|
| 144A
1.900%, 2/15/31(3) |
125
|
|
120
|
| Boeing
Co. (The) |
|
|
|
| 4.875%,
5/1/25 |
140
|
|
156
|
| 3.625%,
2/1/31 |
370
|
|
396
|
| Raytheon
Technologies Corp. |
|
|
|
| 7.200%,
8/15/27 |
93
|
|
121
|
See Notes to Financial Statements
AllianzGI Global
Allocation Fund
SCHEDULE OF INVESTMENTS (Continued)
September 30, 2021
($ reported in
thousands)
| |
Par
Value |
|
Value
|
| |
|
|
|
| Aerospace
& Defense—continued |
|
|
| 7.000%,
11/1/28 |
$ 75
|
|
$ 98
|
| |
|
|
923
|
| |
|
|
|
| |
| Airlines—0.4%
|
|
|
American
Airlines, Inc. 144A
5.500%, 4/20/26(3) |
150
|
|
158
|
| Delta
Air Lines, Inc. |
|
|
|
| 144A
7.000%, 5/1/25(3) |
198
|
|
231
|
| 144A
4.500%, 10/20/25(3) |
205
|
|
219
|
Mileage
Plus Holdings LLC 144A
6.500%, 6/20/27(3) |
480
|
|
522
|
United
Airlines, Inc. 144A
4.625%, 4/15/29(3) |
100
|
|
103
|
| |
|
|
1,233
|
| |
|
|
|
| |
| Auto
Manufacturers—0.2% |
|
|
Ford
Motor Credit Co. LLC
4.140%, 2/15/23 |
215
|
|
221
|
General
Motors Co.
5.150%, 4/1/38 |
290
|
|
346
|
| |
|
|
567
|
| |
|
|
|
| |
| Banks—2.5%
|
|
|
| Bank
of America Corp. |
|
|
|
| 2.456%,
10/22/25 |
425
|
|
444
|
| 2.496%,
2/13/31 |
560
|
|
567
|
BNP
Paribas S.A. 144A
1.675%, 6/30/27(3) |
200
|
|
199
|
Citigroup,
Inc.
0.776%, 10/30/24 |
1,010
|
|
1,014
|
Cooperatieve
Rabobank UA 144A
1.106%, 2/24/27(3) |
750
|
|
739
|
Goldman
Sachs Group, Inc. (The)
0.855%, 2/12/26 |
330
|
|
327
|
Huntington
Capital Trust I (3 month LIBOR + 0.700%)
0.826%, 2/1/27(2) |
220
|
|
214
|
| JPMorgan
Chase & Co. |
|
|
|
| 0.768%,
8/9/25 |
555
|
|
553
|
| 3.328%,
4/22/52 |
135
|
|
141
|
Series
U (3 month LIBOR + 0.950%)
1.076%, 2/2/37(2) |
520
|
|
469
|
M&T
Bank Corp.
3.500% (4) |
153
|
|
152
|
| NatWest
Group plc |
|
|
|
| 2.359%,
5/22/24 |
635
|
|
652
|
| 3.073%,
5/22/28 |
200
|
|
212
|
Popular,
Inc.
6.125%, 9/14/23 |
340
|
|
365
|
State
Street Corp. (3 month LIBOR + 1.000%)
1.116%, 6/15/47(2) |
465
|
|
414
|
| |
Par
Value |
|
Value
|
| |
|
|
|
| Banks—continued
|
|
|
Sumitomo
Mitsui Financial Group, Inc.
0.508%, 1/12/24 |
$ 428
|
|
$ 427
|
Truist
Financial Corp.
1.267%, 3/2/27 |
400
|
|
398
|
| |
|
|
7,287
|
| |
|
|
|
| |
| Biotechnology—0.2%
|
|
|
Amgen,
Inc.
2.000%, 1/15/32 |
510
|
|
491
|
Celgene
Corp.
5.000%, 8/15/45 |
70
|
|
82
|
| |
|
|
573
|
| |
|
|
|
| |
| Chemicals—0.3%
|
|
|
Air
Products & Chemicals, Inc.
2.800%, 5/15/50 |
141
|
|
141
|
Braskem
Netherlands Finance BV 144A
4.500%, 1/31/30(3) |
200
|
|
213
|
LG
Chem Ltd. 144A
1.375%, 7/7/26(3) |
400
|
|
395
|
| |
|
|
749
|
| |
|
|
|
| |
| Commercial
Services—0.3% |
|
|
Experian
Finance plc 144A
2.750%, 3/8/30(3) |
200
|
|
207
|
Massachusetts
Institute of Technology
5.600%, 7/1/2111 |
175
|
|
302
|
President
& Fellows of Harvard College
4.875%, 10/15/40 |
135
|
|
183
|
Trustees
of Tufts College
3.099%, 8/15/51 |
135
|
|
142
|
| |
|
|
834
|
| |
|
|
|
| |
| Computers—0.3%
|
|
|
Apple,
Inc.
2.700%, 8/5/51 |
250
|
|
241
|
Dell,
Inc.
7.100%, 4/15/28 |
155
|
|
200
|
| Leidos,
Inc. |
|
|
|
| 2.300%,
2/15/31 |
395
|
|
386
|
| 7.125%,
7/1/32 |
33
|
|
45
|
| |
|
|
872
|
| |
|
|
|
| |
| Diversified
Financial Services—0.7% |
|
|
AerCap
Ireland Capital DAC
3.500%, 1/15/25 |
150
|
|
158
|
| American
Express Co. |
|
|
|
| 3.550%
(4) |
150
|
|
153
|
| 3.625%,
12/5/24 |
145
|
|
157
|
| 8.150%,
3/19/38 |
105
|
|
165
|
| Discover
Financial Services |
|
|
|
| 4.100%,
2/9/27 |
190
|
|
212
|
| |
Par
Value |
|
Value
|
| |
|
|
|
Diversified
Financial
Services—continued |
|
|
Series
C
5.500%(4) |
$ 230
|
|
$ 249
|
GE
Capital Funding LLC
4.550%, 5/15/32 |
260
|
|
308
|
Intercontinental
Exchange, Inc.
2.650%, 9/15/40 |
110
|
|
105
|
Synchrony
Financial
4.375%, 3/19/24 |
375
|
|
405
|
| |
|
|
1,912
|
| |
|
|
|
| |
| Electric
Utilities—2.4% |
|
|
Alabama
Power Co.
4.100%, 1/15/42 |
165
|
|
185
|
Arizona
Public Service Co.
5.500%, 9/1/35 |
90
|
|
115
|
CMS
Energy Corp.
3.600%, 11/15/25 |
175
|
|
189
|
Consolidated
Edison Co. of New York, Inc. Series 03-C
5.100%, 6/15/33 |
69
|
|
82
|
Dominion
Energy, Inc. Series C
2.250%, 8/15/31 |
200
|
|
199
|
DTE
Electric Co. Series A
4.050%, 5/15/48 |
120
|
|
143
|
Duke
Energy Corp.
3.250%, 1/15/82 |
145
|
|
144
|
Duke
Energy Florida LLC
2.500%, 12/1/29 |
143
|
|
148
|
Duke
Energy Progress LLC
3.450%, 3/15/29 |
330
|
|
365
|
Edison
International Series A
5.375% (4) |
155
|
|
160
|
Enel
Finance International N.V 144A
2.250%, 7/12/31(3) |
235
|
|
232
|
Enel
Finance International N.V. 144A
2.650%, 9/10/24(3) |
800
|
|
838
|
| Jersey
Central Power & Light Co. |
|
|
|
| 6.150%,
6/1/37 |
270
|
|
359
|
| 144A
2.750%, 3/1/32(3) |
205
|
|
210
|
MidAmerican
Energy Co.
4.250%, 7/15/49 |
50
|
|
62
|
New
York State Electric & Gas Corp. 144A
2.150%, 10/1/31(3) |
255
|
|
252
|
NextEra
Energy Capital Holdings, Inc.
1.900%, 6/15/28 |
410
|
|
410
|
Niagara
Mohawk Power Corp. 144A
1.960%, 6/27/30(3) |
205
|
|
199
|
See Notes to Financial Statements
AllianzGI Global
Allocation Fund
SCHEDULE OF INVESTMENTS (Continued)
September 30, 2021
($ reported in
thousands)
| |
Par
Value |
|
Value
|
| |
|
|
|
| Electric
Utilities—continued |
|
|
NRG
Energy, Inc. 144A
2.450%, 12/2/27(3) |
$ 527
|
|
$ 535
|
| Pacific
Gas & Electric Co. |
|
|
|
| 4.500%,
12/15/41 |
25
|
|
24
|
| 4.950%,
7/1/50 |
215
|
|
229
|
PacifiCorp.
2.900%, 6/15/52 |
30
|
|
29
|
| Pennsylvania
Electric Co. |
|
|
|
| 6.150%,
10/1/38 |
95
|
|
127
|
| 144A
4.150%, 4/15/25(3) |
313
|
|
333
|
Public
Service Co. of Colorado
4.750%, 8/15/41 |
199
|
|
248
|
Sempra
Energy
3.550%, 6/15/24 |
505
|
|
538
|
Southern
California Edison Co.
3.900%, 12/1/41 |
140
|
|
144
|
Southern
Co. (The) Series A
3.750%, 9/15/51 |
133
|
|
136
|
Virginia
Electric & Power Co. Series A
3.800%, 4/1/28 |
145
|
|
162
|
| |
|
|
6,797
|
| |
|
|
|
| |
| Electronics—0.1%
|
|
|
Avnet,
Inc.
3.000%, 5/15/31 |
245
|
|
246
|
| Environmental
Services—0.1% |
|
|
Waste
Connections, Inc.
2.950%, 1/15/52 |
214
|
|
209
|
Equity
Real Estate Investment Trusts
(REITs)—0.4% |
|
|
Alexandria
Real Estate Equities, Inc.
2.000%, 5/18/32 |
77
|
|
75
|
| American
Tower Corp. |
|
|
|
| 3.375%,
5/15/24 |
147
|
|
156
|
| 2.750%,
1/15/27 |
475
|
|
499
|
Equinix,
Inc.
1.000%, 9/15/25 |
427
|
|
421
|
| |
|
|
1,151
|
| |
|
|
|
| |
| Food
& Beverage—0.2% |
|
|
Anheuser-Busch
InBev Finance, Inc.
4.000%, 1/17/43 |
380
|
|
419
|
PepsiCo,
Inc.
2.875%, 10/15/49 |
200
|
|
204
|
Pilgrim’s
Pride Corp. 144A
3.500%, 3/1/32(3) |
39
|
|
39
|
| |
|
|
662
|
| |
|
|
|
| |
| Healthcare-Products—0.1%
|
|
|
PerkinElmer,
Inc.
1.900%, 9/15/28 |
195
|
|
193
|
| |
Par
Value |
|
Value
|
| |
|
|
|
| Healthcare-Products—continued
|
|
|
STERIS
Irish FinCo Un-Ltd Co.
2.700%, 3/15/31 |
$ 195
|
|
$ 200
|
| |
|
|
393
|
| |
|
|
|
| |
| Healthcare-Services—0.2%
|
|
|
Centene
Corp.
2.450%, 7/15/28 |
308
|
|
310
|
HCA,
Inc.
5.875%, 2/15/26 |
165
|
|
189
|
| |
|
|
499
|
| |
|
|
|
| |
| Insurance—1.2%
|
|
|
| American
International Group, Inc. |
|
|
|
| 3.400%,
6/30/30 |
170
|
|
185
|
| 6.820%,
11/15/37 |
23
|
|
32
|
| Athene
Global Funding |
|
|
|
| 144A
2.550%, 6/29/25(3) |
111
|
|
116
|
| 144A
2.500%, 3/24/28(3) |
135
|
|
138
|
| Global
Atlantic Fin Co. |
|
|
|
| 144A
3.125%, 6/15/31(3) |
205
|
|
207
|
| 144A
4.700%, 10/15/51(3) |
500
|
|
517
|
Liberty
Mutual Group, Inc. 144A
4.125%, 12/15/51(3) |
322
|
|
331
|
Lincoln
National Corp. (3 month LIBOR + 2.358%)
2.482%, 5/17/66(2) |
345
|
|
315
|
Massachusetts
Mutual Life Insurance Co. 144A
5.077%, 2/15/69(3) |
345
|
|
426
|
MetLife,
Inc. 144A
9.250%, 4/8/38(3) |
145
|
|
220
|
Metropolitan
Life Insurance Co. 144A
7.800%, 11/1/25(3) |
215
|
|
266
|
New
York Life Insurance Co. 144A
4.450%, 5/15/69(3) |
80
|
|
100
|
Northwestern
Mutual Life Insurance Co. (The) 144A
3.850%, 9/30/47(3) |
188
|
|
215
|
Pacific
Life Global Funding II 144A
1.375%, 4/14/26(3) |
375
|
|
377
|
| |
|
|
3,445
|
| |
|
|
|
| |
| Internet—0.2%
|
|
|
Amazon.com,
Inc.
3.250%, 5/12/61 |
196
|
|
209
|
Netflix,
Inc.
4.875%, 4/15/28 |
180
|
|
207
|
| |
|
|
416
|
| |
|
|
|
| |
| |
Par
Value |
|
Value
|
| |
|
|
|
| Iron
& Steel—0.0% |
|
|
ArcelorMittal
S.A.
7.000%, 10/15/39 |
$ 75
|
|
$ 106
|
| Media—0.5%
|
|
|
| Charter
Communications Operating LLC |
|
|
|
| 2.250%,
1/15/29 |
201
|
|
201
|
| 5.375%,
4/1/38 |
90
|
|
108
|
Discovery
Communications LLC
5.200%, 9/20/47 |
110
|
|
137
|
Time
Warner Cable LLC
6.550%, 5/1/37 |
170
|
|
229
|
| ViacomCBS,
Inc. |
|
|
|
| 3.450%,
10/4/26 |
180
|
|
193
|
| 4.200%,
5/19/32 |
62
|
|
71
|
| 5.250%,
4/1/44 |
205
|
|
258
|
| 6.250%,
2/28/57 |
158
|
|
181
|
Walt
Disney Co. (The)
3.500%, 5/13/40 |
160
|
|
177
|
| |
|
|
1,555
|
| |
|
|
|
| |
| Multi-National—0.7%
|
|
|
International
Bank for Reconstruction & Development (SOFR + 0.370%)
0.420%, 2/11/31(2) |
2,000
|
|
2,009
|
| Oil,
Gas & Consumable Fuels—0.3% |
|
|
Boston
Gas Co. 144A
3.150%, 8/1/27(3) |
435
|
|
463
|
Hess
Corp.
7.125%, 3/15/33 |
180
|
|
243
|
Marathon
Petroleum Corp.
5.850%, 12/15/45 |
85
|
|
109
|
Petroleos
Mexicanos
4.500%, 1/23/26 |
130
|
|
131
|
| |
|
|
946
|
| |
|
|
|
| |
| Paper
& Forest Products—0.1% |
|
|
Fibria
Overseas Finance Ltd.
5.500%, 1/17/27 |
145
|
|
165
|
Suzano
Austria GmbH
3.750%, 1/15/31 |
100
|
|
103
|
| |
|
|
268
|
| |
|
|
|
| |
| Pharmaceuticals—0.4%
|
|
|
| Cigna
Corp. |
|
|
|
| 4.125%,
11/15/25 |
175
|
|
194
|
| 4.800%,
8/15/38 |
115
|
|
141
|
| CVS
Health Corp. |
|
|
|
| 4.300%,
3/25/28 |
87
|
|
99
|
| 2.700%,
8/21/40 |
205
|
|
196
|
Shire
Acquisitions Investments Ireland DAC
3.200%, 9/23/26 |
180
|
|
194
|
See Notes to Financial Statements
AllianzGI Global
Allocation Fund
SCHEDULE OF INVESTMENTS (Continued)
September 30, 2021
($ reported in
thousands)
| |
Par
Value |
|
Value
|
| |
|
|
|
| Pharmaceuticals—continued
|
|
|
Takeda
Pharmaceutical Co. Ltd.
3.175%, 7/9/50 |
$ 60
|
|
$ 61
|
Viatris,
Inc. 144A
4.000%, 6/22/50(3) |
215
|
|
229
|
| |
|
|
1,114
|
| |
|
|
|
| |
| Pipelines—0.5%
|
|
|
El
Paso Natural Gas Co. LLC
8.375%, 6/15/32 |
205
|
|
300
|
| Energy
Transfer LP |
|
|
|
| 6.500%,
2/1/42 |
150
|
|
195
|
Series
G
7.125%(4) |
215
|
|
226
|
Series
H
6.500%(4) |
100
|
|
104
|
NGPL
PipeCo LLC 144A
3.250%, 7/15/31(3) |
80
|
|
82
|
Northern
Natural Gas Co. 144A
3.400%, 10/16/51(3) |
109
|
|
111
|
Plains
All American Pipeline LP Series B
6.125% (4) |
175
|
|
159
|
Targa
Resources Partners LP
5.500%, 3/1/30 |
185
|
|
202
|
| |
|
|
1,379
|
| |
|
|
|
| |
| Retail—0.1%
|
|
|
Lowe’s
Cos., Inc.
2.800%, 9/15/41 |
193
|
|
188
|
| Semiconductors—0.4%
|
|
|
| Analog
Devices, Inc. |
|
|
|
| 2.100%,
10/1/31 |
228
|
|
229
|
| 2.800%,
10/1/41 |
260
|
|
260
|
| Broadcom,
Inc. |
|
|
|
| 144A
1.950%, 2/15/28(3) |
79
|
|
78
|
| 144A
3.137%, 11/15/35(3) |
183
|
|
183
|
| 144A
3.500%, 2/15/41(3) |
76
|
|
75
|
Intel
Corp.
3.050%, 8/12/51 |
120
|
|
119
|
NXP
B.V. 144A
3.400%, 5/1/30(3) |
250
|
|
271
|
| |
|
|
1,215
|
| |
|
|
|
| |
| Software—0.5%
|
|
|
| Microsoft
Corp. |
|
|
|
| 3.500%,
11/15/42 |
275
|
|
316
|
| 2.525%,
6/1/50 |
170
|
|
163
|
MSCI,
Inc. 144A
3.625%, 11/1/31(3) |
295
|
|
307
|
salesforce.com,
Inc.
2.900%, 7/15/51 |
154
|
|
154
|
| VMware,
Inc. |
|
|
|
| 4.500%,
5/15/25 |
315
|
|
351
|
| |
Par
Value |
|
Value
|
| |
|
|
|
| Software—continued
|
|
|
| 2.200%,
8/15/31 |
$ 240
|
|
$
235 |
| |
|
|
1,526
|
| |
|
|
|
| |
| Telecommunications—0.6%
|
|
|
AT&T,
Inc.
3.100%, 2/1/43 |
594
|
|
569
|
T-Mobile
USA, Inc.
2.250%, 2/15/26 |
148
|
|
150
|
| Verizon
Communications, Inc. |
|
|
|
| 4.125%,
3/16/27 |
330
|
|
375
|
| 2.100%,
3/22/28 |
150
|
|
152
|
| 4.400%,
11/1/34 |
205
|
|
243
|
| 2.875%,
11/20/50 |
145
|
|
135
|
Vodafone
Group plc
5.125%, 6/4/81 |
145
|
|
149
|
| |
|
|
1,773
|
| |
|
|
|
| |
| Toys/Games/Hobbies—0.1%
|
|
|
| Hasbro,
Inc. |
|
|
|
| 6.350%,
3/15/40 |
135
|
|
186
|
| 5.100%,
5/15/44 |
75
|
|
91
|
| |
|
|
277
|
| |
|
|
|
| |
Total
Corporate Bonds and Notes
(Identified Cost $40,952) |
|
41,258
|
| |
|
|
|
| |
| |
|
|
|
| |
| |
Shares
|
|
| Preferred
Stock—0.1% |
| Banks—0.1%
|
|
| Truist
Financial Corp. Series Q, 5.100% |
125
(5) |
144
|
Total
Preferred Stock
(Identified Cost $125) |
144
|
| |
|
|
| |
| |
|
|
| |
| Common
Stocks—13.3% |
| Aerospace
& Defense—0.1% |
|
| Lockheed
Martin Corp. |
320
|
110
|
| Northrop
Grumman Corp. |
103
|
37
|
| Saab
AB Class B |
5,050
|
143
|
| |
|
290
|
| |
|
|
| |
| Air
Freight & Logistics—0.1% |
|
| SG
Holdings Co. Ltd. |
3,400
|
96
|
| Yamato
Holdings Co. Ltd. |
2,400
|
61
|
| |
|
157
|
| |
|
|
| |
| Airlines—0.0%
|
|
| Air
New Zealand Ltd.(6) |
8,610
|
10
|
| Banks—0.4%
|
|
| Agricultural
Bank of China Ltd. Class H |
261,000
|
90
|
| Bank
of China Ltd. Class H |
158,000
|
56
|
| Bank
of Communications Co., Ltd. Class H |
188,000
|
111
|
| |
Shares
|
|
Value
|
| |
|
|
|
| Banks—continued
|
|
|
| Barclays
plc |
6,164
|
|
$ 16
|
| China
CITIC Bank Corp. Ltd. Class H |
127,000
|
|
57
|
| China
Construction Bank Corp. Class H |
235,000
|
|
168
|
| CTBC
Financial Holding Co., Ltd. |
79,000
|
|
65
|
| E.Sun
Financial Holding Co., Ltd. |
66,850
|
|
63
|
| HarborOne
Bancorp, Inc. |
3,102
|
|
44
|
| HDFC
Bank Ltd. ADR |
1,868
|
|
136
|
| Industrial
& Commercial Bank of China Ltd. Class H |
66,000
|
|
37
|
| Mega
Financial Holding Co., Ltd. |
44,000
|
|
50
|
| Mizuho
Financial Group, Inc. |
11,600
|
|
164
|
| Postal
Savings Bank of China Co., Ltd. Class H |
185,000
|
|
127
|
| Shinhan
Financial Group Co. Ltd. ADR |
541
|
|
18
|
| Spar
Nord Bank A/S |
733
|
|
8
|
| Tisco
Financial Group PCL |
11,100
|
|
30
|
| |
|
|
1,240
|
| |
|
|
|
| |
| Beverages—0.1%
|
|
|
| Coca-Cola
Co. (The) |
2,527
|
|
133
|
| PepsiCo,
Inc. |
1,065
|
|
160
|
| |
|
|
293
|
| |
|
|
|
| |
| Biotechnology—0.3%
|
|
|
| Amgen,
Inc. |
460
|
|
98
|
| BioNTech
SE ADR(6) |
225
|
|
61
|
| Gilead
Sciences, Inc. |
3,247
|
|
227
|
| Horizon
Therapeutics plc(6) |
478
|
|
52
|
| Regeneron
Pharmaceuticals, Inc.(6) |
330
|
|
200
|
| Shattuck
Labs, Inc.(6) |
1,208
|
|
25
|
| Vertex
Pharmaceuticals, Inc.(6) |
925
|
|
168
|
| |
|
|
831
|
| |
|
|
|
| |
| Building
Products—0.1% |
|
|
| China
Lesso Group Holdings Ltd. |
14,000
|
|
22
|
| Geberit
AG |
131
|
|
96
|
| Nichias
Corp. |
502
|
|
12
|
| Takasago
Thermal Engineering Co., Ltd. |
2,903
|
|
55
|
| Trane
Technologies plc |
565
|
|
98
|
| |
|
|
283
|
| |
|
|
|
| |
| Capital
Markets—0.1% |
|
|
| Coinbase
Global, Inc. Class A(6) |
370
|
|
84
|
| Flow
Traders |
1,102
|
|
43
|
| Morgan
Stanley |
717
|
|
70
|
| Nasdaq,
Inc. |
523
|
|
101
|
See Notes to Financial Statements
AllianzGI Global
Allocation Fund
SCHEDULE OF INVESTMENTS (Continued)
September 30, 2021
($ reported in
thousands)
| |
Shares
|
|
Value
|
| |
|
|
|
| Capital
Markets—continued |
|
|
| S&P
Global, Inc. |
86
|
|
$ 36
|
| |
|
|
334
|
| |
|
|
|
| |
| Chemicals—0.4%
|
|
|
| Air
Products & Chemicals, Inc. |
1,029
|
|
263
|
| Albemarle
Corp. |
1,789
|
|
392
|
| Givaudan
S.A. Registered Shares |
34
|
|
155
|
| Linde
plc |
1,025
|
|
301
|
| Sociedad
Quimica y Minera de Chile S.A Sponsored ADR |
2,520
|
|
135
|
| |
|
|
1,246
|
| |
|
|
|
| |
| Commercial
Services & Supplies—0.3% |
|
|
| Country
Garden Services Holdings Co., Ltd. |
10,000
|
|
79
|
| Okamura
Corp. |
2,000
|
|
29
|
| Republic
Services, Inc. Class A |
1,989
|
|
239
|
| Secom
Co., Ltd. |
2,100
|
|
152
|
| SP
Plus Corp.(6) |
132
|
|
4
|
| Waste
Management, Inc. |
2,793
|
|
417
|
| |
|
|
920
|
| |
|
|
|
| |
| Communications
Equipment—0.1% |
|
|
| Cisco
Systems, Inc. |
2,676
|
|
145
|
| Motorola
Solutions, Inc. |
838
|
|
195
|
| |
|
|
340
|
| |
|
|
|
| |
| Construction
& Engineering—0.2% |
|
|
| Bouygues
S.A |
3,595
|
|
149
|
| China
Conch Venture Holdings Ltd. |
14,000
|
|
65
|
| HOCHTIEF
AG |
1,566
|
|
125
|
| Kajima
Corp. |
4,400
|
|
56
|
| Okumura
Corp. |
1,800
|
|
48
|
| Sumitomo
Densetsu Co., Ltd. |
1,000
|
|
21
|
| |
|
|
464
|
| |
|
|
|
| |
| Construction
Materials—0.0% |
|
|
| Siam
Cement PCL (The) |
4,900
|
|
58
|
| Consumer
Finance—0.0% |
|
|
| B2Holding
ASA(6) |
5,084
|
|
6
|
| Containers
& Packaging—0.0% |
|
|
| Cascades,
Inc. |
673
|
|
8
|
| FP
Corp. |
1,200
|
|
45
|
| Silgan
Holdings, Inc. |
1,388
|
|
53
|
| Toyo
Seikan Group Holdings Ltd. |
900
|
|
11
|
| |
|
|
117
|
| |
|
|
|
| |
| Distributors—0.0%
|
|
|
| Pool
Corp. |
211
|
|
92
|
| |
Shares
|
|
Value
|
| |
|
|
|
| Diversified
Consumer Services—0.0% |
|
|
| Graham
Holdings Co. Class B |
87
|
|
$ 51
|
| Diversified
Financial Services—0.1% |
|
|
| Berkshire
Hathaway, Inc. Class B(6) |
385
|
|
105
|
| Investor
AB Class B |
4,504
|
|
97
|
| Yuanta
Financial Holding Co., Ltd. |
62,000
|
|
55
|
| |
|
|
257
|
| |
|
|
|
| |
Diversified
Telecommunication
Services—0.7% |
|
|
| AT&T,
Inc. |
7,525
|
|
203
|
| Chunghwa
Telecom Co. Ltd. Sponsored ADR |
1,465
|
|
58
|
| Deutsche
Telekom AG Registered Shares |
12,176
|
|
244
|
| Elisa
Oyj |
2,544
|
|
158
|
| Itissalat
Al-Maghrib |
2,210
|
|
35
|
| KT
Corp. Sponsored ADR |
4,365
|
|
59
|
| Magyar
Telekom Telecommunications plc |
32,624
|
|
45
|
| Nippon
Telegraph & Telephone Corp. |
9,588
|
|
266
|
| Orange
S.A |
6,202
|
|
67
|
| Proximus
SADP |
2,691
|
|
53
|
| Sarana
Menara Nusantara Tbk PT |
265,200
|
|
24
|
| Singapore
Telecommunications Ltd. |
29,500
|
|
53
|
| Swisscom
AG Registered Shares |
132
|
|
76
|
| Telefonica
Brasil S.A ADR |
4,343
|
|
34
|
| Telekom
Austria AG(6) |
2,708
|
|
23
|
| Telstra
Corp. Ltd. |
26,977
|
|
76
|
| Verizon
Communications, Inc. |
9,580
|
|
517
|
| |
|
|
1,991
|
| |
|
|
|
| |
| Electric
Utilities—0.6% |
|
|
| American
Electric Power Co., Inc. |
886
|
|
72
|
| BKW
AG |
111
|
|
12
|
| CEZ
AS |
1,214
|
|
39
|
| CLP
Holdings Ltd. |
13,719
|
|
132
|
| Duke
Energy Corp. |
778
|
|
76
|
| Enel
SpA |
682
|
|
5
|
| Hawaiian
Electric Industries, Inc. |
1,443
|
|
59
|
| Hydro
One Ltd. |
2,666
|
|
63
|
| Iberdrola
S.A. |
8,932
|
|
90
|
| NextEra
Energy, Inc. |
9,715
|
|
763
|
| Power
Assets Holdings Ltd. |
16,500
|
|
97
|
| Southern
Co. (The) |
1,178
|
|
73
|
| Xcel
Energy, Inc. |
3,493
|
|
218
|
| |
|
|
1,699
|
| |
|
|
|
| |
| Electrical
Equipment—0.4% |
|
|
| Generac
Holdings, Inc.(6) |
724
|
|
296
|
| |
Shares
|
|
Value
|
| |
|
|
|
| Electrical
Equipment—continued |
|
|
| Plug
Power, Inc.(6) |
8,662
|
|
$ 221
|
| Shoals
Technologies Group, Inc. Class A(6) |
8,635
|
|
241
|
| Sunrun,
Inc.(6) |
5,365
|
|
236
|
| |
|
|
994
|
| |
|
|
|
| |
Electronic
Equipment, Instruments &
Components—0.2% |
|
|
| ALSO
Holding AG Registered Shares(6) |
76
|
|
22
|
| AU
Optronics Corp. Sponsored ADR |
3,321
|
|
21
|
| Canon
Marketing Japan, Inc. |
700
|
|
16
|
| China
Railway Signal & Communication Corp. Ltd. Class H |
105,000
|
|
38
|
| Hon
Hai Precision Industry Co. Ltd. Registered Shares, GDR |
9,580
|
|
72
|
| Keysight
Technologies, Inc.(6) |
1,303
|
|
214
|
| Shibaura
Electronics Co., Ltd. |
200
|
|
11
|
| Tripod
Technology Corp. |
8,000
|
|
32
|
| |
|
|
426
|
| |
|
|
|
| |
| Energy
Equipment & Services—0.2% |
|
|
| Baker
Hughes Co. |
13,128
|
|
325
|
| Schlumberger
N.V. |
9,316
|
|
276
|
| |
|
|
601
|
| |
|
|
|
| |
| Entertainment—0.2%
|
|
|
| Capcom
Co., Ltd. |
3,900
|
|
108
|
| IGG,
Inc. |
22,000
|
|
21
|
| Koei
Tecmo Holdings Co. Ltd. |
1,300
|
|
62
|
| NetEase,
Inc. ADR |
558
|
|
48
|
| Nintendo
Co., Ltd. |
300
|
|
143
|
| Take-Two
Interactive Software, Inc.(6) |
285
|
|
44
|
| |
|
|
426
|
| |
|
|
|
| |
| Equity
Real Estate Investment—0.6% |
|
|
| American
Tower Corp. |
318
|
|
85
|
| ARA
LOGOS Logistics Trust |
21,200
|
|
14
|
| British
Land Co. plc (The) |
20,325
|
|
135
|
| Crown
Castle International Corp. |
1,089
|
|
189
|
| Duke
Realty Corp. |
2,806
|
|
134
|
| Easterly
Government Properties, Inc. |
2,284
|
|
47
|
| Equity
Residential |
966
|
|
78
|
| Extra
Space Storage, Inc. |
1,254
|
|
211
|
| Fibra
Uno Administracion SA de CV |
35,900
|
|
41
|
| Killam
Apartment Real Estate Investment Trust |
1,828
|
|
31
|
| Land
Securities Group plc |
14,706
|
|
137
|
| Lar
Espana Real Estate Socimi S.A(6) |
1,947
|
|
12
|
| Life
Storage, Inc. REIT |
673
|
|
77
|
See Notes to Financial Statements
AllianzGI Global
Allocation Fund
SCHEDULE OF INVESTMENTS (Continued)
September 30, 2021
($ reported in
thousands)
| |
Shares
|
|
Value
|
| |
|
|
|
Equity
Real Estate
Investment—continued |
|
|
| Nippon
Prologis REIT, Inc. |
33
|
|
$ 110
|
| Public
Storage |
1,078
|
|
320
|
| |
|
|
1,621
|
| |
|
|
|
| |
| Food
& Staples Retailing—0.6% |
|
|
| Casey’s
General Stores, Inc. |
183
|
|
35
|
| Costco
Wholesale Corp. |
338
|
|
152
|
| Empire
Co., Ltd. Class A |
2,561
|
|
78
|
| Etablissements
Franz Colruyt N.V. |
1,605
|
|
82
|
| Kesko
Oyj Class B |
1,983
|
|
68
|
| Koninklijke
Ahold Delhaize N.V. |
6,377
|
|
212
|
| Kroger
Co. (The) |
2,264
|
|
92
|
| Lawson,
Inc. |
3,000
|
|
147
|
| Metro,
Inc. Class A |
1,762
|
|
86
|
| Seven
& i Holdings Co., Ltd. |
2,900
|
|
132
|
| Sheng
Siong Group Ltd. |
25,500
|
|
28
|
| Sugi
Holdings Co., Ltd. |
800
|
|
58
|
| Sumber
Alfaria Trijaya Tbk PT |
660,500
|
|
63
|
| Walmart,
Inc. |
2,560
|
|
357
|
| Welcia
Holdings Co. Ltd. |
1,500
|
|
54
|
| |
|
|
1,644
|
| |
|
|
|
| |
| Food
Products—0.5% |
|
|
| Ajinomoto
Co., Inc. |
2,200
|
|
65
|
| Astral
Foods Ltd. |
1,214
|
|
15
|
| Barry
Callebaut AG |
26
|
|
59
|
| General
Mills, Inc. |
1,225
|
|
74
|
| Hershey
Co. (The) |
1,200
|
|
203
|
| Hormel
Foods Corp. |
2,933
|
|
120
|
| J.M.
Smucker Co. (The) |
1,001
|
|
120
|
| McCormick
& Co., Inc. |
724
|
|
59
|
| MEIJI
Holdings Co. Ltd. |
1,500
|
|
97
|
| Morinaga
Milk Industry Co., Ltd. |
500
|
|
31
|
| Nestle
S.A. Registered Shares |
2,060
|
|
248
|
| Nissin
Foods Holdings Co. Ltd. |
900
|
|
72
|
| Prima
Meat Packers Ltd. |
600
|
|
15
|
| Sino
Grandness Food Industry Group Ltd.(6)(7) |
77,400
|
|
—
|
| Strauss
Group Ltd. |
992
|
|
29
|
| Thai
Union Group PCL Foreign Shares |
37,700
|
|
24
|
| Toyo
Suisan Kaisha Ltd. |
1,100
|
|
49
|
| Uni-President
Enterprises Corp. |
23,000
|
|
56
|
| |
|
|
1,336
|
| |
|
|
|
| |
| Gas
Utilities—0.0% |
|
|
| ENN
Energy Holdings Ltd. |
4,900
|
|
81
|
Healthcare
Equipment &
Supplies—0.3% |
|
|
| Arjo
AB Class B |
3,640
|
|
45
|
| BioMerieux
|
95
|
|
11
|
| Danaher
Corp. |
800
|
|
243
|
| DiaSorin
SpA |
300
|
|
63
|
| |
Shares
|
|
Value
|
| |
|
|
|
Healthcare
Equipment &
Supplies—continued |
|
|
| Hogy
Medical Co. Ltd. |
500
|
|
$ 14
|
| IDEXX
Laboratories, Inc.(6) |
161
|
|
100
|
| Kossan
Rubber Industries |
26,600
|
|
15
|
| Nipro
Corp. |
2,900
|
|
30
|
| West
Pharmaceutical Services, Inc. |
561
|
|
238
|
| |
|
|
759
|
| |
|
|
|
| |
| Healthcare
Providers & Services—0.4% |
|
|
| Alfresa
Holdings Corp. |
2,300
|
|
34
|
| AmerisourceBergen
Corp. |
631
|
|
75
|
| Anthem,
Inc. |
259
|
|
96
|
| Centene
Corp.(6) |
818
|
|
51
|
| CVS
Health Corp. |
1,295
|
|
110
|
| EBOS
Group Ltd. |
1,399
|
|
34
|
| H.U.
Group Holdings, Inc. |
1,900
|
|
52
|
| Humana,
Inc. |
170
|
|
66
|
| Laboratory
Corp. of America Holdings(6) |
329
|
|
93
|
| Medipal
Holdings Corp. |
2,700
|
|
51
|
| Quest
Diagnostics, Inc. |
565
|
|
82
|
| Sinopharm
Group Co., Ltd. Class H |
17,200
|
|
45
|
| Summerset
Group Holdings Ltd. |
7,151
|
|
75
|
| Toho
Holdings Co. Ltd. |
1,100
|
|
18
|
| UnitedHealth
Group, Inc. |
489
|
|
191
|
| |
|
|
1,073
|
| |
|
|
|
| |
| Hotels,
Restaurants & Leisure—0.3% |
|
|
| Autogrill
SpA(6) |
26,048
|
|
211
|
| Domino’s
Pizza, Inc. |
182
|
|
87
|
| Ichibanya
Co. Ltd. |
400
|
|
16
|
| McDonald’s
Corp. |
793
|
|
191
|
| McDonald’s
Holdings Co. Japan Ltd. |
1,400
|
|
66
|
| Sands
China Ltd.(6) |
30,000
|
|
62
|
| Starbucks
Corp. |
841
|
|
93
|
| Whitbread
plc(6) |
3,315
|
|
147
|
| |
|
|
873
|
| |
|
|
|
| |
| Household
Durables—0.1% |
|
|
| De’
Longhi SpA |
472
|
|
17
|
| Rinnai
Corp. |
900
|
|
99
|
| SEB
S.A |
39
|
|
6
|
| Sekisui
House Ltd. |
3,700
|
|
77
|
| |
|
|
199
|
| |
|
|
|
| |
| Household
Products—0.3% |
|
|
| Church
& Dwight Co., Inc. |
635
|
|
53
|
| Clorox
Co. (The) |
509
|
|
84
|
| Colgate-Palmolive
Co. |
1,000
|
|
76
|
| Earth
Corp. |
400
|
|
24
|
| Kimberly-Clark
Corp. |
1,227
|
|
163
|
| Procter
& Gamble Co. (The) |
2,620
|
|
366
|
| Unicharm
Corp. |
300
|
|
13
|
| |
|
|
779
|
| |
|
|
|
| |
| |
Shares
|
|
Value
|
| |
|
|
|
Independent
Power Producers & Energy
Traders—0.1% |
|
|
| China
Everbright Greentech Ltd. |
55,000
|
|
$ 21
|
| China
Longyuan Power Group Corp. Ltd. Class H |
10,000
|
|
25
|
| eRex
Co. Ltd. |
1,400
|
|
31
|
| Sunnova
Energy International, Inc.(6) |
8,049
|
|
265
|
| |
|
|
342
|
| |
|
|
|
| |
| Industrial
Conglomerates—0.0% |
|
|
| Jardine
Matheson Holdings Ltd. |
1,600
|
|
85
|
| TOKAI
Holdings Corp. |
1,800
|
|
14
|
| |
|
|
99
|
| |
|
|
|
| |
| Insurance—0.4%
|
|
|
| Aon
plc Class A |
131
|
|
37
|
| AUB
Group Ltd. |
3,083
|
|
52
|
| Brown
& Brown, Inc. |
1,671
|
|
93
|
| Cincinnati
Financial Corp. |
462
|
|
53
|
| Fubon
Financial Holding Co., Ltd. |
36,300
|
|
99
|
| Hanover
Insurance Group, Inc. (The) |
448
|
|
58
|
| Intact
Financial Corp. |
1,224
|
|
162
|
| Japan
Post Holdings Co., Ltd. |
10,400
|
|
87
|
| Legal
& General Group plc |
40,173
|
|
151
|
| Marsh
& McLennan Cos., Inc. |
560
|
|
85
|
| Progressive
Corp. (The) |
1,780
|
|
161
|
| Qualitas
Controladora SAB de CV |
4,100
|
|
19
|
| Tryg
A/S |
2,448
|
|
56
|
| Willis
Towers Watson plc |
268
|
|
62
|
| Zurich
Insurance Group AG |
101
|
|
41
|
| |
|
|
1,216
|
| |
|
|
|
| |
| Interactive
Media & Services—0.0% |
|
|
| Tencent
Holdings Ltd. |
1,200
|
|
72
|
Internet
& Direct Marketing
Retail—0.1% |
|
|
| Amazon.com,
Inc.(6) |
45
|
|
148
|
| IT
Services—0.4% |
|
|
| Accenture
plc Class A |
371
|
|
119
|
| Automatic
Data Processing, Inc. |
648
|
|
130
|
| Fidelity
National Information Services, Inc. |
569
|
|
69
|
| Fiserv,
Inc.(6) |
720
|
|
78
|
| Limelight
Networks, Inc.(6) |
4,130
|
|
10
|
| Mastercard,
Inc. Class A |
516
|
|
179
|
| NEC
Corp. |
1,400
|
|
76
|
| NEC
Networks & System Integration Corp. |
2,700
|
|
51
|
| Paychex,
Inc. |
2,501
|
|
281
|
| Visa,
Inc. Class A |
588
|
|
131
|
See Notes to Financial Statements
AllianzGI Global
Allocation Fund
SCHEDULE OF INVESTMENTS (Continued)
September 30, 2021
($ reported in
thousands)
| |
Shares
|
|
Value
|
| |
|
|
|
| IT
Services—continued |
|
|
| Western
Union Co. (The) |
2,783
|
|
$ 56
|
| |
|
|
1,180
|
| |
|
|
|
| |
| Leisure
Products—0.0% |
|
|
| Sankyo
Co., Ltd. |
700
|
|
17
|
| Life
Sciences Tools & Services—0.2% |
|
|
| Bio-Rad
Laboratories, Inc. Class A(6) |
145
|
|
108
|
| Eurofins
Scientific SE |
661
|
|
85
|
| Tecan
Group AG |
105
|
|
59
|
| Thermo
Fisher Scientific, Inc. |
262
|
|
150
|
| Waters
Corp.(6) |
249
|
|
89
|
| |
|
|
491
|
| |
|
|
|
| |
| Machinery—0.2%
|
|
|
| Chart
Industries, Inc.(6) |
1,956
|
|
374
|
| Graco,
Inc. |
669
|
|
46
|
| Zoomlion
Heavy Industry Science & Technology Co., Ltd. Class H |
23,400
|
|
21
|
| |
|
|
441
|
| |
|
|
|
| |
| Media—0.1%
|
|
|
| Digital
Holdings, Inc. |
900
|
|
15
|
| National
CineMedia, Inc. |
706
|
|
3
|
| Omnicom
Group, Inc. |
772
|
|
56
|
| Shaw
Communications, Inc. Class B |
2,659
|
|
77
|
| |
|
|
151
|
| |
|
|
|
| |
| Metals
& Mining—0.4% |
|
|
| Barrick
Gold Corp. |
4,117
|
|
74
|
| First
Quantum Minerals, Ltd. |
13,041
|
|
241
|
| Franco-Nevada
Corp. |
1,266
|
|
165
|
| Freeport-McMoRan,
Inc. |
8,068
|
|
262
|
| Newmont
Corp. |
3,685
|
|
200
|
| POSCO
Sponsored ADR |
420
|
|
29
|
| Tiangong
International Co. Ltd. |
42,000
|
|
25
|
| Vale
S.A Sponsored ADR |
2,782
|
|
39
|
| Yamana
Gold, Inc. |
8,821
|
|
35
|
| |
|
|
1,070
|
| |
|
|
|
| |
Mortgage
Real Estate Investment Trusts
(REITs)—0.4% |
|
|
| Cherry
Hill Mortgage Investment Corp. |
16
|
|
—
(8) |
| Hannon
Armstrong Sustainable Infrastructure Capital, Inc. |
22,220
|
|
1,188
|
| |
|
|
1,188
|
| |
|
|
|
| |
| Multiline
Retail—0.1% |
|
|
| Dollar
General Corp. |
1,222
|
|
259
|
| |
Shares
|
|
Value
|
| |
|
|
|
| Multiline
Retail—continued |
|
|
| Target
Corp. |
578
|
|
$ 132
|
| |
|
|
391
|
| |
|
|
|
| |
| Multi-Utilities—0.2%
|
|
|
| A2A
SpA |
30,196
|
|
62
|
| CMS
Energy Corp. |
1,195
|
|
72
|
| Consolidated
Edison, Inc. |
2,070
|
|
150
|
| Dominion
Energy, Inc. |
1,137
|
|
83
|
| DTE
Energy Co. |
457
|
|
51
|
| REN
- Redes Energeticas Nacionais SGPS S.A |
1,075
|
|
3
|
| WEC
Energy Group, Inc. |
1,506
|
|
133
|
| |
|
|
554
|
| |
|
|
|
| |
| Oil,
Gas & Consumable Fuels—0.2% |
|
|
| China
Aviation Oil Singapore Corp. Ltd. |
6,900
|
|
5
|
| Cosmo
Energy Holdings Co. Ltd. |
1,900
|
|
43
|
| DNO
ASA(6) |
31,282
|
|
35
|
| DTE
Midstream LLC |
228
|
|
11
|
| ENEOS
Holdings, Inc. |
14,800
|
|
60
|
| Iwatani
Corp. |
1,000
|
|
58
|
| MOL
Hungarian Oil & Gas plc |
387
|
|
3
|
| PTT
PCL |
11,800
|
|
13
|
| Star
Petroleum Refining PCL(6) |
99,100
|
|
29
|
| Topaz
Energy Corp. |
2,177
|
|
30
|
| Valero
Energy Corp. |
3,841
|
|
271
|
| |
|
|
558
|
| |
|
|
|
| |
| Personal
Products—0.0% |
|
|
| Kao
Corp. |
2,000
|
|
119
|
| Pharmaceuticals—0.9%
|
|
|
| AstraZeneca
plc |
716
|
|
86
|
| Bristol-Myers
Squibb Co. |
2,526
|
|
150
|
| Dechra
Pharmaceuticals plc |
276
|
|
18
|
| Dermapharm
Holding SE |
344
|
|
33
|
| Eli
Lilly & Co. |
1,508
|
|
348
|
| Johnson
& Johnson |
2,534
|
|
409
|
| Merck
& Co., Inc. |
3,786
|
|
284
|
| Novartis
AG Registered Shares |
3,111
|
|
255
|
| Novo
Nordisk A/S Class B |
480
|
|
46
|
| Organon
& Co. |
378
|
|
12
|
| Pfizer,
Inc. |
5,612
|
|
241
|
| Richter
Gedeon Nyrt |
2,371
|
|
65
|
| Roche
Holding AG |
664
|
|
242
|
| Sawai
Group Holdings Co., Ltd. |
1,100
|
|
51
|
| Sumitomo
Dainippon Pharma Co. Ltd. |
532
|
|
10
|
| Takeda
Pharmaceutical Co., Ltd. |
2,500
|
|
83
|
| Viatris,
Inc. |
696
|
|
10
|
| |
Shares
|
|
Value
|
| |
|
|
|
| Pharmaceuticals—continued
|
|
|
| Zoetis,
Inc. Class A |
636
|
|
$ 124
|
| |
|
|
2,467
|
| |
|
|
|
| |
| Professional
Services—0.1% |
|
|
| Booz
Allen Hamilton Holding Corp. Class A |
1,070
|
|
85
|
| FTI
Consulting, Inc.(6) |
457
|
|
62
|
| LifeWorks,
Inc. |
643
|
|
16
|
| |
|
|
163
|
| |
|
|
|
| |
Real
Estate Management &
Development—0.2% |
|
|
| Allreal
Holding AG Registered Shares |
16
|
|
3
|
| Azrieli
Group Ltd. |
837
|
|
75
|
| Hysan
Development Co., Ltd. |
36,000
|
|
117
|
| Intershop
Holding AG |
26
|
|
16
|
| Mobimo
Holding AG(6) |
100
|
|
33
|
| PSP
Swiss Property AG Registered Shares |
427
|
|
52
|
| Swire
Properties Ltd. |
49,400
|
|
123
|
| Swiss
Prime Site AG Registered Shares |
128
|
|
13
|
| TLG
Immobilien AG |
963
|
|
29
|
| WCM
Beteiligungs- und Grundbesitz-AG |
4,510
|
|
24
|
| Wharf
Real Estate Investment Co., Ltd. |
23,000
|
|
118
|
| Yuzhou
Group Holdings Co. Ltd. |
57,804
|
|
9
|
| |
|
|
612
|
| |
|
|
|
| |
| Road
& Rail—0.0% |
|
|
| Fukuyama
Transporting Co., Ltd. |
154
|
|
6
|
| Senko
Group Holdings Co., Ltd. |
6,204
|
|
57
|
| Tourism
Holdings Ltd.(6) |
3,878
|
|
7
|
| |
|
|
70
|
| |
|
|
|
| |
Semiconductors
& Semiconductor
Equipment—0.4% |
|
|
| ASE
Technology Holding Co. Ltd. ADR |
20,923
|
|
164
|
| Enphase
Energy, Inc.(6) |
1,628
|
|
244
|
| Himax
Technologies, Inc. ADR |
8,281
|
|
88
|
| Intel
Corp. |
1,015
|
|
54
|
| Novatek
Microelectronics Corp. |
1,000
|
|
15
|
| Silicon
Motion Technology Corp. ADR |
2,639
|
|
182
|
| SolarEdge
Technologies, Inc.(6) |
1,069
|
|
284
|
See Notes to Financial Statements
AllianzGI Global
Allocation Fund
SCHEDULE OF INVESTMENTS (Continued)
September 30, 2021
($ reported in
thousands)
| |
Shares
|
|
Value
|
| |
|
|
|
Semiconductors
& Semiconductor
Equipment—continued |
|
|
| Taiwan
Semiconductor Manufacturing Co., Ltd. Sponsored ADR |
2,052
|
|
$ 229
|
| |
|
|
1,260
|
| |
|
|
|
| |
| Software—0.3%
|
|
|
| Adobe,
Inc.(6) |
209
|
|
120
|
| Asseco
Poland S.A |
2,017
|
|
45
|
| Cadence
Design Systems, Inc.(6) |
160
|
|
24
|
| Check
Point Software Technologies Ltd.(6) |
321
|
|
36
|
| Citrix
Systems, Inc. |
744
|
|
80
|
| Intuit,
Inc. |
247
|
|
133
|
| J2
Global, Inc.(6) |
406
|
|
56
|
| Microsoft
Corp. |
816
|
|
230
|
| Oracle
Corp. |
1,726
|
|
150
|
| Zoom
Video Communications, Inc. Class A(6) |
340
|
|
89
|
| |
|
|
963
|
| |
|
|
|
| |
| Specialty
Retail—0.2% |
|
|
| Aoyama
Trading Co., Ltd.(6) |
189
|
|
1
|
| AutoZone,
Inc.(6) |
103
|
|
175
|
| DCM
Holdings Co., Ltd. |
3,600
|
|
35
|
| Hornbach
Holding AG & Co. KGaA |
269
|
|
35
|
| Nitori
Holdings Co., Ltd. |
800
|
|
158
|
| O’Reilly
Automotive, Inc.(6) |
296
|
|
181
|
| TJX
Cos., Inc. (The) |
906
|
|
60
|
| Yamada
Holdings Co., Ltd. |
11,100
|
|
46
|
| |
|
|
691
|
| |
|
|
|
| |
Technology
Hardware, Storage &
Peripherals—0.3% |
|
|
| Apple,
Inc. |
875
|
|
124
|
| Asustek
Computer, Inc. |
9,000
|
|
105
|
| Canon,
Inc. |
4,190
|
|
103
|
| FUJIFILM
Holdings Corp. |
1,979
|
|
171
|
| Legend
Holdings Corp. Class H |
6,400
|
|
12
|
| Lenovo
Group Ltd. |
90,000
|
|
117
|
| Samsung
Electronics Co., Ltd. Registered Shares GDR |
118
|
|
183
|
| |
|
|
815
|
| |
|
|
|
| |
Textiles,
Apparel & Luxury
Goods—0.1% |
|
|
| Bosideng
International Holdings Ltd. |
76,000
|
|
54
|
| Burberry
Group plc |
5,214
|
|
127
|
| |
Shares
|
|
Value
|
| |
|
|
|
Textiles,
Apparel & Luxury
Goods—continued |
|
|
| China
Dongxiang Group Co., Ltd. |
68,883
|
|
$
7 |
| Hermes
International |
68
|
|
94
|
| PVH
Corp.(6) |
1,270
|
|
131
|
| |
|
|
413
|
| |
|
|
|
| |
| Thrifts
& Mortgage Finance—0.0% |
|
|
| Kearny
Financial Corp. |
2,236
|
|
28
|
| TFS
Financial Corp. |
453
|
|
9
|
| Waterstone
Financial, Inc. |
1,038
|
|
21
|
| |
|
|
58
|
| |
|
|
|
| |
Trading
Companies &
Distributors—0.0% |
|
|
| Solar
A/S Class B |
333
|
|
33
|
| Watsco,
Inc. |
193
|
|
51
|
| |
|
|
84
|
| |
|
|
|
| |
| Transportation
Infrastructure—0.2% |
|
|
| Aeroports
de Paris(6) |
1,081
|
|
138
|
| Fraport
AG Frankfurt Airport Services Worldwide(6) |
2,186
|
|
151
|
| Getlink
SE |
9,070
|
|
142
|
| Kamigumi
Co., Ltd. |
2,200
|
|
46
|
| Shenzhen
Expressway Co., Ltd. Class H |
8,000
|
|
8
|
| Sydney
Airport(6) |
31,336
|
|
184
|
| |
|
|
669
|
| |
|
|
|
| |
| Water
Utilities—0.0% |
|
|
| American
Water Works Co., Inc. |
153
|
|
26
|
Wireless
Telecommunication
Services—0.1% |
|
|
| Advanced
Info Service PCL Foreign Shares |
14,500
|
|
84
|
| KDDI
Corp. |
4,100
|
|
135
|
| SK
Telecom Co. Ltd. Sponsored ADR |
1,017
|
|
30
|
| SoftBank
Corp. |
6,400
|
|
87
|
| T-Mobile
US, Inc.(6) |
484
|
|
62
|
| |
|
|
398
|
| |
|
|
|
| |
Total
Common Stocks
(Identified Cost $36,658) |
|
38,217
|
| |
|
|
|
| |
| |
|
|
|
| |
| Exchange-Traded
Funds(9)—10.6% |
| Invesco
WilderHill Clean Energy ETF |
4,000
|
|
309
|
| iShares
Core U.S. Aggregate Bond ETF |
46,479
|
|
5,337
|
| |
Shares
|
|
Value
|
| |
|
|
|
| |
|
|
|
| iShares
ESG Aware MSCI USA ETF |
116,228
|
|
$
11,444 |
| iShares
Global Clean Energy ETF |
14,145
|
|
306
|
| iShares
MSCI USA ESG Select ETF |
13,326
|
|
1,279
|
| iShares
Trust iShares ESG Aware MSCI EAFE ETF |
86,959
|
|
6,816
|
| iShares,
Inc. iShares ESG Aware MSCI EM ETF |
56,917
|
|
2,359
|
| PIMCO
1-5 Year U.S. TIPS Index ETF(10) |
46,000
|
|
2,523
|
Total
Exchange-Traded Funds
(Identified Cost $29,370) |
|
30,373
|
| |
|
|
|
| |
| |
|
|
|
| |
| Rights—0.0%
|
| Insurance—0.0%
|
|
|
| Fubon
Financial Holding Co., Ltd.(6) |
1,257
|
|
1
|
| Fubon
Financial Holding Co., Ltd. Preference Shares (6) |
765
|
|
—
|
| |
|
|
1
|
| |
|
|
|
| |
Total
Rights
(Identified Cost $—) |
|
1
|
| |
|
|
|
| |
| |
|
|
|
| |
Total
Long-Term Investments—60.5%
(Identified Cost $171,071) |
|
173,125
|
| |
|
|
|
| |
| |
|
|
|
| |
| Short-Term
Investments—35.5% |
| Money
Market Mutual Fund—3.2% |
| Dreyfus
Government Cash Management Fund - Institutional Shares (seven-day effective yield 0.030%)(9) |
9,203,329
|
|
9,203
|
Total
Money Market Mutual Fund
(Identified Cost $9,203) |
|
9,203
|
| |
|
|
|
| |
| |
|
|
|
| |
See Notes to Financial Statements
AllianzGI Global
Allocation Fund
SCHEDULE OF INVESTMENTS (Continued)
September 30, 2021
($ reported in
thousands)
| |
Shares
|
|
Value
|
| |
|
|
|
| Affiliated
Mutual Fund—32.3% |
| Virtus
AllianzGI Global Sustainability Fund Institutional Shares(9)(10) |
3,521,823
|
|
$
92,554 |
Total
Affiliated Mutual Fund
(Identified Cost $66,102) |
|
92,554
|
| |
|
|
|
| |
| |
|
|
|
| |
Total
Short-Term Investments
(Identified Cost $75,305) |
|
101,757
|
| |
|
|
|
| |
| |
|
|
|
| |
TOTAL
INVESTMENTS—96.0%
(Identified Cost $246,376) |
|
$274,882
|
| Other
assets and liabilities, net—4.0% |
|
11,517
|
| NET
ASSETS—100.0% |
|
$286,399
|
| Abbreviations:
|
| ACES
|
Alternative
Credit Enhancements Securities |
| ADR
|
American
Depositary Receipt |
| BIST
|
Borsa Istanbul
|
| BNP
|
BNP
Paribas |
| BTP
|
Italian
Buonie |
| CDX.EM
|
Credit
Default Swap Index Emerging Markets |
| CDX.NA.HY
|
Credit
Default Swap Index North American High Yield |
| CDX.NA.IG
|
Credit
Default Swap Index North American Investment Grade |
| CLO
|
Collateralized
Loan Obligation |
| DAX
|
Deutsche
Boerse AG German Stock Index |
| EAFE
|
Europe,
Australasia and Far East |
| ETF
|
Exchange-Traded
Fund |
| FTSE
|
Financial
Times Stock Exchange |
| GDR
|
Global
Depositary Receipt |
| JSE
|
Johannesburg
Stock Exchange Limited |
| LIBOR
|
London
Interbank Offered Rate |
| LLC
|
Limited
Liability Company |
| LP
|
Limited
Partnership |
| MIB
|
Milano
Indice di Borsa |
| MSCI
|
Morgan
Stanley Capital International |
| OAT
|
Obligations
Assimilables du Trésor |
| REIT
|
Real
Estate Investment Trust |
| S&P
|
Standard
& Poor’s |
| SOFR
|
Secured
Overnight Financing Rate |
| TIPS
|
Treasury-Inflation
Protected Securities |
| TOPIX
|
Tokyo Stock
Price Index |
| Footnote
Legend: |
|
(1) |
All
or a portion of the security is segregated as collateral for open swap contracts. |
|
(2) |
Variable
rate security. Rate disclosed is as of September 30, 2021. Information in parenthesis represents benchmark and reference rate for each security. Certain variable rate securities are not based on a published reference rate and spread but are
determined by the issuer or agent and are based on current market conditions, or, for mortgage-backed securities, are impacted by the individual mortgages which are paying off over time. These securities do not indicate a reference rate and spread
in their descriptions. |
| (3) |
Security exempt from
registration under Rule 144A of the Securities Act of 1933. These securities may be resold in transactions exempt from registration, normally to qualified institutional buyers. At September 30, 2021, these securities amounted to a value of $17,922
or 6.3% of net assets. |
|
(4) |
No
contractual maturity date. |
|
(5) |
Value
shown as par value. |
|
(6) |
Non-income
producing. |
|
(7) |
The
value of this security was determined using significant unobservable inputs and is reported as a Level 3 security in the Fair Value Hierarchy table located after the Schedule of Investments. |
|
(8) |
Amount
is less than $500. |
|
(9) |
Shares
of this fund are publicly offered, and its prospectus and annual report are publicly available. |
|
(10) |
Affiliated
investment. See Note 4H in Notes to Financial Statements. |
| Counterparties:
|
|
| ICE
|
Intercontinental
Exchange |
| Country
Weightings (Unaudited)† |
| United
States |
91%
|
| Japan
|
2
|
| Cayman
Islands |
1
|
| Netherlands
|
1
|
| United
Kingdom |
1
|
| Switzerland
|
1
|
| China
|
1
|
| Other
|
2
|
| Total
|
100%
|
|
† % of total investments as of September 30, 2021. |
| Exchange-Traded
Futures contracts as of September 30, 2021 were as follows: |
| Issue
|
Expiration
|
Contracts
Purchased/(Sold) |
Notional
Value |
Value
/
Unrealized
Appreciation |
Value
/
Unrealized
(Depreciation) |
| Long
Contracts: |
|
|
|
|
|
| BIST
30 Index Future |
October
2021 |
76
|
$
130 |
$
— |
$
(8) |
| FTSE
Taiwan Index Future |
October
2021 |
6
|
355
|
—
|
(8)
|
| IBEX
35 Index Future |
October
2021 |
4
|
409
|
3
|
—
|
| Mini
Bovespa Future |
October
2021 |
1
|
4
|
—
|
—
(1) |
| 2
Year U.S. Treasury Note Future |
December
2021 |
136
|
29,927
|
—
|
(20)
|
| 5
Year U.S. Treasury Note Future |
December
2021 |
41
|
5,032
|
—
|
(23)
|
| 10
Year Australian Bond Future |
December
2021 |
29
|
2,966
|
—
|
(64)
|
| 10
Year Canadian Bond Future |
December
2021 |
20
|
2,260
|
—
|
(43)
|
| 10
Year Euro-Bund Future |
December
2021 |
1
|
197
|
—
|
(3)
|
For information regarding the abbreviations, see the Key Investment Terms
starting on page 6.
See Notes to Financial Statements
AllianzGI Global
Allocation Fund
SCHEDULE OF INVESTMENTS (Continued)
September 30, 2021
($ reported in
thousands)
| Exchange-Traded
Futures contracts as of September 30, 2021 were as follows: |
| Issue
|
Expiration
|
Contracts
Purchased/(Sold) |
Notional
Value |
Value
/
Unrealized
Appreciation |
|
Value
/
Unrealized
(Depreciation) |
| 30
Year U.S. Treasury Bond Future |
December
2021 |
8
|
$
1,274 |
$
— |
|
$
(23) |
| DAX
Mini Index Future |
December
2021 |
10
|
885
|
—
|
|
(20)
|
| E-Mini
1000 Index Future |
December
2021 |
150
|
11,549
|
—
|
|
(201)
|
| Euro-BTP
Future |
December
2021 |
4
|
704
|
—
|
|
(9)
|
| FTSE
100 Index Future |
December
2021 |
13
|
1,239
|
12
|
|
—
|
| FTSE
MIB Index Future |
December
2021 |
3
|
441
|
—
|
|
(4)
|
| FTSE/JSE
Top 40 Index Future |
December
2021 |
2
|
77
|
—
|
|
(1)
|
| MSCI
EAFE Index Future |
December
2021 |
74
|
8,388
|
—
|
|
(380)
|
| MSCI
Emerging Index Future |
December
2021 |
54
|
3,363
|
—
|
|
(145)
|
| S&P
200® Index Future |
December
2021 |
4
|
527
|
—
|
|
(8)
|
| S&P
500® E-Mini Index Future |
December
2021 |
38
|
8,166
|
—
|
|
(307)
|
| S&P
TSX 60 Index Future |
December
2021 |
4
|
755
|
—
|
|
(19)
|
| TOPIX
Index Future |
December
2021 |
18
|
3,284
|
—
|
|
(26)
|
| U.S.
Treasury Ultra Bond Future |
December
2021 |
6
|
1,146
|
—
|
|
(9)
|
| |
|
|
|
$
15 |
|
$(1,321)
|
| Short
Contracts: |
|
|
|
|
|
|
| FTSE
China A50 Index Future |
October
2021 |
(7)
|
(108)
|
—
|
|
(1)
|
| 10
Year Long Gilt Future |
December
2021 |
(9)
|
(1,518)
|
2
|
|
—
|
| 10
Year U.S. Treasury Note Future |
December
2021 |
(12)
|
(1,579)
|
—
|
|
—
(1) |
| 10
Year Ultra U.S. Treasury Bond Future |
December
2021 |
(186)
|
(27,016)
|
417
|
|
—
|
| Australian
Dollar Future |
December
2021 |
(17)
|
(1,230)
|
15
|
|
—
|
| British
Pound Future |
December
2021 |
(31)
|
(2,611)
|
10
|
|
—
|
| Canadian
Dollar Future |
December
2021 |
(5)
|
(395)
|
—
(1) |
|
—
|
| Euro
Currency Future |
December
2021 |
(48)
|
(6,960)
|
95
|
|
—
|
| Euro-OAT
Future |
December
2021 |
(1)
|
(192)
|
—
|
|
—
(1) |
| Japanese
Yen Currency Future |
December
2021 |
(69)
|
(7,746)
|
78
|
|
—
|
| New
Zealand Dollar Future |
December
2021 |
(10)
|
(690)
|
—
(1) |
|
—
|
| |
|
|
|
617
|
|
(1)
|
| Total
|
|
|
|
$632
|
|
$(1,322)
|
| Centrally
cleared credit default swap - buy protection(2) outstanding as of September 30, 2021 were as follows: |
| Reference
Entity |
Payment
Frequency |
Counterparty
|
Fixed
Rate |
Expiration
Date |
Notional
Amount(3) |
Value
|
|
Premiums
Paid
(Received) |
|
Unrealized
Appreciation |
|
Unrealized
(Depreciation) |
| CDX.EM.36
(4) |
Quarterly
|
ICE
|
1.000%
|
12/20/26
|
$
(900) |
$
36 |
|
$
36 |
|
$—
|
|
$
— |
| CDX.NA.HY.37
(5) |
Quarterly
|
ICE
|
5.000%
|
12/20/26
|
(3,295)
|
(312)
|
|
(319)
|
|
7
|
|
—
|
| CDX.NA.IG.37
(6) |
Quarterly
|
ICE
|
1.000%
|
12/20/26
|
(9,100)
|
(216)
|
|
(217)
|
|
1
|
|
—
|
| International
Business Machines Corp. Senior |
Quarterly
|
ICE
|
1.000%
|
12/20/26
|
(1,100)
|
(34)
|
|
(34)
|
|
—
|
|
—
(1) |
| Southwest
Airlines Co. Senior |
Quarterly
|
ICE
|
1.000%
|
12/20/26
|
(395)
|
(2)
|
|
(1)
|
|
—
|
|
(1)
|
| Valero
Energy Corp. Senior |
Quarterly
|
ICE
|
1.000%
|
12/20/26
|
(360)
|
(1)
|
|
1
|
|
—
|
|
(2)
|
| Total
|
|
|
|
|
|
|
$(529)
|
|
$
(534) |
|
$
8 |
|
$
(3) |
|
Footnote Legend: |
|
(1) |
Amount
is less than $500. |
|
(2) |
If
the Fund is a buyer of protection and a credit event occurs, as defined under the terms of that particular swap agreement, the Fund will either: (i) receive from the seller of protection an amount equal to the notional amount of the swap and
deliver the referenced obligation or underlying investments comprising the referenced index; or (ii) receive a net settlement amount in the form of cash or investments equal to the notional amount of the swap less the recovery value of the
referenced obligation or underlying investments comprising the referenced index. |
|
(3) |
The
maximum potential amount the Fund could be required to pay as a seller of credit protection or receive as a buyer of credit protection if a credit event occurs as defined under the terms of that particular swap agreement. |
|
(4) |
Markit
CDX.EM is composed of Sovereign issuers from Latin America, Eastern Europe, the Middle East, Africa and Asia as published by Markit from time to time |
|
(5) |
Markit
CDX.NA.HY Index, is composed of 100 of the most liquid North American entities with high yield credit ratings that trade in the credit default swap market. |
See
Notes to Financial Statements
AllianzGI Global
Allocation Fund
SCHEDULE OF INVESTMENTS (Continued)
September 30, 2021
($ reported in
thousands)
|
(6) |
Markit
CDX.NA.IG Index, is comprised of one hundred twenty five (125) of the most liquid North American entities with investment grade credit ratings as published by Markit from time to time. |
The following table summarizes the market value of the
Fund’s investments as of September 30, 2021, based on the inputs used to value them (See Security Valuation Note 2A in the Notes to Financial Statements):
| |
Total
Value at
September 30, 2021 |
|
Level
1
Quoted Prices |
|
Level
2
Significant
Observable
Inputs |
|
Level
3
Significant
Unobservable
Inputs |
| Assets:
|
|
|
|
|
|
|
|
| Debt
Securities: |
|
|
|
|
|
|
|
| Asset-Backed
Securities |
$
18,354 |
|
$
— |
|
$
18,354 |
|
$—
|
| Corporate
Bonds and Notes |
41,258
|
|
—
|
|
41,258
|
|
—
|
| Foreign
Government Security |
245
|
|
—
|
|
245
|
|
—
|
| Mortgage-Backed
Securities |
25,198
|
|
—
|
|
25,198
|
|
—
|
| U.S.
Government Securities |
19,335
|
|
—
|
|
19,335
|
|
—
|
| Equity
Securities: |
|
|
|
|
|
|
|
| Common
Stocks |
38,217
|
|
24,986
|
|
13,231
|
|
—
(1) |
| Preferred
Stock |
144
|
|
—
|
|
144
|
|
—
|
| Rights
|
1
|
|
—
|
|
1
|
|
—
|
| Affiliated
Mutual Fund |
92,554
|
|
92,554
|
|
—
|
|
—
|
| Exchange-Traded
Funds |
30,373
|
|
30,373
|
|
—
|
|
—
|
| Money
Market Mutual Fund |
9,203
|
|
9,203
|
|
—
|
|
—
|
| Other
Financial Instruments: |
|
|
|
|
|
|
|
| Futures
Contracts |
632
|
|
632
|
|
—
|
|
—
|
| Centrally
Cleared Credit Default Swap |
36
|
|
—
|
|
36
|
|
—
|
| Total
Assets |
275,550
|
|
157,748
|
|
117,802
|
|
—
(1) |
| Liabilities:
|
|
|
|
|
|
|
|
| Other
Financial Instruments: |
|
|
|
|
|
|
|
| Futures
Contracts |
(1,322)
|
|
(1,322)
|
|
—
|
|
—
|
| Centrally
Cleared Credit Default Swap |
(565)
|
|
—
|
|
(565)
|
|
—
|
| Total
Liabilities |
(1,887)
|
|
(1,322)
|
|
(565)
|
|
—
|
| Total
Investments |
$273,663
|
|
$156,426
|
|
$117,237
|
|
$—
(1) |
|
(1) |
Includes
internally fair valued securities currently priced at zero ($0). |
There were no transfers into or out of Level 3 related
to securities held at September 30, 2021.
Some of
the Fund’s investments that were categorized as Level 3 were valued utilizing third party pricing information without adjustment. Such valuations are based on unobservable inputs. A significant change in third party information could result in
a significantly lower or higher value of Level 3 investments.
Management has determined that the amount of Level 3
securities compared to total net assets is not material; therefore, the rollforward of Level 3 securities and assumptions are not shown for the period ended September 30, 2021.
See Notes to
Financial Statements
AllianzGI Global Dynamic
Allocation Fund
SCHEDULE OF INVESTMENTS September 30, 2021
($
reported in thousands) |
Par
Value |
|
Value
|
| U.S.
Government Securities—0.4% |
| U.S.
Treasury Bonds |
|
|
|
| 1.750%,
8/15/41 |
$
45 |
|
$
43 |
| 2.375%,
5/15/51(1) |
112
|
|
120
|
| U.S.
Treasury Notes |
|
|
|
| 0.750%,
8/31/26 |
53
|
|
52
|
| 1.250%,
8/15/31 |
23
|
|
22
|
Total
U.S. Government Securities
(Identified Cost $241) |
|
237
|
| |
|
|
|
| |
| |
|
|
|
| |
| Foreign
Government Securities—5.7% |
New
Zealand Government Bond
1.750%, 5/15/41 |
5,000
NZD |
|
2,999
|
United
Mexican States
4.500%, 1/31/50 |
200
|
|
204
|
Total
Foreign Government Securities
(Identified Cost $3,310) |
|
3,203
|
| |
|
|
|
| |
| |
|
|
|
| |
| Corporate
Bonds and Notes—16.2% |
| Austria—0.0%
|
|
|
Suzano
Austria GmbH
3.750%, 1/15/31 |
20
|
|
21
|
| Canada—0.1%
|
|
|
Waste
Connections, Inc.
2.950%, 1/15/52 |
49
|
|
48
|
| Cayman
Islands—0.1% |
|
|
Fibria
Overseas Finance Ltd.
5.500%, 1/17/27 |
25
|
|
29
|
| Ireland—0.3%
|
|
|
AerCap
Ireland Capital DAC
3.500%, 1/15/25 |
85
|
|
89
|
Shire
Acquisitions Investments Ireland DAC
3.200%, 9/23/26 |
20
|
|
22
|
STERIS
Irish FinCo Un-Ltd Co.
2.700%, 3/15/31 |
60
|
|
61
|
| |
|
|
172
|
| |
|
|
|
| |
| Japan—0.1%
|
|
|
Takeda
Pharmaceutical Co., Ltd.
3.025%, 7/9/40 |
40
|
|
41
|
| Luxembourg—0.0%
|
|
|
ArcelorMittal
S.A.
7.000%, 10/15/39 |
15
|
|
21
|
| |
Par
Value |
|
Value
|
| |
|
|
|
| Mexico—0.1%
|
|
|
Petroleos
Mexicanos
4.500%, 1/23/26 |
$ 55
|
|
$ 55
|
| Netherlands—0.9%
|
|
|
Cooperatieve
Rabobank UA 144A
1.106%, 2/24/27(2) |
250
|
|
246
|
Enel
Finance International N.V. 144A
2.650%, 9/10/24(2) |
200
|
|
210
|
NXP
B.V. 144A
3.400%, 5/1/30(2) |
45
|
|
49
|
| |
|
|
505
|
| |
|
|
|
| |
| Puerto
Rico—0.3% |
|
|
Popular,
Inc.
6.125%, 9/14/23 |
165
|
|
177
|
| South
Korea—0.3% |
|
|
LG
Chem Ltd. 144A
1.375%, 7/7/26(2) |
200
|
|
198
|
| United
Kingdom—0.6% |
|
|
BAE
Systems plc 144A
3.400%, 4/15/30(2) |
80
|
|
86
|
NatWest
Group plc
2.359%, 5/22/24 |
200
|
|
205
|
Vodafone
Group plc
5.125%, 6/4/81 |
25
|
|
26
|
| |
|
|
317
|
| |
|
|
|
| |
| United
States—13.4% |
|
|
Air
Products & Chemicals, Inc.
2.800%, 5/15/50 |
37
|
|
37
|
Alabama
Power Co.
4.100%, 1/15/42 |
20
|
|
22
|
Alexandria
Real Estate Equities, Inc.
2.000%, 5/18/32 |
18
|
|
17
|
Amazon.com,
Inc.
3.250%, 5/12/61 |
36
|
|
38
|
American
Airlines, Inc. 144A
5.500%, 4/20/26(2) |
30
|
|
32
|
| American
Express Co. |
|
|
|
| 3.550%
(3) |
30
|
|
31
|
| 3.625%,
12/5/24 |
35
|
|
38
|
| 8.150%,
3/19/38 |
45
|
|
71
|
| American
International Group, Inc. |
|
|
|
| 3.400%,
6/30/30 |
25
|
|
27
|
| 6.820%,
11/15/37 |
14
|
|
20
|
| American
Tower Corp. |
|
|
|
| 3.375%,
5/15/24 |
60
|
|
64
|
| 2.750%,
1/15/27 |
115
|
|
121
|
Amgen,
Inc.
2.000%, 1/15/32 |
100
|
|
96
|
| Analog
Devices, Inc. |
|
|
|
| 2.100%,
10/1/31 |
54
|
|
54
|
| |
Par
Value |
|
Value
|
| |
|
|
|
| United
States—continued |
|
|
| 2.800%,
10/1/41 |
$ 60
|
|
$ 60
|
Anheuser-Busch
InBev Finance, Inc.
4.000%, 1/17/43 |
75
|
|
83
|
Apple,
Inc.
2.700%, 8/5/51 |
60
|
|
58
|
Arizona
Public Service Co.
5.500%, 9/1/35 |
60
|
|
77
|
| AT&T,
Inc. |
|
|
|
| 5.250%,
3/1/37 |
45
|
|
56
|
| 3.100%,
2/1/43 |
108
|
|
104
|
| Athene
Global Funding |
|
|
|
| 144A
2.550%, 6/29/25(2) |
35
|
|
36
|
| 144A
2.500%, 3/24/28(2) |
25
|
|
26
|
Avnet,
Inc.
3.000%, 5/15/31 |
55
|
|
55
|
| Bank
of America Corp. |
|
|
|
| 2.456%,
10/22/25 |
90
|
|
94
|
| 2.496%,
2/13/31 |
80
|
|
81
|
Berkshire
Hathaway Finance Corp.
2.850%, 10/15/50 |
21
|
|
21
|
| Boeing
Co. (The) |
|
|
|
| 4.875%,
5/1/25 |
25
|
|
28
|
| 3.625%,
2/1/31 |
65
|
|
70
|
Boston
Gas Co. 144A
3.150%, 8/1/27(2) |
100
|
|
106
|
| Broadcom,
Inc. |
|
|
|
| 144A
1.950%, 2/15/28(2) |
18
|
|
18
|
| 144A
3.137%, 11/15/35(2) |
34
|
|
34
|
| 144A
3.500%, 2/15/41(2) |
18
|
|
18
|
Celgene
Corp.
5.000%, 8/15/45 |
23
|
|
27
|
Centene
Corp.
2.450%, 7/15/28 |
59
|
|
59
|
| Charter
Communications Operating LLC |
|
|
|
| 2.250%,
1/15/29 |
46
|
|
46
|
| 5.375%,
4/1/38 |
20
|
|
24
|
| Cigna
Corp. |
|
|
|
| 4.125%,
11/15/25 |
30
|
|
33
|
| 4.800%,
8/15/38 |
20
|
|
24
|
Citigroup,
Inc.
0.776%, 10/30/24 |
170
|
|
171
|
Consolidated
Edison Co. of New York, Inc. Series 03-C
5.100%, 6/15/33 |
16
|
|
19
|
| CVS
Health Corp. |
|
|
|
| 4.300%,
3/25/28 |
8
|
|
9
|
| 4.780%,
3/25/38 |
20
|
|
25
|
| 2.700%,
8/21/40 |
25
|
|
24
|
See Notes to Financial Statements
AllianzGI Global Dynamic
Allocation Fund
SCHEDULE OF INVESTMENTS (Continued)
September 30, 2021
($ reported in
thousands)
| |
Par
Value |
|
Value
|
| |
|
|
|
| United
States—continued |
|
|
Dell,
Inc.
7.100%, 4/15/28 |
$ 25
|
|
$ 32
|
| Delta
Air Lines, Inc. |
|
|
|
| 144A
7.000%, 5/1/25(2) |
48
|
|
56
|
| 144A
4.500%, 10/20/25(2) |
21
|
|
22
|
| Discover
Financial Services |
|
|
|
| 4.100%,
2/9/27 |
30
|
|
33
|
Series
C
5.500%(3) |
25
|
|
27
|
Discovery
Communications LLC
5.200%, 9/20/47 |
25
|
|
31
|
Dominion
Energy, Inc. Series C
2.250%, 8/15/31 |
100
|
|
100
|
DTE
Electric Co. Series A
4.050%, 5/15/48 |
40
|
|
48
|
Duke
Energy Corp.
3.250%, 1/15/82 |
34
|
|
34
|
| Duke
Energy Progress LLC |
|
|
|
| 3.450%,
3/15/29 |
85
|
|
94
|
| 6.125%,
9/15/33 |
20
|
|
26
|
Edison
International Series A
5.375% (3) |
25
|
|
26
|
El
Paso Natural Gas Co. LLC
8.375%, 6/15/32 |
52
|
|
76
|
| Energy
Transfer LP |
|
|
|
| 6.500%,
2/1/42 |
25
|
|
32
|
Series
G
7.125%(3) |
40
|
|
42
|
Series
H
6.500%(3) |
20
|
|
21
|
Equinix,
Inc.
1.000%, 9/15/25 |
75
|
|
74
|
First
Maryland Capital II (3 month LIBOR + 0.850%)
0.976%, 2/1/27(4) |
25
|
|
24
|
Ford
Motor Credit Co. LLC
3.350%, 11/1/22 |
185
|
|
188
|
GE
Capital Funding LLC
4.550%, 5/15/32 |
110
|
|
130
|
| General
Motors Co. |
|
|
|
| 4.875%,
10/2/23 |
45
|
|
49
|
| 5.150%,
4/1/38 |
50
|
|
60
|
| Global
Atlantic Fin Co. |
|
|
|
| 144A
3.125%, 6/15/31(2) |
40
|
|
40
|
| 144A
4.700%, 10/15/51(2) |
90
|
|
93
|
Goldman
Sachs Group, Inc. (The)
0.855%, 2/12/26 |
55
|
|
54
|
| Hasbro,
Inc. |
|
|
|
| 6.350%,
3/15/40 |
25
|
|
35
|
| |
Par
Value |
|
Value
|
| |
|
|
|
| United
States—continued |
|
|
| 5.100%,
5/15/44 |
$ 25
|
|
$ 30
|
HCA,
Inc.
5.875%, 2/15/26 |
60
|
|
69
|
Hess
Corp.
7.125%, 3/15/33 |
30
|
|
41
|
Huntington
Bancshares, Inc. Series F
5.625% (3) |
20
|
|
23
|
Huntington
Capital Trust I (3 month LIBOR + 0.700%)
0.826%, 2/1/27(4) |
65
|
|
63
|
Intel
Corp.
3.050%, 8/12/51 |
30
|
|
30
|
Intercontinental
Exchange, Inc.
2.650%, 9/15/40 |
25
|
|
24
|
| Jersey
Central Power & Light Co. |
|
|
|
| 6.150%,
6/1/37 |
65
|
|
87
|
| 144A
2.750%, 3/1/32(2) |
40
|
|
41
|
| JPMorgan
Chase & Co. |
|
|
|
| 0.768%,
8/9/25 |
110
|
|
110
|
| 3.328%,
4/22/52 |
25
|
|
26
|
Series
U (3 month LIBOR + 0.950%)
1.076%, 2/2/37(4) |
85
|
|
77
|
| Leidos,
Inc. |
|
|
|
| 2.300%,
2/15/31 |
95
|
|
93
|
| 7.125%,
7/1/32 |
8
|
|
11
|
Liberty
Mutual Group, Inc. 144A
4.125%, 12/15/51(2) |
76
|
|
78
|
Lincoln
National Corp. (3 month LIBOR + 2.358%)
2.482%, 5/17/66(4) |
45
|
|
41
|
Lowe’s
Cos., Inc.
2.800%, 9/15/41 |
47
|
|
46
|
M&T
Bank Corp.
3.500% (3) |
36
|
|
36
|
Marathon
Petroleum Corp.
5.850%, 12/15/45 |
45
|
|
58
|
Massachusetts
Institute of Technology
5.600%, 7/1/2111 |
15
|
|
26
|
Massachusetts
Mutual Life Insurance Co. 144A
5.077%, 2/15/69(2) |
150
|
|
185
|
MetLife,
Inc. 144A
9.250%, 4/8/38(2) |
95
|
|
144
|
Metropolitan
Life Insurance Co. 144A
7.800%, 11/1/25(2) |
130
|
|
161
|
| Microsoft
Corp. |
|
|
|
| 3.500%,
11/15/42 |
65
|
|
75
|
| 2.525%,
6/1/50 |
50
|
|
48
|
MidAmerican
Energy Co.
4.250%, 7/15/49 |
17
|
|
21
|
| |
Par
Value |
|
Value
|
| |
|
|
|
| United
States—continued |
|
|
Mileage
Plus Holdings LLC 144A
6.500%, 6/20/27(2) |
$ 90
|
|
$ 98
|
MSCI,
Inc. 144A
3.625%, 11/1/31(2) |
75
|
|
78
|
Netflix,
Inc.
4.875%, 4/15/28 |
55
|
|
63
|
New
York Life Insurance Co. 144A
4.450%, 5/15/69(2) |
20
|
|
25
|
New
York State Electric & Gas Corp. 144A
2.150%, 10/1/31(2) |
60
|
|
59
|
NextEra
Energy Capital Holdings, Inc.
1.900%, 6/15/28 |
80
|
|
80
|
NGPL
PipeCo LLC 144A
3.250%, 7/15/31(2) |
15
|
|
15
|
Niagara
Mohawk Power Corp. 144A
1.960%, 6/27/30(2) |
35
|
|
34
|
Northern
Natural Gas Co. 144A
3.400%, 10/16/51(2) |
22
|
|
22
|
Northwestern
Mutual Life Insurance Co. (The) 144A
3.850%, 9/30/47(2) |
44
|
|
50
|
NRG
Energy, Inc. 144A
2.450%, 12/2/27(2) |
141
|
|
143
|
Omnicom
Group, Inc.
2.600%, 8/1/31 |
25
|
|
25
|
| Pacific
Gas & Electric Co. |
|
|
|
| 4.500%,
12/15/41 |
10
|
|
10
|
| 4.950%,
7/1/50 |
40
|
|
43
|
Pacific
Life Global Funding II 144A
1.375%, 4/14/26(2) |
75
|
|
75
|
PacifiCorp.
2.900%, 6/15/52 |
10
|
|
10
|
| Pennsylvania
Electric Co. |
|
|
|
| 6.150%,
10/1/38 |
20
|
|
27
|
| 144A
4.150%, 4/15/25(2) |
32
|
|
34
|
| PepsiCo,
Inc. |
|
|
|
| 4.450%,
4/14/46 |
30
|
|
38
|
| 2.875%,
10/15/49 |
50
|
|
51
|
PerkinElmer,
Inc.
1.900%, 9/15/28 |
45
|
|
45
|
Pilgrim’s
Pride Corp. 144A
3.500%, 3/1/32(2) |
11
|
|
11
|
Plains
All American Pipeline LP Series B
6.125% (3) |
35
|
|
32
|
President
& Fellows of Harvard College
4.875%, 10/15/40 |
15
|
|
20
|
Public
Service Co. of Colorado
4.750%, 8/15/41 |
12
|
|
15
|
See Notes to Financial Statements
AllianzGI Global Dynamic
Allocation Fund
SCHEDULE OF INVESTMENTS (Continued)
September 30, 2021
($ reported in
thousands)
| |
Par
Value |
|
Value
|
| |
|
|
|
| United
States—continued |
|
|
Raytheon
Technologies Corp.
7.000%, 11/1/28 |
$ 100
|
|
$
130 |
salesforce.com,
Inc.
2.900%, 7/15/51 |
28
|
|
28
|
Sempra
Energy
3.550%, 6/15/24 |
30
|
|
32
|
Southern
California Edison Co.
3.900%, 12/1/41 |
25
|
|
26
|
Southern
Co. (The) Series A
3.750%, 9/15/51 |
26
|
|
26
|
State
Street Corp. (3 month LIBOR + 1.000%)
1.116%, 6/15/47(4) |
100
|
|
89
|
Targa
Resources Partners LP
5.500%, 3/1/30 |
55
|
|
60
|
Time
Warner Cable LLC
6.550%, 5/1/37 |
45
|
|
61
|
T-Mobile
USA, Inc.
2.250%, 2/15/26 |
29
|
|
29
|
Truist
Financial Corp.
1.267%, 3/2/27 |
80
|
|
80
|
Trustees
of Tufts College
3.099%, 8/15/51 |
40
|
|
42
|
Union
Pacific Corp.
3.750%, 2/5/70 |
13
|
|
15
|
United
Airlines, Inc. 144A
4.625%, 4/15/29(2) |
30
|
|
31
|
Utah
Acquisition Sub, Inc.
3.950%, 6/15/26 |
25
|
|
28
|
| Verizon
Communications, Inc. |
|
|
|
| 4.125%,
3/16/27 |
150
|
|
170
|
| 2.100%,
3/22/28 |
30
|
|
30
|
| 4.400%,
11/1/34 |
35
|
|
41
|
| 2.875%,
11/20/50 |
25
|
|
23
|
| ViacomCBS,
Inc. |
|
|
|
| 4.200%,
5/19/32 |
17
|
|
19
|
| 4.375%,
3/15/43 |
40
|
|
46
|
| 5.250%,
4/1/44 |
20
|
|
25
|
| 6.250%,
2/28/57 |
34
|
|
39
|
Viatris,
Inc. 144A
4.000%, 6/22/50(2) |
35
|
|
37
|
| VMware,
Inc. |
|
|
|
| 4.500%,
5/15/25 |
60
|
|
67
|
| 2.200%,
8/15/31 |
65
|
|
64
|
Walt
Disney Co. (The)
3.500%, 5/13/40 |
30
|
|
33
|
| |
|
|
7,619
|
Total
Corporate Bonds and Notes
(Identified Cost $9,150) |
|
9,203
|
| |
|
|
|
| |
| |
|
|
|
| |
| |
Shares
|
|
Value
|
| Preferred
Stocks—0.2% |
| Brazil—0.1%
|
|
|
| Banco
Bradesco S.A. |
2,390
|
|
$
9 |
| Cia
de Saneamento do Parana |
5,700
|
|
4
|
| Cia
Energetica de Minas Gerais |
2,194
|
|
6
|
| Cia
Paranaense de Energia |
4,400
|
|
6
|
| Petroleo
Brasileiro S.A. |
2,500
|
|
12
|
| |
|
|
37
|
| |
|
|
|
| |
| Chile—0.0%
|
|
|
| Embotelladora
Andina S.A. |
2,122
|
|
5
|
| Germany—0.1%
|
|
|
| Porsche
Automobil Holding SE |
99
|
|
10
|
| Volkswagen
AG |
77
|
|
17
|
| |
|
|
27
|
| |
|
|
|
| |
| South
Korea—0.0% |
|
|
| Samsung
Electronics Co., Ltd. |
213
|
|
12
|
| United
States—0.0% |
|
|
| Truist
Financial Corp. Series Q, 5.100% |
20
(5) |
|
23
|
Total
Preferred Stocks
(Identified Cost $83) |
|
104
|
| |
|
|
|
| |
| |
|
|
|
| |
| Common
Stocks—50.4% |
| Argentina—0.0%
|
|
|
| MercadoLibre,
Inc.(6) |
10
|
|
17
|
| Australia—0.4%
|
|
|
| Ansell
Ltd. |
263
|
|
6
|
| Atlassian
Corp. plc Class A(6) |
47
|
|
18
|
| BHP
Group Ltd. |
641
|
|
17
|
| Brambles
Ltd. |
799
|
|
6
|
| Commonwealth
Bank of Australia |
241
|
|
18
|
| CSL
Ltd. |
301
|
|
63
|
| Endeavour
Group Ltd. |
478
|
|
2
|
| Fortescue
Metals Group Ltd. |
675
|
|
7
|
| Harvey
Norman Holdings Ltd. |
1,698
|
|
6
|
| Integral
Diagnostics Ltd. |
1,025
|
|
4
|
| Medibank
Pvt Ltd. |
1,178
|
|
3
|
| Newcrest
Mining Ltd. |
96
|
|
2
|
| Qantas
Airways Ltd.(6) |
1,384
|
|
6
|
| Rio
Tinto Ltd. |
204
|
|
14
|
| Sonic
Healthcare Ltd. |
301
|
|
9
|
| Stockland
|
800
|
|
3
|
| Vicinity
Centres |
32,308
|
|
38
|
| |
Shares
|
|
Value
|
| |
|
|
|
| Australia—continued
|
|
|
| Woolworths
Group Ltd. |
700
|
|
$ 20
|
| |
|
|
242
|
| |
|
|
|
| |
| Austria—0.1%
|
|
|
| ams
AG(6) |
240
|
|
4
|
| BAWAG
Group AG(6) |
172
|
|
11
|
| Flughafen
Wien AG(6) |
67
|
|
2
|
| OMV
AG |
146
|
|
9
|
| Raiffeisen
Bank International AG |
402
|
|
11
|
| Telekom
Austria AG(6) |
267
|
|
2
|
| |
|
|
39
|
| |
|
|
|
| |
| Belgium—0.0%
|
|
|
| Ageas
S.A. |
58
|
|
3
|
| Bekaert
S.A. |
131
|
|
5
|
| Elia
Group S.A. |
21
|
|
3
|
| Etablissements
Franz Colruyt N.V. |
57
|
|
3
|
| Euronav
N.V. |
457
|
|
4
|
| Proximus
SADP |
182
|
|
4
|
| |
|
|
22
|
| |
|
|
|
| |
| Bermuda—0.2%
|
|
|
| Bunge
Ltd. |
100
|
|
8
|
| Haitong
International Securities Group Ltd. |
18,000
|
|
5
|
| Norwegian
Cruise Line Holdings Ltd.(6) |
3,080
|
|
82
|
| PAX
Global Technology Ltd. |
3,000
|
|
4
|
| |
|
|
99
|
| |
|
|
|
| |
| Brazil—0.3%
|
|
|
| Banco
do Brasil S.A. |
1,200
|
|
6
|
| EDP
- Energias do Brasil S.A. |
600
|
|
2
|
| Engie
Brasil Energia S.A. |
800
|
|
6
|
| StoneCo
Ltd. Class A(6) |
4,387
|
|
152
|
| Telefonica
Brasil S.A. |
600
|
|
5
|
| Vale
S.A. |
1,145
|
|
16
|
| WEG
S.A. |
1,200
|
|
9
|
| |
|
|
196
|
| |
|
|
|
| |
| Canada—1.4%
|
|
|
| Agnico
Eagle Mines Ltd. |
1,570
|
|
81
|
| Alimentation
Couche-Tard, Inc. Class B |
210
|
|
8
|
| B2Gold
Corp. |
2,156
|
|
7
|
| Bank
of Montreal |
123
|
|
12
|
| Barrick
Gold Corp. |
4,927
|
|
89
|
| Baytex
Energy Corp.(6) |
1,346
|
|
4
|
| Canadian
Natural Resources, Ltd. |
184
|
|
7
|
| Canadian
Tire Corp., Ltd. Class A |
87
|
|
12
|
| Cascades,
Inc. |
716
|
|
9
|
See Notes to Financial Statements
AllianzGI Global Dynamic
Allocation Fund
SCHEDULE OF INVESTMENTS (Continued)
September 30, 2021
($ reported in
thousands)
| |
Shares
|
|
Value
|
| |
|
|
|
| Canada—continued
|
|
|
| Cenovus
Energy, Inc. |
577
|
|
$ 6
|
| Cogeco
Communications, Inc. |
150
|
|
13
|
| Crescent
Point Energy Corp. |
346
|
|
2
|
| DREAM
Unlimited Corp. |
525
|
|
12
|
| Empire
Co., Ltd. Class A |
587
|
|
18
|
| Exchange
Income Corp. |
205
|
|
7
|
| Fairfax
Financial Holdings, Ltd. |
13
|
|
5
|
| First
Quantum Minerals, Ltd. |
700
|
|
13
|
| Franco-Nevada
Corp. |
178
|
|
23
|
| George
Weston, Ltd. |
218
|
|
24
|
| Hydro
One Ltd. |
268
|
|
6
|
| iA
Financial Corp, Inc. |
235
|
|
13
|
| Intact
Financial Corp. |
76
|
|
10
|
| InterRent
Real Estate Investment Trust |
74
|
|
1
|
| Killam
Apartment Real Estate Investment Trust |
152
|
|
3
|
| Kinross
Gold Corp. |
15,000
|
|
80
|
| Kirkland
Lake Gold Ltd. |
2,400
|
|
100
|
| LifeWorks,
Inc. |
86
|
|
2
|
| Loblaw
Cos., Ltd. |
286
|
|
20
|
| Manulife
Financial Corp. |
937
|
|
18
|
| Metro,
Inc. Class A |
153
|
|
7
|
| Mullen
Group Ltd. |
867
|
|
9
|
| Open
Text Corp. |
226
|
|
11
|
| Power
Corp. of Canada |
667
|
|
22
|
| Shopify,
Inc. Class A(6) |
33
|
|
45
|
| Sun
Life Financial, Inc. |
305
|
|
16
|
| Topaz
Energy Corp. |
202
|
|
3
|
| Waste
Connections, Inc. |
132
|
|
17
|
| Wheaton
Precious Metals Corp. |
2,106
|
|
79
|
| |
|
|
814
|
| |
|
|
|
| |
| Cayman
Islands—0.1% |
|
|
| Wynn
Macau Ltd.(6) |
91,600
|
|
77
|
| Chile—0.0%
|
|
|
| Engie
Energia Chile S.A. |
3,778
|
|
3
|
| Sociedad
Quimica y Minera de Chile S.A Sponsored ADR |
400
|
|
21
|
| |
|
|
24
|
| |
|
|
|
| |
| China—2.6%
|
|
|
| Agricultural
Bank of China Ltd. Class H |
25,000
|
|
9
|
| Alibaba
Group Holding Ltd. Sponsored ADR(6) |
1,242
|
|
184
|
| Baidu,
Inc. Sponsored ADR(6) |
57
|
|
9
|
| Bank
of China Ltd. Class H |
63,000
|
|
22
|
| Bank
of Communications Co., Ltd. Class H |
18,000
|
|
11
|
| China
CITIC Bank Corp. Ltd. Class H |
12,000
|
|
5
|
| |
Shares
|
|
Value
|
| |
|
|
|
| China—continued
|
|
|
| China
Conch Venture Holdings Ltd. |
2,500
|
|
$ 12
|
| China
Construction Bank Corp. Class H |
48,812
|
|
35
|
| China
Dongxiang Group Co., Ltd. |
16,117
|
|
2
|
| China
Everbright Greentech Ltd. |
8,000
|
|
3
|
| China
Life Insurance Co., Ltd. Class H |
4,000
|
|
6
|
| China
Minsheng Banking Corp. Ltd. Class H |
9,000
|
|
4
|
| China
SCE Group Holdings Ltd. |
3,000
|
|
1
|
| China
Water Affairs Group Ltd. |
2,000
|
|
2
|
| Chinasoft
International Ltd.(6) |
4,000
|
|
7
|
| Chongqing
Rural Commercial Bank Co., Ltd. Class H |
6,488
|
|
2
|
| CIFI
Holdings Group Co., Ltd. |
193,000
|
|
131
|
| Country
Garden Holdings Co., Ltd. |
90,000
|
|
93
|
| Country
Garden Services Holdings Co., Ltd. |
3,172
|
|
25
|
| CSPC
Pharmaceutical Group Ltd. |
11,440
|
|
14
|
| EVA
Precision Industrial Holdings Ltd. |
20,236
|
|
2
|
| Golden
Eagle Retail Group Ltd. |
3,000
|
|
3
|
| Industrial
& Commercial Bank of China Ltd. Class H |
35,000
|
|
19
|
| JD.com,
Inc. ADR(6) |
151
|
|
11
|
| Jiangsu
Expressway Co., Ltd. Class H |
3,189
|
|
3
|
| Ju
Teng International Holdings Ltd. |
4,744
|
|
1
|
| Lee
& Man Paper Manufacturing Ltd. |
6,000
|
|
4
|
| Lenovo
Group Ltd. |
26,000
|
|
34
|
| NetEase,
Inc. ADR |
228
|
|
19
|
| NIO,
Inc. ADR(6) |
353
|
|
13
|
| Postal
Savings Bank of China Co., Ltd. Class H |
30,000
|
|
21
|
| Powerlong
Real Estate Holdings Ltd. |
195,000
|
|
147
|
| Seazen
Group Ltd.(6) |
170,000
|
|
136
|
| Shanghai
Electric Group Co., Ltd. Class H |
18,000
|
|
6
|
| Shenzhen
Expressway Co., Ltd. Class H |
5,700
|
|
6
|
| Shenzhen
Investment Holdings Bay Area Development Co., Ltd. |
6,000
|
|
2
|
| Sinopec
Engineering Group Co., Ltd. Class H |
12,000
|
|
6
|
| |
Shares
|
|
Value
|
| |
|
|
|
| China—continued
|
|
|
| Sinopharm
Group Co., Ltd. Class H |
2,000
|
|
$ 5
|
| Sunac
China Holdings Ltd. |
58,000
|
|
124
|
| Tencent
Holdings Ltd. |
4,781
|
|
285
|
| Tingyi
Cayman Islands Holding Corp. |
4,000
|
|
7
|
| Topsports
International Holdings Ltd. |
2,000
|
|
2
|
| Vipshop
Holdings Ltd. ADR(6) |
307
|
|
3
|
| Xinyi
Solar Holdings Ltd. |
6,000
|
|
12
|
| Zhuzhou
CRRC Times Electric Co. Class H(6) |
1,600
|
|
7
|
| |
|
|
1,455
|
| |
|
|
|
| |
| Colombia—0.0%
|
|
|
| Bancolombia
S.A. |
939
|
|
8
|
| Corp.
Financiera Colombiana S.A.(6) |
1,390
|
|
11
|
| |
|
|
19
|
| |
|
|
|
| |
| Czech
Republic—0.0% |
|
|
| CEZ
AS |
58
|
|
2
|
| Moneta
Money Bank AS(6) |
492
|
|
2
|
| O2
Czech Republic AS(6) |
318
|
|
4
|
| |
|
|
8
|
| |
|
|
|
| |
| Denmark—1.0%
|
|
|
| Ambu
A/S Class B |
4,350
|
|
129
|
| Carlsberg
AS Class B |
60
|
|
10
|
| Coloplast
A/S Class B |
394
|
|
62
|
| D/S
Norden A/S |
343
|
|
9
|
| DSV
A/S |
861
|
|
206
|
| Novo
Nordisk A/S Class B |
1,614
|
|
155
|
| Scandinavian
Tobacco Group A/S |
122
|
|
2
|
| Solar
A/S Class B |
31
|
|
3
|
| Spar
Nord Bank A/S |
137
|
|
2
|
| Tryg
A/S |
214
|
|
5
|
| |
|
|
583
|
| |
|
|
|
| |
| Finland—0.1%
|
|
|
| Elisa
Oyj |
376
|
|
23
|
| Kesko
Oyj Class B |
140
|
|
5
|
| Oriola
Oyj Class B |
700
|
|
1
|
| TietoEVRY
Oyj |
186
|
|
6
|
| |
|
|
35
|
| |
|
|
|
| |
| France—1.7%
|
|
|
| Accor
S.A.(6) |
850
|
|
30
|
| Aeroports
de Paris(6) |
310
|
|
39
|
| APERAM
S.A. |
51
|
|
3
|
| AXA
S.A. |
854
|
|
24
|
| BNP
Paribas S.A. |
312
|
|
20
|
| Boiron
S.A. |
31
|
|
1
|
| Bouygues
S.A |
892
|
|
37
|
| Carrefour
S.A. |
720
|
|
13
|
See Notes to Financial Statements
AllianzGI Global Dynamic
Allocation Fund
SCHEDULE OF INVESTMENTS (Continued)
September 30, 2021
($ reported in
thousands)
| |
Shares
|
|
Value
|
| |
|
|
|
| France—continued
|
|
|
| Cie
de Saint-Gobain |
232
|
|
$ 16
|
| CNP
Assurances |
744
|
|
12
|
| Coface
S.A.(6) |
627
|
|
8
|
| Credit
Agricole S.A. |
702
|
|
10
|
| Dassault
Aviation S.A. |
500
|
|
56
|
| Eiffage
S.A |
376
|
|
38
|
| Faurecia
SE |
16
|
|
1
|
| Getlink
SE |
1,930
|
|
30
|
| Hermes
International |
9
|
|
12
|
| L’Oreal
S.A. |
292
|
|
121
|
| LVMH
Moet Hennessy Louis Vuitton SE |
328
|
|
235
|
| Orange
S.A |
2,243
|
|
24
|
| Publicis
Groupe S.A. |
176
|
|
12
|
| Safran
S.A. |
500
|
|
63
|
| Sanofi
|
257
|
|
25
|
| Schneider
Electric SE |
158
|
|
26
|
| SEB
S.A |
7
|
|
1
|
| Sodexo
S.A.(6) |
600
|
|
52
|
| Teleperformance
|
38
|
|
15
|
| TotalEnergies
SE |
439
|
|
21
|
| Vinci
S.A. |
345
|
|
36
|
| |
|
|
981
|
| |
|
|
|
| |
| Germany—1.9%
|
|
|
| adidas
AG |
504
|
|
158
|
| BASF
SE |
257
|
|
20
|
| Bayer
AG Registered Shares |
211
|
|
11
|
| Bayerische
Motoren Werke AG |
202
|
|
19
|
| Daimler
AG Registered Shares |
294
|
|
26
|
| Dermapharm
Holding SE |
35
|
|
3
|
| Deutsche
Lufthansa AG Registered Shares(6) |
12,000
|
|
82
|
| Deutsche
Post AG Registered Shares |
585
|
|
37
|
| Deutsche
Telekom AG Registered Shares |
2,240
|
|
45
|
| DWS
Group GmbH & Co. KGaA |
185
|
|
8
|
| Fraport
AG Frankfurt Airport Services Worldwide(6) |
520
|
|
36
|
| HeidelbergCement
AG |
202
|
|
15
|
| HOCHTIEF
AG |
500
|
|
40
|
| Hornbach
Holding AG & Co. KGaA |
85
|
|
11
|
| Infineon
Technologies AG |
2,253
|
|
92
|
| LEG
Immobilien SE |
42
|
|
6
|
| MTU
Aero Engines AG |
98
|
|
22
|
| Nemetschek
SE |
1,035
|
|
108
|
| SAP
SE |
948
|
|
128
|
| Talanx
AG |
31
|
|
1
|
| TeamViewer
AG(6) |
157
|
|
5
|
| TLG
Immobilien AG |
155
|
|
5
|
| TUI
AG(6) |
13,100
|
|
57
|
| |
Shares
|
|
Value
|
| |
|
|
|
| Germany—continued
|
|
|
| WCM
Beteiligungs- und Grundbesitz-AG |
518
|
|
$ 3
|
| Zalando
SE(6) |
1,291
|
|
118
|
| |
|
|
1,056
|
| |
|
|
|
| |
| Greece—0.0%
|
|
|
| Hellenic
Telecommunications Organization S.A. |
249
|
|
5
|
| National
Bank of Greece S.A.(6) |
3,034
|
|
8
|
| |
|
|
13
|
| |
|
|
|
| |
| Hong
Kong—1.6% |
|
|
| AIA
Group Ltd. |
11,400
|
|
131
|
| Bosideng
International Holdings Ltd. |
8,000
|
|
6
|
| Cathay
Pacific Airways Ltd.(6) |
85,543
|
|
71
|
| China
Jinmao Holdings Group Ltd. |
416,000
|
|
150
|
| China
Lumena New Materials Corp.(6)(7) |
44
|
|
—
|
| China
Overseas Land & Investment Ltd. |
67,000
|
|
152
|
| CITIC
Telecom International Holdings Ltd. |
9,000
|
|
3
|
| CK
Asset Holdings Ltd. |
2,529
|
|
15
|
| CLP
Holdings Ltd. |
1,781
|
|
17
|
| Fairwood
Holdings Ltd. |
1,500
|
|
3
|
| Global
Brands Group Holding Ltd.(6)(7) |
61,400
|
|
—
|
| Hongkong
Land Holdings Ltd. |
11,700
|
|
56
|
| Hui
Xian Real Estate Investment Trust |
6,000
|
|
1
|
| Hysan
Development Co., Ltd. |
7,000
|
|
23
|
| Jardine
Matheson Holdings Ltd. |
300
|
|
16
|
| Kerry
Properties Ltd. |
1,243
|
|
3
|
| Kingboard
Holdings Ltd. |
500
|
|
2
|
| Link
REIT |
6,377
|
|
55
|
| Power
Assets Holdings Ltd. |
1,000
|
|
6
|
| Shanghai
Industrial Urban Development Group Ltd. |
17,000
|
|
1
|
| Shimao
Group Holdings Ltd. |
48,000
|
|
88
|
| SITC
International Holdings Co., Ltd. |
2,000
|
|
7
|
| Sun
Hung Kai Properties Ltd. |
500
|
|
6
|
| Vinda
International Holdings Ltd. |
2,000
|
|
6
|
| Wharf
Real Estate Investment Co., Ltd. |
11,000
|
|
57
|
| Xinyi
Glass Holdings Ltd. |
1,000
|
|
3
|
| |
Shares
|
|
Value
|
| |
|
|
|
| Hong
Kong—continued |
|
|
| Yue
Yuen Industrial Holdings Ltd.(6) |
698
|
|
$ 1
|
| Yuexiu
Real Estate Investment Trust |
5,000
|
|
2
|
| |
|
|
881
|
| |
|
|
|
| |
| Hungary—0.0%
|
|
|
| Magyar
Telekom Telecommunications plc |
2,911
|
|
4
|
| OTP
Bank Nyrt(6) |
98
|
|
6
|
| Richter
Gedeon Nyrt |
282
|
|
7
|
| |
|
|
17
|
| |
|
|
|
| |
| India—0.2%
|
|
|
| HDFC
Bank Ltd. ADR |
1,537
|
|
112
|
| Reliance
Industries Ltd. Sponsored GDR 144A(2) |
202
|
|
14
|
| |
|
|
126
|
| |
|
|
|
| |
| Indonesia—0.0%
|
|
|
| Indofood
CBP Sukses Makmur Tbk PT |
10,700
|
|
6
|
| Media
Nusantara Citra Tbk PT |
104,600
|
|
6
|
| |
|
|
12
|
| |
|
|
|
| |
| Ireland—0.4%
|
|
|
| Flutter
Entertainment plc(6) |
59
|
|
12
|
| Horizon
Therapeutics plc(6) |
69
|
|
8
|
| Irish
Residential Properties REIT plc |
403
|
|
1
|
| Johnson
Controls International plc |
213
|
|
14
|
| Kingspan
Group plc |
1,236
|
|
123
|
| Origin
Enterprises plc |
320
|
|
1
|
| Seagate
Technology Holdings plc |
179
|
|
15
|
| Trane
Technologies plc |
119
|
|
20
|
| Willis
Towers Watson plc |
52
|
|
12
|
| |
|
|
206
|
| |
|
|
|
| |
| Isle
of Man—0.0% |
|
|
| Entain
plc(6) |
162
|
|
5
|
| Israel—0.0%
|
|
|
| Alony
Hetz Properties & Investments Ltd. |
445
|
|
7
|
| B
Communications Ltd.(6) |
749
|
|
2
|
| Check
Point Software Technologies Ltd.(6) |
39
|
|
4
|
| Formula
Systems 1985 Ltd. |
85
|
|
8
|
See Notes to Financial Statements
AllianzGI Global Dynamic
Allocation Fund
SCHEDULE OF INVESTMENTS (Continued)
September 30, 2021
($ reported in
thousands)
| |
Shares
|
|
Value
|
| |
|
|
|
| Israel—continued
|
|
|
| Shufersal
Ltd. |
278
|
|
$ 2
|
| |
|
|
23
|
| |
|
|
|
| |
| Italy—0.3%
|
|
|
| Assicurazioni
Generali SpA |
852
|
|
18
|
| Atlantia
SpA(6) |
1,720
|
|
33
|
| Autogrill
SpA(6) |
3,890
|
|
32
|
| De’
Longhi SpA |
57
|
|
2
|
| DiaSorin
SpA |
26
|
|
5
|
| Enav
SpA(6) |
492
|
|
2
|
| Enel
SpA |
2,171
|
|
17
|
| Intesa
Sanpaolo SpA |
8,302
|
|
24
|
| Telecom
Italia SpA |
11,193
|
|
4
|
| Unipol
Gruppo SpA |
912
|
|
5
|
| |
|
|
142
|
| |
|
|
|
| |
| Japan—3.8%
|
|
|
| ABC-Mart,
Inc. |
3,200
|
|
180
|
| ADEKA
Corp. |
26
|
|
1
|
| AGC,
Inc. |
200
|
|
10
|
| Aida
Engineering Ltd. |
142
|
|
1
|
| ANA
Holdings, Inc.(6) |
5,000
|
|
130
|
| Aoyama
Trading Co., Ltd.(6) |
111
|
|
1
|
| Asahi
Kasei Corp. |
300
|
|
3
|
| Canon
Marketing Japan, Inc. |
300
|
|
7
|
| Canon,
Inc. |
810
|
|
20
|
| Capcom
Co., Ltd. |
500
|
|
14
|
| Cawachi
Ltd. |
300
|
|
6
|
| Central
Japan Railway Co. |
800
|
|
128
|
| Chubu
Electric Power Co., Inc. |
700
|
|
8
|
| Chugai
Pharmaceutical Co., Ltd. |
300
|
|
11
|
| Daiichi
Sankyo Co., Ltd. |
400
|
|
11
|
| Daiwabo
Holdings Co., Ltd. |
200
|
|
3
|
| DCM
Holdings Co., Ltd. |
525
|
|
5
|
| Doutor
Nichires Holdings Co., Ltd. |
451
|
|
7
|
| DyDo
Group Holdings, Inc. |
126
|
|
6
|
| Earth
Corp. |
100
|
|
6
|
| ENEOS
Holdings, Inc. |
1,500
|
|
6
|
| FUJIFILM
Holdings Corp. |
321
|
|
28
|
| Fukuyama
Transporting Co., Ltd. |
145
|
|
6
|
| H.U.
Group Holdings, Inc. |
200
|
|
5
|
| Hankyu
Hanshin Holdings, Inc. |
100
|
|
3
|
| HIS
Co., Ltd.(6) |
5,600
|
|
148
|
| Hitachi
Ltd. |
200
|
|
12
|
| Honda
Motor Co., Ltd. |
400
|
|
12
|
| Honeys
Holdings Co., Ltd. |
39
|
|
—
(8) |
| Inpex
Corp. |
600
|
|
5
|
| |
Shares
|
|
Value
|
| |
|
|
|
| Japan—continued
|
|
|
| ITOCHU
Corp. |
477
|
|
$ 14
|
| Iwatani
Corp. |
200
|
|
12
|
| Japan
Post Bank Co., Ltd. |
1,100
|
|
9
|
| Japan
Post Holdings Co., Ltd. |
2,900
|
|
24
|
| Japan
Wool Textile Co., Ltd. (The) |
500
|
|
5
|
| Kajima
Corp. |
400
|
|
5
|
| Kakaku.com,
Inc. |
3,900
|
|
126
|
| Kamigumi
Co., Ltd. |
300
|
|
6
|
| Kandenko
Co., Ltd. |
600
|
|
5
|
| Kao
Corp. |
200
|
|
12
|
| KDDI
Corp. |
800
|
|
26
|
| Keyence
Corp. |
200
|
|
119
|
| Konica
Minolta, Inc. |
1,500
|
|
8
|
| Marui
Group Co., Ltd. |
6,600
|
|
127
|
| McDonald’s
Holdings Co. Japan Ltd. |
100
|
|
5
|
| Mirait
Holdings Corp. |
500
|
|
10
|
| Mitsubishi
Corp. |
400
|
|
13
|
| Mitsubishi
Electric Corp. |
400
|
|
6
|
| Mitsubishi
Estate Co., Ltd. |
300
|
|
5
|
| Mitsubishi
HC Capital, Inc. |
2,100
|
|
11
|
| Mitsubishi
Research Institute, Inc. |
100
|
|
4
|
| Mitsuboshi
Belting Ltd. |
71
|
|
1
|
| Mitsui
& Co., Ltd. |
500
|
|
11
|
| Mizuho
Financial Group, Inc. |
1,600
|
|
23
|
| MonotaRO
Co., Ltd. |
1,700
|
|
38
|
| Morinaga
Milk Industry Co., Ltd. |
100
|
|
6
|
| NEC
Corp. |
400
|
|
22
|
| NGK
Insulators Ltd. |
400
|
|
7
|
| NGK
Spark Plug Co., Ltd. |
200
|
|
3
|
| Nihon
M&A Center Holdings, Inc. |
300
|
|
9
|
| Nippo
Corp. |
200
|
|
7
|
| Nippon
Telegraph & Telephone Corp. |
1,316
|
|
37
|
| Nippon
Yusen KK |
200
|
|
15
|
| Nitori
Holdings Co., Ltd. |
100
|
|
20
|
| Nomura
Holdings, Inc. |
2,500
|
|
12
|
| Nomura
Real Estate Holdings, Inc. |
200
|
|
5
|
| Obayashi
Corp. |
900
|
|
7
|
| Okumura
Corp. |
200
|
|
5
|
| Oracle
Corp. Japan |
100
|
|
9
|
| Osaka
Gas Co., Ltd. |
400
|
|
7
|
| Raito
Kogyo Co., Ltd. |
363
|
|
6
|
| Renesas
Electronics Corp.(6) |
500
|
|
6
|
| Rengo
Co., Ltd. |
400
|
|
3
|
| Rinnai
Corp. |
100
|
|
11
|
| Rohm
Co., Ltd. |
100
|
|
9
|
| Ryohin
Keikaku Co., Ltd. |
6,000
|
|
134
|
| Sankyo
Co., Ltd. |
300
|
|
8
|
| |
Shares
|
|
Value
|
| |
|
|
|
| Japan—continued
|
|
|
| Sanyo
Special Steel Co., Ltd. |
182
|
|
$ 3
|
| Sawai
Group Holdings Co., Ltd. |
225
|
|
11
|
| Secom
Co., Ltd. |
300
|
|
22
|
| Sekisui
House Ltd. |
700
|
|
15
|
| Senko
Group Holdings Co., Ltd. |
496
|
|
5
|
| Seven
& i Holdings Co., Ltd. |
300
|
|
14
|
| Shibaura
Electronics Co., Ltd. |
100
|
|
6
|
| SKY
Perfect JSAT Holdings, Inc. |
800
|
|
3
|
| SoftBank
Corp. |
900
|
|
12
|
| SoftBank
Group Corp. |
300
|
|
17
|
| Sony
Corp. |
200
|
|
22
|
| Sugi
Holdings Co., Ltd. |
200
|
|
15
|
| Sumitomo
Densetsu Co., Ltd. |
200
|
|
4
|
| Sumitomo
Electric Industries Ltd. |
500
|
|
7
|
| Sumitomo
Heavy Industries Ltd. |
300
|
|
8
|
| Sumitomo
Mitsui Financial Group, Inc. |
400
|
|
14
|
| Sumitomo
Rubber Industries Ltd. |
800
|
|
10
|
| Sysmex
Corp. |
100
|
|
12
|
| Takasago
Thermal Engineering Co., Ltd. |
397
|
|
8
|
| Takeda
Pharmaceutical Co., Ltd. |
400
|
|
13
|
| TIS,
Inc. |
100
|
|
3
|
| Tokyo
Electron Ltd. |
100
|
|
44
|
| Towa
Pharmaceutical Co., Ltd. |
214
|
|
6
|
| Toyo
Suisan Kaisha Ltd. |
300
|
|
13
|
| Toyota
Motor Corp. |
2,755
|
|
49
|
| Tv
Tokyo Holdings Corp. |
166
|
|
3
|
| Yakult
Honsha Co., Ltd. |
100
|
|
5
|
| Yamada
Holdings Co., Ltd. |
1,500
|
|
6
|
| Yamaha
Corp. |
100
|
|
6
|
| Yamaha
Motor Co., Ltd. |
300
|
|
8
|
| Yaoko
Co., Ltd. |
100
|
|
6
|
| Yokohama
Rubber Co., Ltd. (The) |
200
|
|
4
|
| Yurtec
Corp. |
132
|
|
1
|
| |
|
|
2,131
|
| |
|
|
|
| |
| Jersey—0.1%
|
|
|
| Amcor
plc |
51
|
|
1
|
| Aptiv
plc(6) |
62
|
|
9
|
| Ferguson
plc |
122
|
|
17
|
| |
|
|
27
|
| |
|
|
|
| |
| Luxembourg—0.1%
|
|
|
| ArcelorMittal
S.A. |
441
|
|
13
|
See Notes to Financial Statements
AllianzGI Global Dynamic
Allocation Fund
SCHEDULE OF INVESTMENTS (Continued)
September 30, 2021
($ reported in
thousands)
| |
Shares
|
|
Value
|
| |
|
|
|
| Luxembourg—continued
|
|
|
| Eurofins
Scientific SE |
99
|
|
$ 13
|
| |
|
|
26
|
| |
|
|
|
| |
| Malaysia—0.1%
|
|
|
| Axis
Real Estate Investment Trust |
4,100
|
|
2
|
| Bermaz
Auto Bhd |
3,500
|
|
1
|
| Dialog
Group Bhd |
5,400
|
|
3
|
| Hong
Leong Bank Bhd |
1,000
|
|
4
|
| KNM
Group Bhd(6) |
31,700
|
|
2
|
| Malayan
Banking Bhd |
2,900
|
|
6
|
| MBM
Resources BHD |
7,800
|
|
6
|
| MISC
Bhd |
1,600
|
|
3
|
| Tenaga
Nasional Bhd |
1,500
|
|
3
|
| TIME
dotCom Bhd |
5,700
|
|
6
|
| |
|
|
36
|
| |
|
|
|
| |
| Mexico—0.1%
|
|
|
| Alfa
SAB de CV Class A |
10,100
|
|
7
|
| Alpek
SAB de CV |
5,700
|
|
7
|
| Banco
del Bajio S.A. |
1,800
|
|
4
|
| Grupo
Financiero Banorte SAB de CV Class O |
1,600
|
|
10
|
| Grupo
Financiero Inbursa SAB de CV Class O(6) |
2,500
|
|
2
|
| Grupo
Lala SAB de CV Class B |
4
|
|
—
(8) |
| Macquarie
Mexico Real Estate Management SA de CV |
5,300
|
|
6
|
| Nemak
SAB de CV(6) |
19,369
|
|
5
|
| Qualitas
Controladora SAB de CV |
700
|
|
3
|
| |
|
|
44
|
| |
|
|
|
| |
| Morocco—0.0%
|
|
|
| Co.
Sucrerie Marocaine et de Raffinage |
74
|
|
2
|
| Douja
Promotion Groupe Addoha S.A.(6) |
1,239
|
|
2
|
| |
|
|
4
|
| |
|
|
|
| |
| Netherlands—1.3%
|
|
|
| Adyen
N.V.(6) |
5
|
|
14
|
| Aegon
N.V. |
1,165
|
|
6
|
| AerCap
Holdings N.V.(6) |
152
|
|
9
|
| Airbus
SE(6) |
512
|
|
68
|
| ASM
International N.V. |
36
|
|
14
|
| ASML
Holding N.V. |
705
|
|
527
|
| ASR
Nederland N.V. |
209
|
|
9
|
| Flow
Traders |
102
|
|
4
|
| ForFarmers
N.V. |
812
|
|
4
|
| Koninklijke
Ahold Delhaize N.V. |
928
|
|
31
|
| NN
Group N.V. |
291
|
|
15
|
| Prosus
N.V.(6) |
126
|
|
10
|
| Signify
N.V. |
122
|
|
6
|
| |
Shares
|
|
Value
|
| |
|
|
|
| Netherlands—continued
|
|
|
| Stellantis
N.V. |
471
|
|
$ 9
|
| VEON
Ltd. ADR(6) |
1,300
|
|
3
|
| |
|
|
729
|
| |
|
|
|
| |
| New
Zealand—0.3% |
|
|
| Air
New Zealand Ltd.(6) |
1,891
|
|
2
|
| Arvida
Group Ltd. |
1,779
|
|
3
|
| Fisher
& Paykel Healthcare Corp., Ltd. |
577
|
|
13
|
| Kiwi
Property Group Ltd. |
1,590
|
|
1
|
| Mainfreight
Ltd. |
1,711
|
|
114
|
| Summerset
Group Holdings Ltd. |
771
|
|
8
|
| |
|
|
141
|
| |
|
|
|
| |
| Norway—0.1%
|
|
|
| Avance
Gas Holding Ltd. |
1,399
|
|
7
|
| Frontline,
Ltd. |
831
|
|
7
|
| Orkla
ASA |
405
|
|
4
|
| Sparebanken
Vest |
709
|
|
8
|
| TGS
ASA |
423
|
|
4
|
| Yara
International ASA |
166
|
|
8
|
| |
|
|
38
|
| |
|
|
|
| |
| Panama—0.2%
|
|
|
| Carnival
Corp.(6) |
3,300
|
|
83
|
| Peru—0.0%
|
|
|
| Ferreycorp
SAA |
7,075
|
|
3
|
| Philippines—0.0%
|
|
|
| Globe
Telecom, Inc. |
70
|
|
4
|
| PLDT,
Inc. |
95
|
|
3
|
| |
|
|
7
|
| |
|
|
|
| |
| Poland—0.0%
|
|
|
| Asseco
Poland S.A |
218
|
|
5
|
| Ciech
S.A. |
206
|
|
2
|
| TEN
Square Games S.A. |
70
|
|
9
|
| |
|
|
16
|
| |
|
|
|
| |
| Portugal—0.0%
|
|
|
| Jeronimo
Martins SGPS S.A. |
555
|
|
11
|
| REN
- Redes Energeticas Nacionais SGPS S.A |
627
|
|
2
|
| |
|
|
13
|
| |
|
|
|
| |
| Singapore—1.2%
|
|
|
| BOC
Aviation Ltd. |
1,100
|
|
9
|
| ComfortDelGro
Corp., Ltd. |
90,200
|
|
100
|
| DBS
Group Holdings Ltd. |
600
|
|
13
|
| Fortune
Real Estate Investment Trust |
5,000
|
|
5
|
| Frasers
Logistics & Commercial Trust |
5,300
|
|
6
|
| Genting
Singapore Ltd. |
248,500
|
|
131
|
| |
Shares
|
|
Value
|
| |
|
|
|
| Singapore—continued
|
|
|
| Parkway
Life Real Estate Investment Trust |
600
|
|
$ 2
|
| SATS
Ltd.(6) |
31,600
|
|
96
|
| Sea
Ltd. ADR(6) |
626
|
|
199
|
| Sheng
Siong Group Ltd. |
1,900
|
|
2
|
| Singapore
Airlines Ltd.(6) |
29,500
|
|
109
|
| Sino
Grandness Food Industry Group Ltd.(6)(7) |
25,900
|
|
—
|
| |
|
|
672
|
| |
|
|
|
| |
| South
Africa—0.1% |
|
|
| Anglo
American Platinum Ltd. |
74
|
|
6
|
| Impala
Platinum Holdings Ltd. |
1,124
|
|
13
|
| MTN
Group Ltd.(6) |
1,903
|
|
18
|
| Nedbank
Group Ltd. |
762
|
|
9
|
| Old
Mutual Ltd. |
8,447
|
|
9
|
| Sibanye
Stillwater Ltd. |
2,068
|
|
6
|
| Thungela
Resources Ltd.(6) |
91
|
|
1
|
| |
|
|
62
|
| |
|
|
|
| |
| South
Korea—0.9% |
|
|
| CJ
CheilJedang Corp. |
14
|
|
5
|
| CJ
Corp. |
79
|
|
7
|
| DB
HiTek Co., Ltd. |
72
|
|
3
|
| DB
Insurance Co., Ltd. |
97
|
|
5
|
| DGB
Financial Group, Inc. |
503
|
|
4
|
| DL
E&C Co., Ltd.(6) |
64
|
|
7
|
| GS
Holdings Corp. |
127
|
|
5
|
| Hana
Financial Group, Inc. |
231
|
|
9
|
| Hankook
Tire & Technology Co., Ltd. |
103
|
|
4
|
| HDC
Hyundai Development Co-Engineering & Construction |
1
|
|
—
(8) |
| JB
Financial Group Co., Ltd. |
657
|
|
5
|
| Kakao
Corp. |
92
|
|
9
|
| Kangwon
Land, Inc.(6) |
4,820
|
|
116
|
| KB
Financial Group, Inc. |
134
|
|
6
|
| KC
Co., Ltd. |
70
|
|
1
|
| Kia
Corp. |
132
|
|
9
|
| Korea
Gas Corp.(6) |
155
|
|
6
|
| KT
Corp. |
379
|
|
10
|
| KT&G
Corp. |
66
|
|
5
|
| LG
Chem Ltd. |
46
|
|
30
|
| LG
Innotek Co., Ltd. |
49
|
|
8
|
| LOTTE
Fine Chemical Co., Ltd. |
125
|
|
10
|
| LX
Semicon Co., Ltd. |
46
|
|
4
|
| NCSoft
Corp. |
17
|
|
9
|
| POSCO
|
36
|
|
10
|
See Notes to Financial Statements
AllianzGI Global Dynamic
Allocation Fund
SCHEDULE OF INVESTMENTS (Continued)
September 30, 2021
($ reported in
thousands)
| |
Shares
|
|
Value
|
| |
|
|
|
| South
Korea—continued |
|
|
| Posco
International Corp. |
336
|
|
$ 7
|
| Samsung
Electronics Co., Ltd. |
164
|
|
10
|
| Samsung
Electronics Co., Ltd. Registered Shares GDR |
20
|
|
31
|
| Shinhan
Financial Group Co., Ltd. |
305
|
|
10
|
| Shinsegae,
Inc. |
550
|
|
121
|
| SK
Hynix, Inc. |
134
|
|
11
|
| SK
Telecom Co., Ltd.(6) |
37
|
|
10
|
| Woori
Financial Group, Inc. |
682
|
|
7
|
| |
|
|
494
|
| |
|
|
|
| |
| Spain—0.4%
|
|
|
| Aena
SME S.A.(6) |
210
|
|
36
|
| Banco
Santander S.A. |
6,155
|
|
22
|
| Ebro
Foods S.A. |
113
|
|
2
|
| Ferrovial
S.A. |
1,300
|
|
38
|
| Iberdrola
S.A. |
2,843
|
|
29
|
| International
Consolidated Airlines Group S.A.(6) |
1,561
|
|
4
|
| International
Consolidated Airlines Group S.A.(6) |
11,290
|
|
27
|
| Lar
Espana Real Estate Socimi S.A(6) |
137
|
|
1
|
| Mapfre
S.A. |
6,522
|
|
14
|
| Mediaset
Espana Comunicacion S.A.(6) |
1,102
|
|
6
|
| Neinor
Homes S.A.(6) |
509
|
|
7
|
| Repsol
S.A. |
1,129
|
|
15
|
| Telefonica
S.A. |
4,480
|
|
21
|
| |
|
|
222
|
| |
|
|
|
| |
| Sweden—0.5%
|
|
|
| Annehem
Fastigheter AB Class B(6) |
42
|
|
—
(8) |
| Arjo
AB Class B |
684
|
|
8
|
| Assa
Abloy AB Class B |
3,012
|
|
87
|
| Atlas
Copco AB Class A |
1,053
|
|
63
|
| Essity
AB Class B |
374
|
|
12
|
| Getinge
AB Class B |
149
|
|
6
|
| Hexagon
AB Class B |
4,196
|
|
65
|
| Peab
AB Class B |
211
|
|
2
|
| Saab
AB Class B |
1,190
|
|
34
|
| Telefonaktiebolaget
LM Ericsson Class B |
955
|
|
11
|
| Volvo
AB Class B |
531
|
|
12
|
| |
|
|
300
|
| |
|
|
|
| |
| Switzerland—1.4%
|
|
|
| ALSO
Holding AG Registered Shares(6) |
10
|
|
3
|
| BKW
AG |
16
|
|
2
|
| Chubb
Ltd. |
133
|
|
23
|
| |
Shares
|
|
Value
|
| |
|
|
|
| Switzerland—continued
|
|
|
| Cie
Financiere Richemont S.A. |
117
|
|
$ 12
|
| Givaudan
S.A. Registered Shares |
3
|
|
14
|
| Holcim
Ltd.(6) |
171
|
|
8
|
| Intershop
Holding AG |
4
|
|
2
|
| Kuehne
+ Nagel International AG |
39
|
|
13
|
| Logitech
International S.A. |
102
|
|
9
|
| Lonza
Group AG Registered Shares |
157
|
|
118
|
| Nestle
S.A. Registered Shares |
486
|
|
58
|
| Novartis
AG Registered Shares |
590
|
|
48
|
| Partners
Group Holding AG |
59
|
|
92
|
| PSP
Swiss Property AG Registered Shares |
32
|
|
4
|
| Roche
Holding AG |
170
|
|
62
|
| Sika
AG Registered Shares |
489
|
|
155
|
| Swiss
Life Holding AG Registered Shares |
18
|
|
9
|
| Swiss
Prime Site AG Registered Shares |
78
|
|
8
|
| Swisscom
AG Registered Shares |
26
|
|
15
|
| Tecan
Group AG |
11
|
|
6
|
| UBS
Group AG Registered Shares |
918
|
|
15
|
| VAT
Group AG |
262
|
|
103
|
| Zurich
Insurance Group AG |
75
|
|
31
|
| |
|
|
810
|
| |
|
|
|
| |
| Taiwan—1.0%
|
|
|
| Acer,
Inc. |
7,000
|
|
6
|
| ASE
Technology Holding Co., Ltd. |
4,000
|
|
16
|
| Asia
Cement Corp. |
8,000
|
|
13
|
| Asustek
Computer, Inc. |
2,000
|
|
23
|
| AU
Optronics Corp. |
8,000
|
|
5
|
| Cathay
Financial Holding Co., Ltd. |
13,000
|
|
27
|
| China
Development Financial Holding Corp. |
13,000
|
|
7
|
| China
Motor Corp. |
2,000
|
|
5
|
| Compal
Electronics, Inc. |
13,000
|
|
11
|
| CTBC
Financial Holding Co., Ltd. |
10,000
|
|
8
|
| E.Sun
Financial Holding Co., Ltd. |
3,213
|
|
3
|
| Elan
Microelectronics Corp. |
1,000
|
|
5
|
| Evergreen
Marine Corp. Taiwan Ltd. |
2,000
|
|
9
|
| |
Shares
|
|
Value
|
| |
|
|
|
| Taiwan—continued
|
|
|
| Everlight
Electronics Co., Ltd. |
4,000
|
|
$ 7
|
| Far
EasTone Telecommunications Co., Ltd. |
3,000
|
|
7
|
| Fubon
Financial Holding Co., Ltd. |
14,300
|
|
39
|
| Getac
Technology Corp. |
3,000
|
|
6
|
| Global
Mixed Mode Technology, Inc. |
2,000
|
|
16
|
| Great
Wall Enterprise Co., Ltd. |
3,553
|
|
7
|
| Hon
Hai Precision Industry Co., Ltd. |
4,200
|
|
16
|
| Hua
Nan Financial Holdings Co., Ltd. |
10,215
|
|
7
|
| Lien
Hwa Industrial Holdings Corp. |
6,721
|
|
14
|
| Mega
Financial Holding Co., Ltd. |
7,000
|
|
8
|
| Pegatron
Corp. |
4,000
|
|
10
|
| Powertech
Technology, Inc. |
4,000
|
|
15
|
| Qisda
Corp. |
6,000
|
|
6
|
| Realtek
Semiconductor Corp. |
1,500
|
|
26
|
| Silicon
Motion Technology Corp. ADR |
158
|
|
11
|
| Sinbon
Electronics Co., Ltd. |
2,000
|
|
17
|
| Taiwan
Fertilizer Co., Ltd. |
1,000
|
|
2
|
| Taiwan
PCB Techvest Co., Ltd. |
2,000
|
|
3
|
| Taiwan
Semiconductor Manufacturing Co., Ltd. |
4,000
|
|
83
|
| Tripod
Technology Corp. |
2,000
|
|
8
|
| Uni-President
Enterprises Corp. |
3,000
|
|
7
|
| United
Microelectronics Corp. |
5,000
|
|
11
|
| United
Microelectronics Corp. Sponsored ADR |
1,557
|
|
18
|
| United
Renewable Energy Co., Ltd.(6) |
1,889
|
|
1
|
| Wisdom
Marine Lines Co., Ltd. |
2,118
|
|
6
|
| Wistron
Corp. |
7,000
|
|
7
|
| WT
Microelectronics Co., Ltd. |
1,707
|
|
4
|
| Yuanta
Financial Holding Co., Ltd. |
43,400
|
|
38
|
| |
|
|
538
|
| |
|
|
|
| |
| Thailand—0.3%
|
|
|
| Bangchak
Corp. PCL Foreign Shares |
3,000
|
|
3
|
| BTS
Group Holdings PCL Foreign Shares |
205,600
|
|
57
|
See Notes to Financial Statements
AllianzGI Global Dynamic
Allocation Fund
SCHEDULE OF INVESTMENTS (Continued)
September 30, 2021
($ reported in
thousands)
| |
Shares
|
|
Value
|
| |
|
|
|
| Thailand—continued
|
|
|
| Central
Pattana PCL Foreign Shares |
36,200
|
|
$ 56
|
| Minor
International PCL Foreign Shares(6) |
70,000
|
|
65
|
| Thanachart
Capital PCL Foreign Shares |
4,000
|
|
4
|
| |
|
|
185
|
| |
|
|
|
| |
| Turkey—0.0%
|
|
|
| Dogus
Otomotiv Servis ve Ticaret AS |
909
|
|
3
|
| Turkcell
Iletisim Hizmetleri AS |
2,677
|
|
5
|
| Turkiye
Garanti Bankasi AS |
5,914
|
|
6
|
| Turkiye
Petrol Rafinerileri AS(6) |
58
|
|
1
|
| |
|
|
15
|
| |
|
|
|
| |
| United
Kingdom—1.1% |
|
|
| 3i
Group plc |
452
|
|
8
|
| Airtel
Africa plc |
6,769
|
|
9
|
| Anglo
American plc |
857
|
|
30
|
| Aviva
plc |
1,920
|
|
10
|
| Barclays
plc |
5,141
|
|
13
|
| BHP
Group plc |
569
|
|
14
|
| BP
plc |
4,052
|
|
18
|
| British
Land Co. plc (The) |
3,890
|
|
26
|
| BT
Group plc(6) |
4,057
|
|
9
|
| Burberry
Group plc |
1,058
|
|
26
|
| Compass
Group plc(6) |
1,379
|
|
28
|
| Computacenter
plc |
119
|
|
4
|
| Diageo
plc |
71
|
|
3
|
| Diversified
Energy Co. plc |
3,992
|
|
6
|
| easyJet
plc(6) |
2,950
|
|
26
|
| Endeavour
Mining plc |
198
|
|
4
|
| Firstgroup
plc(6) |
22,510
|
|
27
|
| Gamma
Communications plc |
200
|
|
5
|
| Halfords
Group plc |
1,115
|
|
5
|
| Hikma
Pharmaceuticals plc |
277
|
|
9
|
| HSBC
Holdings plc |
4,005
|
|
21
|
| IHS
Markit Ltd. |
190
|
|
22
|
| Indivior
plc(6) |
2,260
|
|
7
|
| Intertek
Group plc |
126
|
|
8
|
| J
Sainsbury plc |
4,273
|
|
16
|
| JD
Sports Fashion plc |
595
|
|
8
|
| Keller
Group plc |
654
|
|
8
|
| Kingfisher
plc |
2,122
|
|
10
|
| Legal
& General Group plc |
785
|
|
3
|
| Linde
plc |
155
|
|
46
|
| M&G
plc |
2,329
|
|
6
|
| Melrose
Industries plc |
1,258
|
|
3
|
| Micro
Focus International plc |
820
|
|
5
|
| |
Shares
|
|
Value
|
| |
|
|
|
| United
Kingdom—continued |
|
|
| Ortho
Clinical Diagnostics Holdings plc(6) |
265
|
|
$ 5
|
| Persimmon
plc |
200
|
|
7
|
| Premier
Foods plc |
2,759
|
|
4
|
| Reach
plc |
1,492
|
|
7
|
| Rio
Tinto plc |
447
|
|
29
|
| Rolls-Royce
Holdings plc(6) |
14,200
|
|
27
|
| Royal
Dutch Shell plc Class A |
841
|
|
19
|
| Royal
Dutch Shell plc Class B |
658
|
|
15
|
| SSE
plc |
183
|
|
4
|
| SSP
Group plc(6) |
7,470
|
|
28
|
| Virgin
Money UK plc(6) |
1,098
|
|
3
|
| Vodafone
Group plc |
7,110
|
|
11
|
| Whitbread
plc(6) |
580
|
|
26
|
| |
|
|
628
|
| |
|
|
|
| |
| United
States—25.1% |
|
|
| 3M
Co. |
93
|
|
16
|
| Abbott
Laboratories |
502
|
|
59
|
| AbbVie,
Inc. |
269
|
|
29
|
| ABM
Industries, Inc. |
165
|
|
7
|
| Academy
Sports & Outdoors, Inc.(6) |
193
|
|
8
|
| Accenture
plc Class A |
163
|
|
52
|
| ACCO
Brands Corp. |
673
|
|
6
|
| Activision
Blizzard, Inc. |
989
|
|
77
|
| Adobe,
Inc.(6) |
697
|
|
401
|
| Aflac,
Inc. |
394
|
|
21
|
| AGCO
Corp. |
40
|
|
5
|
| Agilent
Technologies, Inc. |
208
|
|
33
|
| AGNC
Investment Corp. |
1,492
|
|
24
|
| Air
Lease Corp. Class A |
121
|
|
5
|
| Air
Products & Chemicals, Inc. |
155
|
|
40
|
| Akamai
Technologies, Inc.(6) |
83
|
|
9
|
| Albertsons
Cos., Inc. Class A |
278
|
|
9
|
| Align
Technology, Inc.(6) |
133
|
|
89
|
| Allstate
Corp. (The) |
158
|
|
20
|
| Ally
Financial, Inc. |
225
|
|
11
|
| Alphabet,
Inc. Class A(6) |
106
|
|
283
|
| Alphabet,
Inc. Class C(6) |
46
|
|
123
|
| Amazon.com,
Inc.(6) |
156
|
|
512
|
| Amdocs
Ltd. |
81
|
|
6
|
| AMERCO
|
13
|
|
8
|
| American
Airlines Group, Inc.(6) |
3,870
|
|
79
|
| American
Electric Power Co., Inc. |
192
|
|
16
|
| American
Equity Investment Life Holding Co. |
198
|
|
6
|
| American
Express Co. |
500
|
|
84
|
| American
Financial Group, Inc. |
92
|
|
12
|
| |
Shares
|
|
Value
|
| |
|
|
|
| United
States—continued |
|
|
| American
Tower Corp. |
550
|
|
$ 146
|
| American
Water Works Co., Inc. |
122
|
|
21
|
| Ameriprise
Financial, Inc. |
40
|
|
11
|
| AMETEK,
Inc. |
45
|
|
6
|
| Amgen,
Inc. |
130
|
|
28
|
| Amphenol
Corp. Class A |
251
|
|
18
|
| Analog
Devices, Inc. |
77
|
|
13
|
| Anthem,
Inc. |
77
|
|
29
|
| Apple,
Inc. |
2,150
|
|
304
|
| Applied
Materials, Inc. |
831
|
|
107
|
| ArcBest
Corp. |
64
|
|
5
|
| Arrow
Electronics, Inc.(6) |
81
|
|
9
|
| AT&T,
Inc. |
1,716
|
|
46
|
| Atmos
Energy Corp. |
22
|
|
2
|
| Automatic
Data Processing, Inc. |
171
|
|
34
|
| AutoZone,
Inc.(6) |
13
|
|
22
|
| Baker
Hughes Co. |
840
|
|
21
|
| Bank
of America Corp. |
3,534
|
|
150
|
| Baxter
International, Inc. |
46
|
|
4
|
| Beazer
Homes USA, Inc.(6) |
257
|
|
4
|
| Berkley
(W.R.) Corp. |
83
|
|
6
|
| Berkshire
Hathaway, Inc. Class B(6) |
66
|
|
18
|
| Biogen,
Inc.(6) |
44
|
|
12
|
| Bio-Rad
Laboratories, Inc. Class A(6) |
16
|
|
12
|
| BlackRock,
Inc. |
25
|
|
21
|
| Boeing
Co. (The)(6) |
432
|
|
95
|
| Booz
Allen Hamilton Holding Corp. Class A |
140
|
|
11
|
| Bristol-Myers
Squibb Co. |
528
|
|
31
|
| Broadcom,
Inc. |
69
|
|
33
|
| Broadstone
Net Lease, Inc. |
232
|
|
6
|
| Camping
World Holdings, Inc. Class A |
112
|
|
4
|
| Carlyle
Group, Inc. (The) |
154
|
|
7
|
| Carrier
Global Corp. |
256
|
|
13
|
| Casey’s
General Stores, Inc. |
20
|
|
4
|
| Catalent,
Inc.(6) |
686
|
|
91
|
| Caterpillar,
Inc. |
103
|
|
20
|
| CBTX,
Inc. |
78
|
|
2
|
| Centene
Corp.(6) |
261
|
|
16
|
| Central
Garden & Pet Co. Class A(6) |
80
|
|
3
|
| Century
Communities, Inc. |
62
|
|
4
|
| Charles
Schwab Corp. (The) |
134
|
|
10
|
| Chemed
Corp. |
12
|
|
6
|
| Chevron
Corp. |
303
|
|
31
|
| Chipotle
Mexican Grill, Inc. Class A(6) |
2
|
|
4
|
| Church
& Dwight Co., Inc. |
113
|
|
9
|
| Cigna
Corp. |
76
|
|
15
|
| Cincinnati
Financial Corp. |
63
|
|
7
|
See Notes to Financial Statements
AllianzGI Global Dynamic
Allocation Fund
SCHEDULE OF INVESTMENTS (Continued)
September 30, 2021
($ reported in
thousands)
| |
Shares
|
|
Value
|
| |
|
|
|
| United
States—continued |
|
|
| Cinemark
Holdings, Inc.(6) |
4,450
|
|
$ 85
|
| Cisco
Systems, Inc. |
781
|
|
43
|
| Citigroup,
Inc. |
281
|
|
20
|
| Citizens
Financial Group, Inc. |
285
|
|
13
|
| Citrix
Systems, Inc. |
119
|
|
13
|
| Clorox
Co. (The) |
107
|
|
18
|
| CMS
Energy Corp. |
104
|
|
6
|
| CNA
Financial Corp. |
126
|
|
5
|
| Coca-Cola
Co. (The) |
772
|
|
41
|
| Colgate-Palmolive
Co. |
356
|
|
27
|
| Comcast
Corp. Class A |
258
|
|
14
|
| Computer
Programs & Systems, Inc.(6) |
208
|
|
7
|
| Conagra
Brands, Inc. |
258
|
|
9
|
| Conduent,
Inc.(6) |
771
|
|
5
|
| ConocoPhillips
|
258
|
|
17
|
| Consolidated
Edison, Inc. |
265
|
|
19
|
| Cooper
Cos., Inc. (The) |
368
|
|
152
|
| Corning,
Inc. |
432
|
|
16
|
| Costco
Wholesale Corp. |
122
|
|
55
|
| Crown
Castle International Corp. |
759
|
|
132
|
| CSX
Corp. |
452
|
|
13
|
| Cummins,
Inc. |
59
|
|
13
|
| CVS
Health Corp. |
572
|
|
49
|
| Danaher
Corp. |
226
|
|
69
|
| Dave
& Buster’s Entertainment, Inc.(6) |
2,220
|
|
85
|
| Deere
& Co. |
119
|
|
40
|
| Dell
Technologies, Inc. Class C(6) |
108
|
|
11
|
| Delta
Air Lines, Inc.(6) |
215
|
|
9
|
| DENTSPLY
SIRONA, Inc. |
158
|
|
9
|
| Dexcom,
Inc.(6) |
20
|
|
11
|
| Digital
Realty Trust, Inc. |
900
|
|
130
|
| Dollar
General Corp. |
134
|
|
28
|
| Domino’s
Pizza, Inc. |
18
|
|
9
|
| Dover
Corp. |
115
|
|
18
|
| Dow,
Inc. |
164
|
|
9
|
| DR
Horton, Inc. |
135
|
|
11
|
| Duke
Energy Corp. |
166
|
|
16
|
| Duke
Realty Corp. |
2,959
|
|
142
|
| eBay,
Inc. |
222
|
|
15
|
| Echo
Global Logistics, Inc.(6) |
134
|
|
6
|
| Edwards
Lifesciences Corp.(6) |
1,334
|
|
151
|
| Electronic
Arts, Inc. |
55
|
|
8
|
| Eli
Lilly & Co. |
300
|
|
69
|
| Ellington
Financial, Inc. |
34
|
|
1
|
| Emergent
BioSolutions, Inc.(6) |
181
|
|
9
|
| Emerson
Electric Co. |
223
|
|
21
|
| Encompass
Health Corp. |
132
|
|
10
|
| Ennis,
Inc. |
113
|
|
2
|
| Entergy
Corp. |
18
|
|
2
|
| EOG
Resources, Inc. |
68
|
|
5
|
| Equinix,
Inc. |
160
|
|
126
|
| Equity
Commonwealth(6) |
113
|
|
3
|
| |
Shares
|
|
Value
|
| |
|
|
|
| United
States—continued |
|
|
| Estee
Lauder Cos., Inc. (The) Class A |
569
|
|
$ 171
|
| Exelon
Corp. |
353
|
|
17
|
| Expeditors
International of Washington, Inc. |
70
|
|
8
|
| Extra
Space Storage, Inc. |
919
|
|
154
|
| Exxon
Mobil Corp. |
665
|
|
39
|
| Facebook,
Inc. Class A(6) |
646
|
|
219
|
| FedEx
Corp. |
51
|
|
11
|
| Fidelity
National Information Services, Inc. |
46
|
|
6
|
| First
NBC Bank Holding Co.(7) |
1,041
|
|
—
|
| Fiserv,
Inc.(6) |
36
|
|
4
|
| Franklin
Electric Co., Inc. |
48
|
|
4
|
| Freeport-McMoRan,
Inc. |
955
|
|
31
|
| Genco
Shipping & Trading Ltd. |
394
|
|
8
|
| Generac
Holdings, Inc.(6) |
44
|
|
18
|
| General
Electric Co. |
241
|
|
25
|
| General
Mills, Inc. |
72
|
|
4
|
| General
Motors Co.(6) |
427
|
|
23
|
| Gilead
Sciences, Inc. |
466
|
|
33
|
| Graham
Holdings Co. Class B |
9
|
|
5
|
| Gray
Television, Inc. |
233
|
|
5
|
| Green
Brick Partners, Inc.(6) |
169
|
|
3
|
| Griffon
Corp. |
219
|
|
5
|
| HarborOne
Bancorp, Inc. |
288
|
|
4
|
| Hartford
Financial Services Group, Inc. (The) |
292
|
|
21
|
| Hawaiian
Electric Industries, Inc. |
134
|
|
5
|
| Heidrick
& Struggles International, Inc. |
216
|
|
10
|
| Hershey
Co. (The) |
74
|
|
13
|
| Hewlett
Packard Enterprise Co. |
1,081
|
|
15
|
| Hologic,
Inc.(6) |
183
|
|
14
|
| Home
Depot, Inc. (The) |
71
|
|
23
|
| Honeywell
International, Inc. |
154
|
|
33
|
| Hormel
Foods Corp. |
89
|
|
4
|
| Host
Hotels & Resorts, Inc.(6) |
4,890
|
|
80
|
| HP,
Inc. |
552
|
|
15
|
| Humana,
Inc. |
55
|
|
21
|
| IDEX
Corp. |
44
|
|
9
|
| IDEXX
Laboratories, Inc.(6) |
28
|
|
17
|
| IES
Holdings, Inc.(6) |
89
|
|
4
|
| Illinois
Tool Works, Inc. |
130
|
|
27
|
| Insight
Enterprises, Inc.(6) |
12
|
|
1
|
| Intel
Corp. |
553
|
|
29
|
| International
Business Machines Corp. |
63
|
|
9
|
| International
Paper Co. |
178
|
|
10
|
| Intuit,
Inc. |
342
|
|
185
|
| |
Shares
|
|
Value
|
| |
|
|
|
| United
States—continued |
|
|
| Intuitive
Surgical, Inc.(6) |
164
|
|
$ 163
|
| J.M.
Smucker Co. (The) |
98
|
|
12
|
| J2
Global, Inc.(6) |
40
|
|
5
|
| Jack
in the Box, Inc. |
78
|
|
8
|
| Johnson
& Johnson |
567
|
|
92
|
| JPMorgan
Chase & Co. |
977
|
|
160
|
| Kearny
Financial Corp. |
346
|
|
4
|
| Kellogg
Co. |
34
|
|
2
|
| Keysight
Technologies, Inc.(6) |
115
|
|
19
|
| Kimberly-Clark
Corp. |
101
|
|
13
|
| Kinder
Morgan, Inc. |
492
|
|
8
|
| KLA
Corp. |
42
|
|
14
|
| Knight-Swift
Transportation Holdings, Inc. Class A |
207
|
|
11
|
| Kraft
Heinz Co. (The) |
239
|
|
9
|
| Kroger
Co. (The) |
464
|
|
19
|
| Laboratory
Corp. of America Holdings(6) |
46
|
|
13
|
| Lam
Research Corp. |
34
|
|
19
|
| Las
Vegas Sands Corp.(6) |
1,800
|
|
66
|
| Leidos
Holdings, Inc. |
59
|
|
6
|
| Lennar
Corp. Class A |
126
|
|
12
|
| Lennox
International, Inc. |
247
|
|
73
|
| Live
Nation Entertainment, Inc.(6) |
910
|
|
83
|
| Lockheed
Martin Corp. |
31
|
|
11
|
| Lowe’s
Cos., Inc. |
143
|
|
29
|
| Lumen
Technologies, Inc. |
1,090
|
|
14
|
| Marathon
Petroleum Corp. |
80
|
|
5
|
| MarketAxess
Holdings, Inc. |
147
|
|
62
|
| Marsh
& McLennan Cos., Inc. |
31
|
|
5
|
| Marten
Transport Ltd. |
495
|
|
8
|
| Mastercard,
Inc. Class A |
155
|
|
54
|
| Matson,
Inc. |
82
|
|
7
|
| Matthews
International Corp. Class A |
148
|
|
5
|
| McDonald’s
Corp. |
307
|
|
74
|
| Medtronic
plc |
226
|
|
28
|
| Merck
& Co., Inc. |
707
|
|
53
|
| Methode
Electronics, Inc. |
223
|
|
9
|
| MetLife,
Inc. |
348
|
|
21
|
| Mettler-Toledo
International, Inc.(6) |
10
|
|
14
|
| Micron
Technology, Inc. |
210
|
|
15
|
| Microsoft
Corp. |
2,416
|
|
681
|
| Moderna,
Inc.(6) |
87
|
|
33
|
| Molson
Coors Beverage Co. Class B |
294
|
|
14
|
| Mondelez
International, Inc. Class A |
342
|
|
20
|
| Monster
Beverage Corp.(6) |
99
|
|
9
|
| Moody’s
Corp. |
26
|
|
9
|
| Morgan
Stanley |
300
|
|
29
|
See Notes to Financial Statements
AllianzGI Global Dynamic
Allocation Fund
SCHEDULE OF INVESTMENTS (Continued)
September 30, 2021
($ reported in
thousands)
| |
Shares
|
|
Value
|
| |
|
|
|
| United
States—continued |
|
|
| Mosaic
Co. (The) |
591
|
|
$ 21
|
| Motorola
Solutions, Inc. |
63
|
|
15
|
| MSCI,
Inc. Class A |
444
|
|
270
|
| MYR
Group, Inc.(6) |
82
|
|
8
|
| Nasdaq,
Inc. |
24
|
|
5
|
| NetApp,
Inc. |
219
|
|
20
|
| Netflix,
Inc.(6) |
31
|
|
19
|
| Newmont
Corp. |
2,068
|
|
112
|
| NextEra
Energy, Inc. |
513
|
|
40
|
| NIKE,
Inc. Class B |
1,107
|
|
161
|
| Norfolk
Southern Corp. |
88
|
|
21
|
| Northrop
Grumman Corp. |
6
|
|
2
|
| NortonLifeLock,
Inc. |
286
|
|
7
|
| Nucor
Corp. |
102
|
|
10
|
| NVIDIA
Corp. |
393
|
|
81
|
| Old
Republic International Corp. |
218
|
|
5
|
| OneMain
Holdings, Inc. |
213
|
|
12
|
| Oracle
Corp. |
397
|
|
35
|
| O’Reilly
Automotive, Inc.(6) |
51
|
|
31
|
| Organon
& Co. |
92
|
|
3
|
| Otis
Worldwide Corp. |
263
|
|
22
|
| Owens
& Minor, Inc. |
124
|
|
4
|
| Owens
Corning |
94
|
|
8
|
| Park
Hotels & Resorts, Inc.(6) |
4,040
|
|
77
|
| Paychex,
Inc. |
79
|
|
9
|
| PayPal
Holdings, Inc.(6) |
1,130
|
|
294
|
| PepsiCo,
Inc. |
234
|
|
35
|
| Pfizer,
Inc. |
1,267
|
|
54
|
| Plug
Power, Inc.(6) |
600
|
|
15
|
| Pool
Corp. |
315
|
|
137
|
| Popular,
Inc. |
214
|
|
17
|
| Procter
& Gamble Co. (The) |
551
|
|
77
|
| Progressive
Corp. (The) |
158
|
|
14
|
| Prologis,
Inc. |
1,124
|
|
141
|
| Prudential
Financial, Inc. |
190
|
|
20
|
| Public
Storage |
495
|
|
147
|
| PulteGroup,
Inc. |
206
|
|
9
|
| QCR
Holdings, Inc. |
33
|
|
2
|
| Qorvo,
Inc.(6) |
72
|
|
12
|
| QUALCOMM,
Inc. |
295
|
|
38
|
| Quanta
Services, Inc. |
67
|
|
8
|
| Quest
Diagnostics, Inc. |
69
|
|
10
|
| Ralph
Lauren Corp. |
680
|
|
76
|
| Ready
Capital Corp. |
141
|
|
2
|
| Regeneron
Pharmaceuticals, Inc.(6) |
59
|
|
36
|
| Reinsurance
Group of America, Inc. |
96
|
|
11
|
| Rent-A-Center,
Inc. |
73
|
|
4
|
| Republic
Services, Inc. Class A |
216
|
|
26
|
| Roku,
Inc. Class A (6) |
38
|
|
12
|
| Roper
Technologies, Inc. |
203
|
|
91
|
| Ross
Stores, Inc. |
850
|
|
93
|
| |
Shares
|
|
Value
|
| |
|
|
|
| United
States—continued |
|
|
| Royal
Caribbean Cruises Ltd.(6) |
1,051
|
|
$ 93
|
| S&P
Global, Inc. |
822
|
|
349
|
| SBA
Communications, Corp. Class A |
400
|
|
132
|
| Schlumberger
N.V. |
800
|
|
24
|
| Schneider
National, Inc. Class B |
175
|
|
4
|
| Schweitzer-Mauduit
International, Inc. |
135
|
|
5
|
| Sempra
Energy |
97
|
|
12
|
| Service
Properties Trust |
7,360
|
|
83
|
| ServiceNow,
Inc.(6) |
51
|
|
32
|
| Sherwin-Williams
Co. (The) |
291
|
|
81
|
| Shoals
Technologies Group, Inc. Class A(6) |
670
|
|
19
|
| Six
Flags Entertainment Corp.(6) |
1,880
|
|
80
|
| Snap-on,
Inc. |
64
|
|
13
|
| Southern
Co. (The) |
147
|
|
9
|
| Southwest
Airlines Co.(6) |
1,540
|
|
79
|
| SP
Plus Corp.(6) |
82
|
|
3
|
| Square,
Inc. Class A(6) |
696
|
|
167
|
| Star
Group LP |
721
|
|
7
|
| Starbucks
Corp. |
313
|
|
35
|
| Steel
Dynamics, Inc. |
358
|
|
21
|
| Stewart
Information Services Corp. |
91
|
|
6
|
| STORE
Capital Corp. |
64
|
|
2
|
| Sunnova
Energy International, Inc.(6) |
620
|
|
20
|
| Sunrun,
Inc.(6) |
500
|
|
22
|
| Synchrony
Financial |
364
|
|
18
|
| Synopsys,
Inc.(6) |
81
|
|
24
|
| Take-Two
Interactive Software, Inc.(6) |
32
|
|
5
|
| Target
Corp. |
227
|
|
52
|
| TEGNA,
Inc. |
453
|
|
9
|
| Telephone
& Data Systems, Inc. |
257
|
|
5
|
| Teradyne,
Inc. |
141
|
|
15
|
| Tesla,
Inc.(6) |
32
|
|
25
|
| Texas
Instruments, Inc. |
188
|
|
36
|
| Thermo
Fisher Scientific, Inc. |
97
|
|
55
|
| T-Mobile
US, Inc.(6) |
54
|
|
7
|
| Tyler
Technologies, Inc.(6) |
279
|
|
128
|
| Tyson
Foods, Inc. Class A |
164
|
|
13
|
| U.S.
Bancorp |
454
|
|
27
|
| United
Airlines Holdings, Inc.(6) |
1,710
|
|
81
|
| United
Therapeutics Corp.(6) |
42
|
|
8
|
| UnitedHealth
Group, Inc. |
325
|
|
127
|
| Unum
Group |
214
|
|
5
|
| Valero
Energy Corp. |
310
|
|
22
|
| Valley
National Bancorp |
151
|
|
2
|
| Valmont
Industries, Inc. |
16
|
|
4
|
| |
Shares
|
|
Value
|
| |
|
|
|
| United
States—continued |
|
|
| Veeva
Systems, Inc. Class A(6) |
96
|
|
$
28 |
| VEREIT,
Inc. |
110
|
|
5
|
| Verizon
Communications, Inc. |
1,784
|
|
96
|
| Vertex
Pharmaceuticals, Inc.(6) |
187
|
|
34
|
| Viatris,
Inc. |
797
|
|
11
|
| Visa,
Inc. Class A |
1,627
|
|
362
|
| Walgreens
Boots Alliance, Inc. |
416
|
|
20
|
| Walmart,
Inc. |
459
|
|
64
|
| Walt
Disney Co. (The)(6) |
933
|
|
158
|
| Waste
Management, Inc. |
370
|
|
55
|
| Waterstone
Financial, Inc. |
139
|
|
3
|
| WEC
Energy Group, Inc. |
280
|
|
25
|
| West
Pharmaceutical Services, Inc. |
79
|
|
34
|
| Westrock
Co. |
351
|
|
17
|
| Whirlpool
Corp. |
48
|
|
10
|
| Williams
Cos., Inc. (The) |
280
|
|
7
|
| Xcel
Energy, Inc. |
70
|
|
4
|
| Xerox
Holdings Corp. |
536
|
|
11
|
| Yum!
Brands, Inc. |
94
|
|
11
|
| Zebra
Technologies Corp. Class A(6) |
20
|
|
10
|
| Zions
Bancorp NA |
1,370
|
|
85
|
| Zoetis,
Inc. Class A |
840
|
|
163
|
| Zoom
Video Communications, Inc. Class A(6) |
72
|
|
19
|
| |
|
|
14,257
|
| |
|
|
|
| |
Total
Common Stocks
(Identified Cost $23,840) |
|
28,573
|
| |
|
|
|
| |
| |
|
|
|
| |
| Rights—0.0%
|
| Taiwan—0.0%
|
|
|
| Fubon
Financial Holding Co., Ltd.(6) |
495
|
|
—
(8) |
| Fubon
Financial Holding Co., Ltd. Preference Shares (6) |
301
|
|
—
|
| |
|
|
—
|
| |
|
|
|
| |
Total
Rights
(Identified Cost $—) |
|
—
|
| |
|
|
|
| |
| |
|
|
|
| |
| Warrants—0.0%
|
| Bermuda—0.0%
|
|
|
| Valaris
Ltd.(6) |
5
|
|
—
(8) |
| Canada—0.0%
|
|
|
| Cenovus
Energy, Inc.(6) |
65
|
|
1
|
See Notes to Financial Statements
AllianzGI Global Dynamic
Allocation Fund
SCHEDULE OF INVESTMENTS (Continued)
September 30, 2021
($ reported in
thousands)
| |
Shares
|
|
Value
|
| |
|
|
|
| Thailand—0.0%
|
|
|
| Minor
International PCL(6) |
1,503
|
|
$
—(8) |
| Minor
International PCL(6) |
1,362
|
|
—
(8) |
| BTS
Group Holdings PCL(6) |
20,000
|
|
—
|
| BTS
Group Holdings PCL(6) |
40,000
|
|
—
|
| BTS
Group Holdings PCL(6) |
80,000
|
|
—
|
| |
|
|
—
|
| |
|
|
|
| |
Total
Warrants
(Identified Cost $—) |
|
1
|
| |
|
|
|
| |
| |
|
|
|
| |
Total
Long-Term Investments—72.9%
(Identified Cost $36,624) |
|
41,321
|
| |
|
|
|
| |
| |
|
|
|
| |
| Short-Term
Investment—23.9% |
| Money
Market Mutual Fund—23.9% |
| Dreyfus
Government Cash Management Fund - Institutional Shares (seven-day effective yield 0.030%)(9) |
13,569,177
|
|
13,569
|
Total
Short-Term Investment
(Identified Cost $13,569) |
|
13,569
|
| |
|
|
|
| |
| |
|
|
|
| |
TOTAL
INVESTMENTS—96.8%
(Identified Cost $50,193) |
|
$54,890
|
| Other
assets and liabilities, net—3.2% |
|
1,821
|
| NET
ASSETS—100.0% |
|
$56,711
|
| Abbreviations:
|
| ADR
|
American
Depositary Receipt |
| CDX.NA.HY
|
Credit
Default Swap Index North American High Yield |
| EAFE
|
Europe,
Australasia and Far East |
| GDR
|
Global
Depositary Receipt |
| GS
|
Goldman
Sachs & Co. |
| LIBOR
|
London
Interbank Offered Rate |
| LLC
|
Limited
Liability Company |
| LP
|
Limited
Partnership |
| MSCI
|
Morgan
Stanley Capital International |
| NA
|
National
Association |
| REIT
|
Real
Estate Investment Trust |
| S&P
|
Standard
& Poor’s |
| Footnote
Legend: |
|
(1) |
All
or a portion of the security is segregated as collateral for open swap contracts. |
|
(2) |
Security
exempt from registration under Rule 144A of the Securities Act of 1933. These securities may be resold in transactions exempt from registration, normally to qualified institutional buyers. At September 30, 2021, these securities amounted to a value
of $2,605 or 4.6% of net assets. |
|
(3) |
No
contractual maturity date. |
|
(4) |
Variable
rate security. Rate disclosed is as of September 30, 2021. Information in parenthesis represents benchmark and reference rate for each security. Certain variable rate securities are not based on a published reference rate and spread but are
determined by the issuer or agent and are based on current market conditions, or, for mortgage-backed securities, are impacted by the individual mortgages which are paying off over time. These securities do not indicate a reference rate and spread
in their descriptions. |
|
(5) |
Value
shown as par value. |
|
(6) |
Non-income
producing. |
| (7) |
The value of this
security was determined using significant unobservable inputs and is reported as a Level 3 security in the Fair Value Hierarchy table located after the Schedule of Investments. |
|
(8) |
Amount
is less than $500. |
|
(9) |
Shares
of this fund are publicly offered, and its prospectus and annual report are publicly available. |
| Counterparties:
|
|
| ICE
|
Intercontinental
Exchange |
| Foreign
Currencies: |
|
| EUR
|
Euro
|
| NZD
|
New
Zealand Dollar |
| USD
|
United
States Dollar |
| Country
Weightings (Unaudited)† |
| United
States |
65%
|
| New
Zealand |
6
|
| Japan
|
4
|
| China
|
3
|
| Netherlands
|
2
|
| Germany
|
2
|
| France
|
2
|
| Other
|
16
|
| Total
|
100%
|
|
† % of total investments as of September 30, 2021. |
| Exchange-Traded
Futures contracts as of September 30, 2021 were as follows: |
| Issue
|
Expiration
|
Contracts
Purchased/(Sold) |
Notional
Value |
Value
/
Unrealized
Appreciation |
|
Value
/
Unrealized
(Depreciation) |
| Long
Contracts: |
|
|
|
|
|
|
| 2
Year U.S. Treasury Note Future |
December
2021 |
16
|
$
3,521 |
$—
|
|
$
(2) |
| 10
Year Euro-Bund Future |
December
2021 |
27
|
5,311
|
—
|
|
(71)
|
| 10
Year U.K. Long Gilt Future |
December
2021 |
20
|
3,373
|
—
|
|
(38)
|
| Euro
Stoxx 50® Future |
December
2021 |
13
|
610
|
—
|
|
(20)
|
| MSCI
EAFE® Index Future |
December
2021 |
18
|
2,040
|
—
|
|
(91)
|
| Nasdaq
100 E-mini Future |
December
2021 |
10
|
2,936
|
—
|
|
(14)
|
| Nikkei
225 Stock Average Future |
December
2021 |
8
|
1,174
|
—
|
|
(35)
|
| Russell
2000 E-mini Future |
December
2021 |
12
|
1,320
|
—
|
|
(21)
|
| S&P
200® Index Future |
December
2021 |
5
|
659
|
—
|
|
(5)
|
| S&P
MidCap 400® Index E-mini Future |
December
2021 |
5
|
1,317
|
—
|
|
(32)
|
| Ultra
U.S. Treasury Bond Future |
December
2021 |
27
|
5,159
|
—
|
|
(15)
|
| |
|
|
|
$—
|
|
$(344)
|
| Short
Contracts: |
|
|
|
|
|
|
| 10
Year Australian Bond Future |
December
2021 |
(66)
|
(6,750)
|
67
|
|
—
|
For information regarding the abbreviations, see the Key Investment Terms
starting on page 6.
See Notes to Financial Statements
AllianzGI Global Dynamic
Allocation Fund
SCHEDULE OF INVESTMENTS (Continued)
September 30, 2021
($ reported in
thousands)
| Exchange-Traded
Futures contracts as of September 30, 2021 were as follows: |
| Issue
|
Expiration
|
Contracts
Purchased/(Sold) |
Notional
Value |
Value
/
Unrealized
Appreciation |
|
Value
/
Unrealized
(Depreciation) |
| 10
Year U.S. Ultra Treasury Bond Future |
December
2021 |
(2)
|
$
(291) |
$—
(1) |
|
$
— |
| |
|
|
|
67
|
|
—
|
| Total
|
|
|
|
$67
|
|
$(344)
|
| Footnote
Legend: |
|
(1)Amount is less than $500. |
|
|
|
|
|
|
| Centrally
cleared credit default swap - buy protection(1) outstanding as of September 30, 2021 were as follows: |
| Reference
Entity |
Payment
Frequency |
Counterparty
|
Fixed
Rate |
Expiration
Date |
Notional
Amount(2) |
Value
|
|
Premiums
Paid
(Received) |
|
Unrealized
Appreciation |
|
Unrealized
(Depreciation) |
| CDX.NA.HY.37
(3) |
Quarterly
|
ICE
|
5.000%
|
12/20/26
|
$(775)
|
$(71)
|
|
$
(73) |
|
$
2 |
|
$
— |
| International
Business Machines Corp. Senior |
Quarterly
|
ICE
|
1.000%
|
12/20/26
|
(245)
|
(8)
|
|
(8)
|
|
—
|
|
—
|
| Southwest
Airlines Co. Senior |
Quarterly
|
ICE
|
1.000%
|
12/20/26
|
(125)
|
—
|
|
(—)
|
|
—
|
|
—
(4) |
| Valero
Energy Corp. Senior |
Quarterly
|
ICE
|
1.000%
|
12/20/26
|
(110)
|
(1)
|
|
—
(4) |
|
—
|
|
(1)
|
| Total
|
|
|
|
|
|
|
$(80)
|
|
$
(81) |
|
$
2 |
|
$
(1) |
|
Footnote Legend: |
|
(1) |
If
the Fund is a buyer of protection and a credit event occurs, as defined under the terms of that particular swap agreement, the Fund will either: (i) receive from the seller of protection an amount equal to the notional amount of the swap and
deliver the referenced obligation or underlying investments comprising the referenced index; or (ii) receive a net settlement amount in the form of cash or investments equal to the notional amount of the swap less the recovery value of the
referenced obligation or underlying investments comprising the referenced index. |
|
(2) |
The
maximum potential amount the Fund could be required to pay as a seller of credit protection or receive as a buyer of credit protection if a credit event occurs as defined under the terms of that particular swap agreement. |
|
(3) |
Markit
CDX.NA.HY Index, is composed of 100 of the most liquid North American entities with high yield credit ratings that trade in the credit default swap market. |
|
(4) |
Amount
is less than $500. |
| Over-the-counter
volatility swaps outstanding as of September 30, 2021 were as follows: |
|
|
| Referenced
Entity |
Pay/Receive
Volatility |
Volatility
Strike |
Payment
Frequency |
Counterparty
|
Expiration
Date |
Notional
Amount |
Value
|
|
Premiums
Paid
(Received) |
|
Unrealized
Appreciation |
|
Unrealized
Depreciation |
| S&P
500® Index(1) |
Pay
|
18.15%
|
Maturity
|
UBS
Securities LLC |
10/15/21
|
$5,000
|
USD
|
$
11 |
|
$—
|
|
$11
|
|
$
— |
| S&P
500® Index(1) |
Pay
|
20.00
|
Maturity
|
UBS
Securities LLC |
10/15/21
|
5,000
|
USD
|
18
|
|
—
|
|
18
|
|
—
|
| S&P
500® Index(1) |
Pay
|
15.70
|
Maturity
|
UBS
Securities LLC |
10/15/21
|
5,000
|
USD
|
(17)
|
|
—
|
|
—
|
|
(17)
|
| S&P
500® Index(1) |
Pay
|
17.30
|
Maturity
|
Citibank
N.A. |
10/15/21
|
5,000
|
USD
|
(11)
|
|
—
|
|
—
|
|
(11)
|
| Euro
Stoxx® Index(1) |
Pay
|
20.25
|
Maturity
|
Citibank
N.A. |
10/15/21
|
5,000
|
EUR
|
(18)
|
|
—
|
|
—
|
|
(18)
|
| S&P
500® Index(1) |
Pay
|
18.90
|
Maturity
|
Citibank
N.A. |
11/19/21
|
5,000
|
USD
|
(18)
|
|
—
|
|
—
|
|
(18)
|
| S&P
500® Index(1) |
Pay
|
23.40
|
Maturity
|
Citibank
N.A. |
11/19/21
|
5,000
|
USD
|
6
|
|
—
|
|
6
|
|
—
|
| S&P
500® Index(1) |
Pay
|
20.50
|
Maturity
|
UBS
Securities LLC |
11/19/21
|
5,000
|
USD
|
(12)
|
|
—
|
|
—
|
|
(12)
|
| Total
|
|
|
|
|
|
|
|
$(41)
|
|
$—
|
|
$35
|
|
$(76)
|
| Footnote
Legend: |
|
(1) |
Variance
Swap. |
See Notes to Financial Statements
AllianzGI Global Dynamic
Allocation Fund
SCHEDULE OF INVESTMENTS (Continued)
September 30, 2021
($ reported in
thousands)
The following table summarizes the market value of the
Fund’s investments as of September 30, 2021, based on the inputs used to value them (See Security Valuation Note 2A in the Notes to Financial Statements):
| |
Total
Value at
September 30, 2021 |
|
Level
1
Quoted Prices |
|
Level
2
Significant
Observable
Inputs |
|
Level
3
Significant
Unobservable
Inputs |
| Assets:
|
|
|
|
|
|
|
|
| Debt
Securities: |
|
|
|
|
|
|
|
| Corporate
Bonds and Notes |
$
9,203 |
|
$
— |
|
$
9,203 |
|
$—
|
| Foreign
Government Securities |
3,203
|
|
—
|
|
3,203
|
|
—
|
| U.S.
Government Securities |
237
|
|
—
|
|
237
|
|
—
|
| Equity
Securities: |
|
|
|
|
|
|
|
| Common
Stocks |
28,573
|
|
16,524
|
|
12,049
|
|
—
(1) |
| Preferred
Stocks |
104
|
|
42
|
|
62
|
|
—
|
| Warrants
|
1
|
|
1
|
|
—
|
|
—
|
| Rights
|
—
(2) |
|
—
(2) |
|
—
|
|
—
|
| Money
Market Mutual Fund |
13,569
|
|
13,569
|
|
—
|
|
—
|
| Other
Financial Instruments: |
|
|
|
|
|
|
|
| Futures
Contracts |
67
|
|
67
|
|
—
|
|
—
|
| Over-the-Counter
Volatility swaps |
35
|
|
—
|
|
35
|
|
—
|
| Total
Assets |
54,992
|
|
30,203
|
|
24,789
|
|
—
(1) |
| Liabilities:
|
|
|
|
|
|
|
|
| Other
Financial Instruments: |
|
|
|
|
|
|
|
| Futures
Contracts |
(344)
|
|
(344)
|
|
—
|
|
—
|
| Over-the-Counter
Volatility swaps |
(76)
|
|
—
|
|
(76)
|
|
—
|
| Centrally
Cleared Credit Default Swap |
(80)
|
|
—
|
|
(80)
|
|
—
|
| Total
Liabilities |
(500)
|
|
(344)
|
|
(156)
|
|
—
|
| Total
Investments |
$54,492
|
|
$29,859
|
|
$24,633
|
|
$—
(1) |
| (1) |
Includes internally
fair valued securities currently priced at zero ($0). |
|
(2) |
Amount
is less than $500. |
There were
no transfers into or out of Level 3 related to securities held at September 30, 2021.
Some of the Fund’s investments that were
categorized as Level 3 were valued utilizing third party pricing information without adjustment. Such valuations are based on unobservable inputs. A significant change in third party information could result in a significantly lower or higher value
of Level 3 investments.
Management has determined
that the amount of Level 3 securities compared to total net assets is not material; therefore, the rollforward of Level 3 securities and assumptions are not shown for the period ended September 30, 2021.
See Notes to Financial Statements
AllianzGI Global
Sustainability Fund
SCHEDULE OF INVESTMENTS September 30, 2021
($ reported in thousands)
| |
Shares
|
|
Value
|
| Common
Stocks—97.4% |
| Australia—2.3%
|
|
|
| CSL
Ltd. |
13,790
|
|
$ 2,881
|
| Denmark—1.8%
|
|
|
| Novo
Nordisk A/S Class B |
23,919
|
|
2,305
|
| Finland—2.3%
|
|
|
| Stora
Enso Oyj Class R |
174,881
|
|
2,913
|
| France—2.2%
|
|
|
| Bureau
Veritas S.A. |
42,292
|
|
1,305
|
| Kering
S.A. |
2,063
|
|
1,465
|
| |
|
|
2,770
|
| |
|
|
|
| |
| Germany—5.5%
|
|
|
| adidas
AG |
8,412
|
|
2,644
|
| Muenchener
Rueckversicherungs-Gesellschaft AG in Muenchen Registered Shares |
8,386
|
|
2,288
|
| SAP
SE |
14,643
|
|
1,980
|
| |
|
|
6,912
|
| |
|
|
|
| |
| Hong
Kong—1.2% |
|
|
| AIA
Group Ltd. |
125,600
|
|
1,445
|
| Japan—5.8%
|
|
|
| Daikin
Industries Ltd. |
14,400
|
|
3,140
|
| Keyence
Corp. |
7,000
|
|
4,178
|
| |
|
|
7,318
|
| |
|
|
|
| |
| Netherlands—2.1%
|
|
|
| ASML
Holding N.V. |
3,472
|
|
2,594
|
| South
Korea—1.6% |
|
|
| Samsung
Electronics Co., Ltd. Registered Shares GDR |
1,273
|
|
1,975
|
| Spain—1.8%
|
|
|
| Industria
de Diseno Textil S.A. |
61,056
|
|
2,247
|
| Sweden—3.5%
|
|
|
| Assa
Abloy AB Class B |
64,851
|
|
1,881
|
| Atlas
Copco AB Class A |
40,954
|
|
2,473
|
| |
|
|
4,354
|
| |
|
|
|
| |
| Switzerland—6.1%
|
|
|
| Nestle
S.A. Registered Shares |
26,142
|
|
3,150
|
| |
Shares
|
|
Value
|
| |
|
|
|
| Switzerland—continued
|
|
|
| Roche
Holding AG |
7,449
|
|
$
2,718 |
| UBS
Group AG Registered Shares |
110,759
|
|
1,768
|
| |
|
|
7,636
|
| |
|
|
|
| |
| United
Kingdom—8.0% |
|
|
| AstraZeneca
plc |
21,555
|
|
2,598
|
| Prudential
plc |
94,839
|
|
1,840
|
| Royal
Dutch Shell plc Class B |
173,707
|
|
3,849
|
| Unilever
plc |
32,767
|
|
1,774
|
| |
|
|
10,061
|
| |
|
|
|
| |
| United
States—53.2% |
|
|
| AbbVie,
Inc. |
14,969
|
|
1,615
|
| Accenture
plc Class A |
10,631
|
|
3,401
|
| Adobe,
Inc.(1) |
7,044
|
|
4,055
|
| Agilent
Technologies, Inc. |
13,228
|
|
2,084
|
| Alphabet,
Inc. Class A(1) |
1,971
|
|
5,270
|
| American
Express Co. |
20,621
|
|
3,455
|
| Apple,
Inc. |
47,101
|
|
6,665
|
| Applied
Materials, Inc. |
19,189
|
|
2,470
|
| CME
Group, Inc. Class A |
8,063
|
|
1,559
|
| Eaton
Corp. plc |
15,661
|
|
2,338
|
| Estee
Lauder Cos., Inc. (The) Class A |
8,320
|
|
2,495
|
| International
Flavors & Fragrances, Inc. |
14,209
|
|
1,900
|
| Intuit,
Inc. |
9,910
|
|
5,347
|
| Jackson
Financial, Inc. Class A(1) |
2,370
|
|
62
|
| Johnson
& Johnson |
12,358
|
|
1,996
|
| Microsoft
Corp. |
15,257
|
|
4,301
|
| S&P
Global, Inc. |
9,700
|
|
4,121
|
| Starbucks
Corp. |
30,236
|
|
3,335
|
| UnitedHealth
Group, Inc. |
8,320
|
|
3,251
|
| Visa,
Inc. Class A |
21,108
|
|
4,702
|
| Xylem,
Inc. |
19,516
|
|
2,414
|
| |
|
|
66,836
|
| |
|
|
|
| |
Total
Common Stocks
(Identified Cost $85,111) |
|
122,247
|
| |
|
|
|
| |
| |
|
|
|
| |
Total
Long-Term Investments—97.4%
(Identified Cost $85,111) |
|
122,247
|
| |
|
|
|
| |
| |
|
|
|
| |
| |
Shares
|
|
Value
|
| |
|
|
|
| |
|
|
|
| Short-Term
Investment—2.6% |
| Money
Market Mutual Fund—2.6% |
| Dreyfus
Government Cash Management Fund - Institutional Shares (seven-day effective yield 0.030%)(2) |
3,234,409
|
|
$
3,234 |
Total
Short-Term Investment
(Identified Cost $3,234) |
|
3,234
|
| |
|
|
|
| |
| |
|
|
|
| |
TOTAL
INVESTMENTS—100.0%
(Identified Cost $88,345) |
|
$125,481
|
| Other
assets and liabilities, net—0.0% |
|
44
|
| NET
ASSETS—100.0% |
|
$125,525
|
| Abbreviations:
|
| GDR
|
Global
Depositary Receipt |
| S&P
|
Standard
& Poor’s |
| Footnote
Legend: |
|
(1) |
Non-income
producing. |
|
(2) |
Shares
of this fund are publicly offered, and its prospectus and annual report are publicly available. |
| Country
Weightings (Unaudited)† |
| United
States |
56%
|
| United
Kingdom |
8
|
| Switzerland
|
6
|
| Japan
|
6
|
| Germany
|
6
|
| Sweden
|
3
|
| Finland
|
2
|
| Other
|
13
|
| Total
|
100%
|
|
† % of total investments as of September 30, 2021. |
For information regarding the abbreviations, see the Key
Investment Terms starting on page 6.
See Notes to Financial Statements
AllianzGI Global
Sustainability Fund
SCHEDULE OF INVESTMENTS (Continued)
September 30, 2021
($ reported in
thousands)
The following table summarizes the market value of the
Fund’s investments as of September 30, 2021, based on the inputs used to value them (See Security Valuation Note 2A in the Notes to Financial Statements):
| |
Total
Value at
September 30, 2021 |
|
Level
1
Quoted Prices |
|
Level
2
Significant
Observable
Inputs |
| Assets:
|
|
|
|
|
|
| Equity
Securities: |
|
|
|
|
|
| Common
Stocks |
$122,247
|
|
$66,836
|
|
$55,411
|
| Money
Market Mutual Fund |
3,234
|
|
3,234
|
|
—
|
| Total
Investments |
$125,481
|
|
$70,070
|
|
$55,411
|
There were no securities
valued using significant unobservable inputs (Level 3) at September 30, 2021.
There were no transfers into or out of Level 3 related
to securities held at September 30, 2021.
See Notes to Financial Statements
AllianzGI High Yield Bond
Fund
SCHEDULE OF INVESTMENTS
September 30, 2021
($ reported in thousands)
| |
Par
Value |
|
Value
|
| Corporate
Bonds and Notes—90.3% |
| Advertising—0.8%
|
|
|
| Clear
Channel Outdoor Holdings, Inc. |
|
|
|
| 144A
7.750%, 4/15/28(1) |
$ 185
|
|
$ 195
|
| 144A
7.500%, 6/1/29(1) |
350
|
|
364
|
| |
|
|
559
|
| |
|
|
|
| |
| Aerospace
& Defense—2.2% |
|
|
| TransDigm,
Inc. |
|
|
|
| 6.375%,
6/15/26 |
650
|
|
670
|
| 5.500%,
11/15/27 |
185
|
|
190
|
| Triumph
Group, Inc. |
|
|
|
| 144A
8.875%, 6/1/24(1) |
407
|
|
448
|
| 144A
6.250%, 9/15/24(1) |
245
|
|
245
|
| |
|
|
1,553
|
| |
|
|
|
| |
| Airlines—1.6%
|
|
|
| American
Airlines, Inc. |
|
|
|
| 144A
11.750%, 7/15/25(1) |
285
|
|
353
|
| 144A
5.750%, 4/20/29(1) |
160
|
|
172
|
Delta
Air Lines, Inc.
7.375%, 1/15/26 |
500
|
|
589
|
| |
|
|
1,114
|
| |
|
|
|
| |
| Auto
Components—3.1% |
|
|
American
Axle & Manufacturing, Inc.
6.500%, 4/1/27 |
380
|
|
396
|
Clarios
Global LP 144A
8.500%, 5/15/27(1) |
500
|
|
532
|
| Goodyear
Tire & Rubber Co. (The) |
|
|
|
| 5.250%,
4/30/31 |
340
|
|
365
|
| 144A
5.250%, 7/15/31(1) |
345
|
|
367
|
| Tenneco,
Inc. |
|
|
|
| 5.000%,
7/15/26 |
335
|
|
330
|
| 144A
7.875%, 1/15/29(1) |
150
|
|
168
|
| |
|
|
2,158
|
| |
|
|
|
| |
| Auto
Manufacturers—2.2% |
|
|
| Ford
Motor Co. |
|
|
|
| 9.000%,
4/22/25 |
725
|
|
872
|
| 9.625%,
4/22/30 |
475
|
|
672
|
| |
|
|
1,544
|
| |
|
|
|
| |
| Building
Materials—2.7% |
|
|
APi
Group DE, Inc. 144A
4.125%, 7/15/29(1) |
175
|
|
172
|
Builders
FirstSource, Inc. 144A
5.000%, 3/1/30(1) |
430
|
|
458
|
Griffon
Corp.
5.750%, 3/1/28 |
320
|
|
336
|
Koppers,
Inc. 144A
6.000%, 2/15/25(1) |
360
|
|
368
|
| |
Par
Value |
|
Value
|
| |
|
|
|
| Building
Materials—continued |
|
|
Summit
Materials LLC 144A
5.250%, 1/15/29(1) |
$ 535
|
|
$ 562
|
| |
|
|
1,896
|
| |
|
|
|
| |
| Chemicals—1.0%
|
|
|
Tronox,
Inc. 144A
4.625%, 3/15/29(1) |
345
|
|
343
|
WR
Grace Holdings LLC 144A
5.625%, 8/15/29(1) |
325
|
|
335
|
| |
|
|
678
|
| |
|
|
|
| |
| Commercial
Services—3.8% |
|
|
ADT
Security Corp. (The) 144A
4.125%, 8/1/29(1) |
345
|
|
343
|
Avis
Budget Car Rental LLC 144A
5.375%, 3/1/29(1) |
485
|
|
513
|
Deluxe
Corp. 144A
8.000%, 6/1/29(1) |
480
|
|
502
|
HealthEquity,
Inc. 144A
4.500%, 10/1/29(1) |
170
|
|
172
|
Herc
Holdings, Inc. 144A
5.500%, 7/15/27(1) |
265
|
|
278
|
NESCO
Holdings II, Inc. 144A
5.500%, 4/15/29(1) |
330
|
|
342
|
RR
Donnelley & Sons Co.
7.000%, 2/15/22 |
193
|
|
196
|
United
Rentals North America, Inc.
5.250%, 1/15/30 |
315
|
|
345
|
| |
|
|
2,691
|
| |
|
|
|
| |
| Computers—0.5%
|
|
|
NCR
Corp. 144A
5.125%, 4/15/29(1) |
325
|
|
335
|
| Containers
& Packaging—1.9% |
|
|
Berry
Global, Inc. 144A
5.625%, 7/15/27(1) |
250
|
|
264
|
Owens-Brockway
Glass Container, Inc. 144A
6.625%, 5/13/27(1) |
460
|
|
493
|
Trivium
Packaging Finance B.V. 144A
8.500%, 8/15/27(1) |
525
|
|
564
|
| |
|
|
1,321
|
| |
|
|
|
| |
| Cosmetics
& Personal Care—0.3% |
|
|
Edgewell
Personal Care Co. 144A
5.500%, 6/1/28(1) |
220
|
|
232
|
| Diversified
Financial Services—3.9% |
|
|
Coinbase
Global, Inc. 144A
3.625%, 10/1/31(1) |
240
|
|
228
|
Nationstar
Mortgage Holdings, Inc. 144A
5.500%, 8/15/28(1) |
495
|
|
510
|
| |
Par
Value |
|
Value
|
| |
|
|
|
Diversified
Financial
Services—continued |
|
|
| Navient
Corp. |
|
|
|
| 6.750%,
6/15/26 |
$ 395
|
|
$ 436
|
| 4.875%,
3/15/28 |
160
|
|
161
|
| OneMain
Finance Corp. |
|
|
|
| 6.625%,
1/15/28 |
790
|
|
909
|
| 5.375%,
11/15/29 |
180
|
|
195
|
PennyMac
Financial Services, Inc. 144A
4.250%, 2/15/29(1) |
320
|
|
305
|
| |
|
|
2,744
|
| |
|
|
|
| |
Electronic
Equipment, Instruments &
Components—0.7% |
|
|
WESCO
Distribution, Inc. 144A
7.250%, 6/15/28(1) |
445
|
|
493
|
| Entertainment—5.2%
|
|
|
| Caesars
Entertainment, Inc. |
|
|
|
| 144A
8.125%, 7/1/27(1) |
785
|
|
882
|
| 144A
4.625%, 10/15/29(1) |
170
|
|
172
|
Cedar
Fair LP
5.375%, 4/15/27 |
480
|
|
493
|
International
Game Technology plc 144A
6.250%, 1/15/27(1) |
400
|
|
452
|
Lions
Gate Capital Holdings LLC 144A
5.500%, 4/15/29(1) |
470
|
|
486
|
Live
Nation Entertainment, Inc. 144A
4.750%, 10/15/27(1) |
480
|
|
488
|
Scientific
Games International, Inc. 144A
8.250%, 3/15/26(1) |
600
|
|
637
|
| |
|
|
3,610
|
| |
|
|
|
| |
| Environmental
Services—0.7% |
|
|
GFL
Environmental, Inc. 144A
4.750%, 6/15/29(1) |
505
|
|
519
|
Equity
Real Estate Investment Trusts
(REITs)—1.7% |
|
|
Iron
Mountain, Inc. 144A
5.250%, 7/15/30(1) |
490
|
|
520
|
Park
Intermediate Holdings LLC 144A
4.875%, 5/15/29(1) |
340
|
|
350
|
| Service
Properties Trust |
|
|
|
| 4.350%,
10/1/24 |
150
|
|
152
|
| 4.500%,
3/15/25 |
200
|
|
200
|
| |
|
|
1,222
|
| |
|
|
|
| |
| Food
& Beverage—4.1% |
|
|
| Kraft
Heinz Foods Co. |
|
|
|
| 5.000%,
7/15/35 |
145
|
|
178
|
| 6.500%,
2/9/40 |
455
|
|
646
|
See Notes to Financial Statements
AllianzGI High Yield Bond
Fund
SCHEDULE OF INVESTMENTS (Continued)
September 30, 2021
($ reported in
thousands)
| |
Par
Value |
|
Value
|
| |
|
|
|
| Food
& Beverage—continued |
|
|
Performance
Food Group, Inc. 144A
4.250%, 8/1/29(1) |
$ 345
|
|
$ 346
|
Post
Holdings, Inc. 144A
4.500%, 9/15/31(1) |
345
|
|
341
|
Simmons
Foods, Inc. 144A
4.625%, 3/1/29(1) |
360
|
|
363
|
Triton
Water Holdings, Inc. 144A
6.250%, 4/1/29(1) |
505
|
|
513
|
US
Foods, Inc. 144A
4.750%, 2/15/29(1) |
460
|
|
472
|
| |
|
|
2,859
|
| |
|
|
|
| |
| Food
Service—0.2% |
|
|
Aramark
Services, Inc. 144A
5.000%, 2/1/28(1) |
150
|
|
154
|
| Healthcare-Products—0.3%
|
|
|
Mozart
Debt Merger Sub, Inc. 144A
5.250%, 10/1/29(1) |
180
|
|
183
|
| Healthcare-Services—2.6%
|
|
|
Encompass
Health Corp.
4.750%, 2/1/30 |
210
|
|
221
|
HCA,
Inc.
5.625%, 9/1/28 |
310
|
|
369
|
ModivCare
Escrow Issuer, Inc. 144A
5.000%, 10/1/29(1) |
200
|
|
207
|
Select
Medical Corp. 144A
6.250%, 8/15/26(1) |
325
|
|
342
|
Tenet
Healthcare Corp. 144A
6.125%, 10/1/28(1) |
645
|
|
677
|
| |
|
|
1,816
|
| |
|
|
|
| |
| Home
Builders—1.2% |
|
|
Picasso
Finance Sub, Inc. 144A
6.125%, 6/15/25(1) |
360
|
|
381
|
Taylor
Morrison Communities, Inc. 144A
5.750%, 1/15/28(1) |
400
|
|
445
|
| |
|
|
826
|
| |
|
|
|
| |
| Home
Furnishings—0.5% |
|
|
Tempur
Sealy International, Inc. 144A
3.875%, 10/15/31(1) |
340
|
|
340
|
| Internet—1.6%
|
|
|
Netflix,
Inc. 144A
5.375%, 11/15/29(1) |
300
|
|
363
|
| Uber
Technologies, Inc. |
|
|
|
| 144A
8.000%, 11/1/26(1) |
265
|
|
280
|
| |
Par
Value |
|
Value
|
| |
|
|
|
| Internet—continued
|
|
|
| 144A
7.500%, 9/15/27(1) |
$ 445
|
|
$ 486
|
| |
|
|
1,129
|
| |
|
|
|
| |
| Investment
Companies—0.5% |
|
|
Compass
Group Diversified Holdings LLC 144A
5.250%, 4/15/29(1) |
350
|
|
366
|
| Iron
& Steel—2.0% |
|
|
| Cleveland-Cliffs,
Inc. |
|
|
|
| 5.875%,
6/1/27 |
495
|
|
512
|
| 144A
6.750%, 3/15/26(1) |
400
|
|
426
|
United
States Steel Corp.
6.875%, 3/1/29 |
465
|
|
496
|
| |
|
|
1,434
|
| |
|
|
|
| |
| Leisure
Time—2.9% |
|
|
| Carnival
Corp. |
|
|
|
| 144A
10.500%, 2/1/26(1) |
440
|
|
510
|
| 144A
5.750%, 3/1/27(1) |
180
|
|
186
|
NCL
Corp., Ltd. 144A
5.875%, 3/15/26(1) |
505
|
|
518
|
| Royal
Caribbean Cruises Ltd. |
|
|
|
| 144A
11.500%, 6/1/25(1) |
589
|
|
672
|
| 144A
5.500%, 4/1/28(1) |
160
|
|
164
|
| |
|
|
2,050
|
| |
|
|
|
| |
| Lodging—1.0%
|
|
|
Boyd
Gaming Corp. 144A
8.625%, 6/1/25(1) |
430
|
|
466
|
MGM
Resorts International
4.750%, 10/15/28 |
245
|
|
258
|
| |
|
|
724
|
| |
|
|
|
| |
Machinery-Construction
&
Mining—0.8% |
|
|
Terex
Corp. 144A
5.000%, 5/15/29(1) |
510
|
|
529
|
| Media—6.7%
|
|
|
| CCO
Holdings LLC |
|
|
|
| 4.500%,
5/1/32 |
265
|
|
273
|
| 144A
5.375%, 6/1/29(1) |
500
|
|
540
|
| CSC
Holdings LLC |
|
|
|
| 144A
7.500%, 4/1/28(1) |
510
|
|
551
|
| 144A
5.750%, 1/15/30(1) |
185
|
|
188
|
DIRECTV
Holdings LLC 144A
5.875%, 8/15/27(1) |
500
|
|
522
|
DISH
DBS Corp.
7.375%, 7/1/28 |
495
|
|
525
|
Gray
Television, Inc. 144A
4.750%, 10/15/30(1) |
530
|
|
521
|
Meredith
Corp.
6.875%, 2/1/26 |
645
|
|
666
|
Nexstar
Media, Inc. 144A
5.625%, 7/15/27(1) |
260
|
|
275
|
Scripps
Escrow II, Inc. 144A
5.375%, 1/15/31(1) |
405
|
|
398
|
| |
Par
Value |
|
Value
|
| |
|
|
|
| Media—continued
|
|
|
Virgin
Media Finance plc 144A
5.000%, 7/15/30(1) |
$ 235
|
|
$ 241
|
| |
|
|
4,700
|
| |
|
|
|
| |
| Metal
Fabricate/Hardware—0.6% |
|
|
Park-Ohio
Industries, Inc.
6.625%, 4/15/27 |
390
|
|
390
|
| Mining—0.8%
|
|
|
Hudbay
Minerals, Inc. 144A
4.500%, 4/1/26(1) |
365
|
|
361
|
Joseph
T Ryerson & Son, Inc. 144A
8.500%, 8/1/28(1) |
208
|
|
231
|
| |
|
|
592
|
| |
|
|
|
| |
| Oil,
Gas & Consumable Fuels—9.9% |
|
|
| Antero
Resources Corp. |
|
|
|
| 144A
7.625%, 2/1/29(1) |
390
|
|
436
|
| 144A
5.375%, 3/1/30(1) |
175
|
|
184
|
Callon
Petroleum Co. 144A
8.000%, 8/1/28(1) |
690
|
|
681
|
CITGO
Petroleum Corp. 144A
6.375%, 6/15/26(1) |
170
|
|
173
|
CNX
Resources Corp. 144A
7.250%, 3/14/27(1) |
405
|
|
431
|
| Comstock
Resources, Inc. |
|
|
|
| 144A
6.750%, 3/1/29(1) |
475
|
|
513
|
| 144A
5.875%, 1/15/30(1) |
325
|
|
338
|
Continental
Resources, Inc. 144A
5.750%, 1/15/31(1) |
260
|
|
314
|
EQT
Corp.
7.500%, 2/1/30 |
330
|
|
425
|
| Occidental
Petroleum Corp. |
|
|
|
| 5.550%,
3/15/26 |
650
|
|
722
|
| 8.875%,
7/15/30 |
150
|
|
204
|
| 6.625%,
9/1/30 |
380
|
|
468
|
PBF
Holding Co. LLC
6.000%, 2/15/28 |
295
|
|
188
|
PDC
Energy, Inc.
5.750%, 5/15/26 |
400
|
|
417
|
SM
Energy Co.
6.500%, 7/15/28 |
360
|
|
373
|
Southwestern
Energy Co.
5.375%, 3/15/30 |
325
|
|
351
|
Sunoco
LP
5.875%, 3/15/28 |
205
|
|
216
|
USA
Compression Partners LP
6.875%, 9/1/27 |
495
|
|
524
|
| |
|
|
6,958
|
| |
|
|
|
| |
| Paper
& Forest Products—0.5% |
|
|
Mercer
International, Inc.
5.125%, 2/1/29 |
330
|
|
337
|
See Notes to Financial Statements
AllianzGI High Yield Bond
Fund
SCHEDULE OF INVESTMENTS (Continued)
September 30, 2021
($ reported in
thousands)
| |
Par
Value |
|
Value
|
| |
|
|
|
| Pharmaceuticals—4.0%
|
|
|
AdaptHealth
LLC 144A
4.625%, 8/1/29(1) |
$ 410
|
|
$ 410
|
Bausch
Health Americas, Inc. 144A
8.500%, 1/31/27(1) |
500
|
|
533
|
Bausch
Health Cos., Inc. 144A
7.250%, 5/30/29(1) |
515
|
|
528
|
Jazz
Securities DAC 144A
4.375%, 1/15/29(1) |
345
|
|
357
|
Organon
& Co. 144A
5.125%, 4/30/31(1) |
505
|
|
530
|
Prestige
Brands, Inc. 144A
5.125%, 1/15/28(1) |
395
|
|
412
|
| |
|
|
2,770
|
| |
|
|
|
| |
| Pipelines—3.7%
|
|
|
Antero
Midstream Partners LP 144A
5.375%, 6/15/29(1) |
325
|
|
335
|
Crestwood
Midstream Partners LP 144A
6.000%, 2/1/29(1) |
495
|
|
518
|
DCP
Midstream Operating LP
5.125%, 5/15/29 |
290
|
|
326
|
EQM
Midstream Partners LP 144A
6.500%, 7/1/27(1) |
220
|
|
247
|
NGL
Energy Operating LLC 144A
7.500%, 2/1/26(1) |
505
|
|
514
|
NuStar
Logistics LP
6.375%, 10/1/30 |
305
|
|
336
|
Targa
Resources Partners LP
6.500%, 7/15/27 |
315
|
|
340
|
| |
|
|
2,616
|
| |
|
|
|
| |
| Real
Estate—0.7% |
|
|
Kennedy-Wilson,
Inc.
5.000%, 3/1/31 |
470
|
|
481
|
| Retail—1.7%
|
|
|
Bath
& Body Works, Inc. 144A
6.625%, 10/1/30(1) |
295
|
|
335
|
Carvana
Co. 144A
4.875%, 9/1/29(1) |
340
|
|
337
|
Foot
Locker, Inc. 144A
4.000%, 10/1/29(1) |
170
|
|
170
|
New
Red Finance, Inc. 144A
4.000%, 10/15/30(1) |
345
|
|
342
|
| |
|
|
1,184
|
| |
|
|
|
| |
| |
Par
Value |
|
Value
|
| |
|
|
|
| Semiconductors—0.9%
|
|
|
Amkor
Technology, Inc. 144A
6.625%, 9/15/27(1) |
$ 245
|
|
$ 262
|
Synaptics,
Inc. 144A
4.000%, 6/15/29(1) |
345
|
|
353
|
| |
|
|
615
|
| |
|
|
|
| |
| Software—2.7%
|
|
|
Clarivate
Science Holdings Corp. 144A
4.875%, 7/1/29(1) |
515
|
|
516
|
Consensus
Cloud Solutions, Inc. 144A
6.500%, 10/15/28(1) |
505
|
|
524
|
Rackspace
Technology Global, Inc. 144A
5.375%, 12/1/28(1) |
355
|
|
349
|
SS&C
Technologies, Inc. 144A
5.500%, 9/30/27(1) |
445
|
|
470
|
| |
|
|
1,859
|
| |
|
|
|
| |
| Telecommunications—7.1%
|
|
|
Avaya,
Inc. 144A
6.125%, 9/15/28(1) |
445
|
|
468
|
Cincinnati
Bell, Inc. 144A
7.000%, 7/15/24(1) |
510
|
|
519
|
CommScope
Technologies LLC 144A
5.000%, 3/15/27(1) |
330
|
|
314
|
CommScope,
Inc. 144A
8.250%, 3/1/27(1) |
495
|
|
518
|
Frontier
Communications Holdings LLC 144A
5.000%, 5/1/28(1) |
300
|
|
315
|
Hughes
Satellite Systems Corp.
6.625%, 8/1/26 |
465
|
|
529
|
LogMeIn,
Inc. 144A
5.500%, 9/1/27(1) |
335
|
|
341
|
| Lumen
Technologies, Inc. |
|
|
|
| 144A
4.500%, 1/15/29(1) |
440
|
|
426
|
| 144A
5.375%, 6/15/29(1) |
520
|
|
531
|
Plantronics,
Inc. 144A
4.750%, 3/1/29(1) |
360
|
|
337
|
Sprint
Corp.
7.625%, 3/1/26 |
530
|
|
642
|
| |
|
|
4,940
|
| |
|
|
|
| |
| |
Par
Value |
|
Value
|
| |
|
|
|
| Transportation—1.0%
|
|
|
| Fortress
Transportation & Infrastructure Investors LLC |
|
|
|
| 144A
9.750%, 8/1/27(1) |
$ 300
|
|
$
340 |
| 144A
5.500%, 5/1/28(1) |
340
|
|
342
|
| |
|
|
682
|
| |
|
|
|
| |
Total
Corporate Bonds and Notes
(Identified Cost $60,118) |
|
63,203
|
| |
|
|
|
| |
| |
|
|
|
| |
| |
Shares
|
|
| Preferred
Stock—2.7% |
| Entertainment—2.7%
|
|
| LiveStyle,
Inc. Series B(2)(3)(4)(5)(6) |
18,941
|
1,894
|
Total
Preferred Stock
(Identified Cost $1,857) |
1,894
|
| |
|
|
| |
| |
|
|
| |
| Common
Stocks—2.0% |
| Banks—1.9%
|
|
| CCF
Holdings LLC(4)(5) |
1,570,753
|
1,131
|
| CCF
Holdings LLC Class M(4)(5) |
293,320
|
211
|
| |
|
1,342
|
| |
|
|
| |
| Consumer
Finance—0.1% |
|
| Erickson,
Inc.(4)(5) |
2,675
|
75
|
| Entertainment—0.0%
|
|
| LiveStyle,
Inc.(2)(3)(4)(5)(6) |
67,983
|
—
(7) |
Total
Common Stocks
(Identified Cost $4,817) |
1,417
|
| |
|
|
| |
| |
|
|
| |
| Warrants—0.3%
|
| Banks—0.3%
|
|
| CCF
Holdings LLC(4)(5) |
485,227
|
228
|
| Entertainment—0.0%
|
|
| LiveStyle,
Inc. Series C(2)(3)(4)(5) |
14,500
|
—
(7) |
See Notes to Financial Statements
AllianzGI High Yield Bond
Fund
SCHEDULE OF INVESTMENTS (Continued)
September 30, 2021
($ reported in
thousands)
| |
Shares
|
|
Value
|
| |
|
|
|
| Media—0.0%
|
|
|
| Affinion
Group Holdings(4)(5)(6) |
3,898
|
|
$
— |
Total
Warrants
(Identified Cost $770) |
|
228
|
| |
|
|
|
| |
| |
|
|
|
| |
Total
Long-Term Investments—95.3%
(Identified Cost $67,562) |
|
66,742
|
| |
|
|
|
| |
| |
|
|
|
| |
| Short-Term
Investment—7.1% |
| Money
Market Mutual Fund—7.1% |
| Dreyfus
Government Cash Management Fund - Institutional Shares (seven-day effective yield 0.030%)(8) |
4,962,933
|
|
4,963
|
Total
Short-Term Investment
(Identified Cost $4,963) |
|
4,963
|
| |
|
|
|
| |
| |
|
|
|
| |
TOTAL
INVESTMENTS—102.4%
(Identified Cost $72,525) |
|
$71,705
|
| Other
assets and liabilities, net—(2.4)% |
|
(1,714)
|
| NET
ASSETS—100.0% |
|
$69,991
|
| Abbreviations:
|
| LLC
|
Limited
Liability Company |
| LP
|
Limited
Partnership |
| Footnote
Legend: |
|
(1) |
Security
exempt from registration under Rule 144A of the Securities Act of 1933. These securities may be resold in transactions exempt from registration, normally to qualified institutional buyers. At September 30, 2021, these securities amounted to a value
of $44,283 or 63.3% of net assets. |
|
(2) |
A
member of the Fund’s portfolio management team is a member of the board of directors of LiveStyle, Inc. The Fund’s aggregate value of investments in LiveStyle, Inc. represents 2.71% of net assets. See Note 4H in the Notes to Financial
Statements. |
|
(3) |
Affiliated
investment. See Note 4H in Notes to Financial Statements. |
|
(4) |
The
value of this security was determined using significant unobservable inputs and is reported as a Level 3 security in the Fair Value Hierarchy table located after the Schedule of Investments. |
|
(5) |
Non-income
producing. |
|
(6) |
All
or a portion of the security is restricted. |
|
(7) |
Amount
is less than $500. |
|
(8) |
Shares
of this fund are publicly offered, and its prospectus and annual report are publicly available. |
| Country
Weightings (Unaudited)† |
| United
States |
92%
|
| Canada
|
2
|
| Liberia
|
1
|
| Panama
|
1
|
| United
Kingdom |
1
|
| Netherlands
|
1
|
| Bermuda
|
1
|
| Ireland
|
1
|
| Total
|
100%
|
|
† % of total investments as of September 30, 2021. |
The following table summarizes the market
value of the Fund’s investments as of September 30, 2021, based on the inputs used to value them (See Security Valuation Note 2A in the Notes to Financial Statements):
| |
Total
Value at
September 30, 2021 |
|
Level
1
Quoted Prices |
|
Level
2
Significant
Observable
Inputs |
|
Level
3
Significant
Unobservable
Inputs |
| Assets:
|
|
|
|
|
|
|
|
| Debt
Securities: |
|
|
|
|
|
|
|
| Corporate
Bonds and Notes |
$63,203
|
|
$
— |
|
$63,203
|
|
$
— |
| Equity
Securities: |
|
|
|
|
|
|
|
| Common
Stocks |
1,417
|
|
—
|
|
—
|
|
1,417
|
| Preferred
Stock |
1,894
|
|
—
|
|
—
|
|
1,894
|
| Warrants
|
228
|
|
—
|
|
—
|
|
228
(1) |
| Money
Market Mutual Fund |
4,963
|
|
4,963
|
|
—
|
|
—
|
| Total
Investments |
$71,705
|
|
$4,963
|
|
$63,203
|
|
$3,539
|
|
(1) |
Includes
internally fair valued securities currently priced at zero ($0). |
There were no transfers into or out of Level
3 related to securities held at September 30, 2021.
Some of the Fund’s investments that
were categorized as Level 3 were valued utilizing third party pricing information without adjustment. Such valuations are based on unobservable inputs. A significant change in third party information could result in a significantly lower or higher
value of Level 3 investments.
For information regarding the abbreviations, see the Key
Investment Terms starting on page 6.
See Notes to Financial Statements
AllianzGI High Yield Bond
Fund
SCHEDULE OF INVESTMENTS (Continued)
September 30, 2021
($ reported in
thousands)
The following is a reconciliation of assets of the Fund
for Level 3 investments for which significant unobservable inputs were used to determine fair value.
| |
Total
|
|
Corporate
Bonds
And Notes |
|
Common
Stocks |
|
Preferred
Stocks |
|
Warrants
|
| Investments
in Securities |
|
|
|
|
|
|
|
|
|
| Balance
as of September 30, 2020: |
$
7,616 |
|
$
2,766 |
|
$
35 |
|
$
4,799 |
|
$
16 |
| Accrued
discount/(premium) |
14
|
|
14
|
|
—
|
|
—
|
|
—
|
| Realized
gain (loss) |
(5,570)
|
|
(5,686)
|
|
—
|
|
116
|
|
—
|
| Change
in unrealized appreciation (depreciation)(c) |
7,550
|
|
8,266
|
|
(2,072)
|
|
1,144
|
|
212
|
| Purchases
|
3,454
|
|
—
|
|
3,454
|
|
—
|
|
—
|
| Sales
(d) |
(9,525)
|
|
(5,360)
(b) |
|
—
|
|
(4,165)
|
|
—
|
| Balance
as of September 30, 2021 |
$
3,539 |
|
$
— |
|
$
1,417 |
|
$
1,894 |
|
$ 228
(a) |
(a) Includes internally fair valued security currently priced at zero ($0).
(b) Includes securities issued or removed due to corporate actions.
(c) The change in unrealized appreciation (depreciation) on investments still held at September 30, 2021, was $578.
(d) Includes paydowns on securities.
The following table presents additional information
about valuation techniques and inputs used for investments that are measured at fair value and categorized within Level 3 at September 30, 2021:
| Investments
in Securities – Assets |
|
Ending
Balance
at September 30, 2021 |
|
Valuation
Technique Used |
|
Unobservable
Inputs |
|
Input
Values |
| Preferred
Stock: |
|
|
|
|
|
|
|
|
| LiveStyle,
Inc. Series B |
|
$1,894
|
|
Market
and Company Comparables |
|
EV
Multiples |
|
4.35x
(0.43x - 17.64x) |
| |
|
|
|
|
|
Illiquidity
Discount |
|
(25%
- 30%) |
| |
|
|
|
|
|
|
|
|
| Common
Stocks: |
|
|
|
|
|
|
|
|
| CCF
Holdings LLC |
|
$1,131
|
|
Market
and Company Comparables |
|
EV
Multiples
Illiquidity Discount |
|
1.07x
(0.33x - 1.87x)
0.54x (0.20x - 0.78x)
20% |
| |
|
|
|
|
|
|
|
|
| CCF
Holdings LLC Class M |
|
$
211 |
|
Market
and Company Comparables |
|
EV
Multiples
Illiquidity Discount |
|
1.07x
(0.33x - 1.87x)
0.54x (0.20x - 0.78x)
20% |
| |
|
|
|
|
|
|
|
|
| Erickson,
Inc. |
|
$
75 |
|
Market
and Company Comparables |
|
EV
Multiples |
|
1.32x
(0.74x - 2.38x)
11.58x (7.87x - 47.06x)
1.01x (0.57x - 1.43x) |
| |
|
|
|
|
|
M&A
Transaction Multiples
Illiquidity Discount |
|
0.96x
(0.41x - 1.96x)
20% |
| |
|
|
|
|
|
|
|
|
| LiveStyle,
Inc. |
|
$
—(1) |
|
Market
and Company Comparables |
|
EV
Multiples |
|
4.35x
(0.43x - 17.64x) |
| |
|
|
|
|
|
Illiquidity
Discount |
|
(25%
- 30%) |
| |
|
|
|
|
|
|
|
|
| Warrants:
|
|
|
|
|
|
|
|
|
| CCF
Holdings LLC |
|
$
228 |
|
Market
and Company Comparables |
|
EV
Multiples |
|
1.07x
(0.33x - 1.87x)
0.54x (0.20x - 0.78x) |
| |
|
|
|
Black-Scholes
Model |
|
Illiquidity
Discount
Volatility |
|
20%
52.95% |
| |
|
|
|
|
|
|
|
|
| LiveStyle,
Inc. Series C |
|
$
—(1) |
|
Market
and Company Comparables |
|
EV
Multiples |
|
4.35x
(0.43x - 17.64x) |
| |
|
|
|
|
|
Illiquidity
Discount |
|
(25%
- 30%) |
| |
|
|
|
|
|
|
|
|
(1) Amount is less than $500.
See Notes to
Financial Statements
AllianzGI International
Small-Cap Fund
SCHEDULE OF INVESTMENTS September 30, 2021
($ reported in thousands)
| |
Shares
|
|
Value
|
| Preferred
Stock—1.4% |
| Germany—1.4%
|
|
|
| Jungheinrich
AG |
23,096
|
|
$
1,071 |
Total
Preferred Stock
(Identified Cost $502) |
|
1,071
|
| |
|
|
|
| |
| |
|
|
|
| |
| Common
Stocks—96.8% |
| Australia—4.6%
|
|
|
| ALS
Ltd. |
97,953
|
|
882
|
| Ansell
Ltd. |
7,007
|
|
170
|
| Bapcor
Ltd. |
90,106
|
|
486
|
| Nick
Scali Ltd. |
52,521
|
|
431
|
| Paradigm
Biopharmaceuticals Ltd.(1) |
246,278
|
|
388
|
| Pro
Medicus Ltd. |
18,200
|
|
706
|
| Starpharma
Holdings Ltd.(1) |
531,745
|
|
508
|
| |
|
|
3,571
|
| |
|
|
|
| |
| Austria—1.4%
|
|
|
| Wienerberger
AG |
32,795
|
|
1,101
|
| Cayman
Islands—2.0% |
|
|
| Alchip
Technologies Ltd. |
47,000
|
|
1,550
|
| Denmark—2.2%
|
|
|
| Ambu
A/S Class B |
24,179
|
|
716
|
| SimCorp
A/S |
8,165
|
|
965
|
| |
|
|
1,681
|
| |
|
|
|
| |
| Finland—1.3%
|
|
|
| Huhtamaki
Oyj |
22,293
|
|
1,003
|
| France—8.6%
|
|
|
| APERAM
S.A. |
21,463
|
|
1,190
|
| Elis
S.A.(1) |
66,163
|
|
1,262
|
| Nexity
S.A. |
21,091
|
|
1,003
|
| SCOR
SE |
30,565
|
|
880
|
| SOITEC
(1) |
5,728
|
|
1,238
|
| SPIE
S.A. |
45,287
|
|
1,025
|
| |
|
|
6,598
|
| |
|
|
|
| |
| Germany—7.6%
|
|
|
| Bechtle
AG |
17,661
|
|
1,208
|
| CANCOM
SE |
22,963
|
|
1,356
|
| Deutsche
Pfandbriefbank AG |
21,023
|
|
237
|
| Evotec
SE(1) |
29,251
|
|
1,387
|
| Jenoptik
AG |
28,673
|
|
966
|
| Scout24
AG |
9,699
|
|
672
|
| |
|
|
5,826
|
| |
|
|
|
| |
| Hong
Kong—3.1% |
|
|
| Hutchmed
China Ltd. ADR(1) |
21,240
|
|
777
|
| |
Shares
|
|
Value
|
| |
|
|
|
| Hong
Kong—continued |
|
|
| Melco
International Development Ltd.(1) |
280,000
|
|
$ 330
|
| Tam
Jai International Co., Ltd.(1) |
663,000
|
|
284
|
| Techtronic
Industries Co., Ltd. |
19,000
|
|
375
|
| VTech
Holdings Ltd. |
82,600
|
|
601
|
| |
|
|
2,367
|
| |
|
|
|
| |
| Ireland—1.6%
|
|
|
| Grafton
Group plc - UTS |
74,655
|
|
1,269
|
| Italy—2.7%
|
|
|
| Buzzi
Unicem SpA |
40,871
|
|
929
|
| ERG
SpA |
38,009
|
|
1,128
|
| |
|
|
2,057
|
| |
|
|
|
| |
| Japan—28.2%
|
|
|
| Asahi
Intecc Co. Ltd. |
32,200
|
|
882
|
| COMSYS
Holdings Corp. |
39,300
|
|
1,037
|
| Dai
Nippon Printing Co. Ltd. |
40,100
|
|
966
|
| Ferrotec
Holdings Corp. |
7,500
|
|
212
|
| Fuji
Electric Co. Ltd. |
24,400
|
|
1,110
|
| Hitachi
Zosen Corp. |
58,700
|
|
449
|
| Industrial
& Infrastructure Fund Investment Corp. Class A |
653
|
|
1,190
|
| Jeol
Ltd. |
15,900
|
|
1,158
|
| JMDC,
Inc.(1) |
16,100
|
|
1,100
|
| Kawasaki
Kisen Kaisha Ltd.(1) |
5,200
|
|
281
|
| Mitsubishi
HC Capital, Inc. |
203,900
|
|
1,066
|
| Nikon
Corp. |
77,300
|
|
858
|
| PALTAC
Corp. |
16,100
|
|
729
|
| Penta-Ocean
Construction Co. Ltd. |
57,700
|
|
392
|
| Shimamura
Co. Ltd. |
9,700
|
|
907
|
| Ship
Healthcare Holdings, Inc. |
11,500
|
|
296
|
| Sojitz
Corp. |
83,020
|
|
1,356
|
| T&D
Holdings, Inc. |
72,500
|
|
994
|
| TechMatrix
Corp. |
67,600
|
|
1,221
|
| Tess
Holdings Co., Ltd. |
19,900
|
|
395
|
| Tokai
Carbon Co. Ltd. |
61,500
|
|
786
|
| Tokyu
Fudosan Holdings Corp. |
206,700
|
|
1,272
|
| ValueCommerce
Co. Ltd. |
24,300
|
|
1,038
|
| Zenkoku
Hosho Co. Ltd. |
19,300
|
|
942
|
| Zeon
Corp. |
76,900
|
|
1,082
|
| |
|
|
21,719
|
| |
|
|
|
| |
| Netherlands—3.1%
|
|
|
| ASM
International N.V. |
3,101
|
|
1,215
|
| |
Shares
|
|
Value
|
| |
|
|
|
| Netherlands—continued
|
|
|
| ASR
Nederland N.V. |
26,081
|
|
$ 1,193
|
| |
|
|
2,408
|
| |
|
|
|
| |
| New
Zealand—0.4% |
|
|
| Eroad
Ltd.(1) |
78,875
|
|
312
|
| Norway—3.6%
|
|
|
| Elkem
ASA(1) |
334,736
|
|
1,443
|
| Storebrand
ASA |
140,303
|
|
1,336
|
| |
|
|
2,779
|
| |
|
|
|
| |
| South
Korea—0.9% |
|
|
| Koh
Young Technology, Inc. |
41,400
|
|
676
|
| Sweden—2.6%
|
|
|
| AAK
AB |
49,436
|
|
1,063
|
| Elekta
AB Class B |
82,324
|
|
922
|
| |
|
|
1,985
|
| |
|
|
|
| |
| Switzerland—4.9%
|
|
|
| Bystronic
AG |
885
|
|
1,194
|
| Georg
Fischer AG |
883
|
|
1,308
|
| Interroll
Holding AG |
295
|
|
1,249
|
| |
|
|
3,751
|
| |
|
|
|
| |
| Taiwan—3.5%
|
|
|
| Advanced
Wireless Semiconductor Co. |
23,000
|
|
117
|
| ASMedia
Technology, Inc. |
21,000
|
|
1,240
|
| Unimicron
Technology Corp. |
289,000
|
|
1,352
|
| |
|
|
2,709
|
| |
|
|
|
| |
| United
Kingdom—14.5% |
|
|
| ASOS
plc(1) |
17,436
|
|
702
|
| Auto
Trader Group plc |
135,916
|
|
1,072
|
| Crest
Nicholson Holdings plc |
205,339
|
|
1,054
|
| Genus
plc |
17,467
|
|
1,277
|
| HomeServe
plc |
59,551
|
|
724
|
| Howden
Joinery Group plc |
109,235
|
|
1,315
|
| Intermediate
Capital Group plc |
45,270
|
|
1,240
|
| Moneysupermarket.com
Group plc |
273,707
|
|
781
|
| Rotork
plc |
153,007
|
|
715
|
| Spectris
plc |
24,243
|
|
1,258
|
See Notes to Financial Statements
AllianzGI International
Small-Cap Fund
SCHEDULE OF INVESTMENTS (Continued)
September 30, 2021
($ reported in
thousands)
| |
Shares
|
|
Value
|
| |
|
|
|
| United
Kingdom—continued |
|
|
| Wizz
Air Holdings plc(1) |
16,041
|
|
$
1,078 |
| |
|
|
11,216
|
| |
|
|
|
| |
Total
Common Stocks
(Identified Cost $56,205) |
|
74,578
|
| |
|
|
|
| |
| |
|
|
|
| |
Total
Long-Term Investments—98.2%
(Identified Cost $56,707) |
|
75,649
|
| |
|
|
|
| |
| |
|
|
|
| |
| |
Shares
|
|
Value
|
| |
|
|
|
| |
|
|
|
| Short-Term
Investment—1.3% |
| Money
Market Mutual Fund—1.3% |
| Dreyfus
Government Cash Management Fund - Institutional Shares (seven-day effective yield 0.030%)(2) |
1,039,137
|
|
$
1,039 |
Total
Short-Term Investment
(Identified Cost $1,039) |
|
1,039
|
| |
|
|
|
| |
| |
|
|
|
| |
TOTAL
INVESTMENTS—99.5%
(Identified Cost $57,746) |
|
$76,688
|
| Other
assets and liabilities, net—0.5% |
|
359
|
| NET
ASSETS—100.0% |
|
$77,047
|
| Abbreviations:
|
| ADR
|
American
Depositary Receipt |
| UTS
|
Unit
Trust Shares |
| Footnote
Legend: |
|
(1) |
Non-income
producing. |
|
(2) |
Shares
of this fund are publicly offered, and its prospectus and annual report are publicly available. |
| Country
Weightings (Unaudited)† |
| Japan
|
28%
|
| United
Kingdom |
15
|
| Germany
|
9
|
| France
|
9
|
| Switzerland
|
5
|
| Australia
|
5
|
| Norway
|
4
|
| Other
|
25
|
| Total
|
100%
|
|
† % of total investments as of September 30, 2021. |
The following table summarizes the market
value of the Fund’s investments as of September 30, 2021, based on the inputs used to value them (See Security Valuation Note 2A in the Notes to Financial Statements):
| |
Total
Value at
September 30, 2021 |
|
Level
1
Quoted Prices |
|
Level
2
Significant
Observable
Inputs |
| Assets:
|
|
|
|
|
|
| Equity
Securities: |
|
|
|
|
|
| Common
Stocks |
$74,578
|
|
$1,061
|
|
$73,517
|
| Preferred
Stock |
1,071
|
|
—
|
|
1,071
|
| Money
Market Mutual Fund |
1,039
|
|
1,039
|
|
—
|
| Total
Investments |
$76,688
|
|
$2,100
|
|
$74,588
|
There were no
securities valued using significant unobservable inputs (Level 3) at September 30, 2021.
There were no transfers into or out of Level
3 related to securities held at September 30, 2021.
For information regarding the abbreviations, see the Key Investment Terms
starting on page 6.
See Notes to Financial Statements
AllianzGI Preferred
Securities and Income Fund
SCHEDULE OF INVESTMENTS September 30, 2021
($ reported in thousands)
| |
Par
Value |
|
Value
|
| U.S.
Government Security—0.8% |
U.S.
Treasury Bonds
1.375%, 8/15/50(1) |
$ 225
|
|
$
190 |
Total
U.S. Government Security
(Identified Cost $198) |
|
190
|
| |
|
|
|
| |
| |
|
|
|
| |
| Corporate
Bonds and Notes—62.3% |
| Communications—5.0%
|
|
|
ViacomCBS,
Inc.
6.250%, 2/28/57 |
290
|
|
332
|
Vodafone
Group plc
5.125%, 6/4/81 |
800
|
|
824
|
| |
|
|
1,156
|
| |
|
|
|
| |
| Consumer,
Cyclical—5.2% |
|
|
General
Motors Financial Co., Inc. Series C
5.700%(2) |
522
|
|
601
|
United
Airlines, Inc. 144A
4.625%, 4/15/29(3) |
600
|
|
620
|
| |
|
|
1,221
|
| |
|
|
|
| |
| Energy—7.4%
|
|
|
Enbridge,
Inc.
6.250%, 3/1/78 |
75
|
|
84
|
| Energy
Transfer LP |
|
|
|
Series
G
7.125%(2) |
470
|
|
493
|
Series
H
6.500%(2) |
200
|
|
208
|
Murphy
Oil Corp.
6.375%, 7/15/28 |
440
|
|
465
|
Plains
All American Pipeline LP Series B
6.125%(2) |
401
|
|
363
|
Transcanada
Trust
5.500%, 9/15/79 |
90
|
|
99
|
| |
|
|
1,712
|
| |
|
|
|
| |
| Financials—41.4%
|
|
|
Ally
Financial, Inc. Series B
4.700%(2) |
675
|
|
703
|
American
Express Co.
3.550%(2) |
575
|
|
586
|
American
International Group, Inc.
8.175%, 5/15/58 |
374
|
|
553
|
Banco
Santander S.A.
4.750%(2) |
400
|
|
407
|
Barclays
plc
4.375%(2) |
650
|
|
649
|
Citigroup,
Inc.
3.875%(2) |
450
|
|
460
|
| |
Par
Value |
|
Value
|
| |
|
|
|
| Financials—continued
|
|
|
Citizens
Financial Group, Inc. Series B
6.000%(2) |
$ 165
|
|
$
173 |
Deutsche
Bank AG
6.000%(2) |
450
|
|
474
|
Discover
Financial Services Series C
5.500%(2) |
545
|
|
591
|
Global
Atlantic Fin Co. 144A
4.700%, 10/15/51(3) |
700
|
|
724
|
Intesa
Sanpaolo SpA 144A
7.700%(2)(3) |
200
|
|
226
|
JPMorgan
Chase & Co.
4.000%(2) |
600
|
|
602
|
Liberty
Mutual Group, Inc. 144A
4.125%, 12/15/51(3) |
725
|
|
745
|
M&T
Bank Corp.
3.500%(2) |
242
|
|
240
|
| MetLife,
Inc. |
|
|
|
| 10.750%,
8/1/39 |
860
|
|
1,498
|
| 144A
9.250%, 4/8/38(3) |
215
|
|
327
|
PNC
Financial Services Group, Inc. (The) Series T
3.400%(2) |
200
|
|
199
|
SVB
Financial Group Series C
4.000%(2) |
440
|
|
451
|
| |
|
|
9,608
|
| |
|
|
|
| |
| Utilities—3.3%
|
|
|
Edison
International Series A
5.375%(2) |
640
|
|
662
|
Southern
Co. (The) Series A
3.750%, 9/15/51 |
100
|
|
102
|
| |
|
|
764
|
| |
|
|
|
| |
Total
Corporate Bonds and Notes
(Identified Cost $13,789) |
|
14,461
|
| |
|
|
|
| |
| |
|
|
|
| |
| |
Shares
|
|
| Preferred
Stocks—33.7% |
| Communication
Services—3.4% |
|
| AT&T,
Inc. Series C , 4.750% |
19,100
|
503
|
| United
States Cellular Corp. Series C, 6.250% |
10,370
|
281
|
| |
|
784
|
| |
|
|
| |
| Consumer
Discretionary—0.4% |
|
| Ford
Motor Co., 6.000% |
3,000
|
80
|
| Financials—29.1%
|
|
| Athene
Holding Ltd. Series A, 6.350% |
29,468
|
874
|
| |
Shares
|
|
Value
|
| |
|
|
|
| Financials—continued
|
|
|
| Bank
of America Corp. Series NN, 4.375% |
23,400
|
|
$
617 |
| Bank
of Hawaii Corp. Series A, 4.375% |
16,000
|
|
409
|
| Capital
One Financial Corp. Series J, 4.800% |
13,000
|
|
341
|
| Citigroup
Capital XIII (3 month LIBOR + 6.370%), 6.499%(4) |
17
(5) |
|
474
|
| First
Horizon Corp. Series F, 6.500% |
31,910
|
|
874
|
| First
Horizon Corp., 4.700% |
4,000
|
|
104
|
| Regions
Financial Corp. Series E, 4.450% |
15,000
|
|
390
|
| Regions
Financial Corp. Series C, 5.700% |
24,618
|
|
700
|
| Synchrony
Financial Series A, 5.625% |
22,985
|
|
613
|
| Truist
Financial Corp. Series Q, 5.100% |
255
(5) |
|
293
|
| Wells
Fargo & Co. Series CC, 4.375% |
28,750
|
|
733
|
| Wells
Fargo & Co. Series DD, 4.250% |
13,500
|
|
338
|
| |
|
|
6,760
|
| |
|
|
|
| |
| Industrials—0.8%
|
|
|
| General
Electric Co. Series D, 3.446%(4) |
200
(5) |
|
196
|
Total
Preferred Stocks
(Identified Cost $7,412) |
|
7,820
|
| |
|
|
|
| |
| |
|
|
|
| |
Total
Long-Term Investments—96.8%
(Identified Cost $21,399) |
|
22,471
|
| |
|
|
|
| |
| |
|
|
|
| |
| Short-Term
Investment—3.0% |
| Money
Market Mutual Fund—3.0% |
| Dreyfus
Government Cash Management Fund - Institutional Shares (seven-day effective yield 0.030%)(6) |
705,970
|
|
706
|
Total
Short-Term Investment
(Identified Cost $706) |
|
706
|
| |
|
|
|
| |
| |
|
|
|
| |
TOTAL
INVESTMENTS—99.8%
(Identified Cost $22,105) |
|
$23,177
|
| Other
assets and liabilities, net—0.2% |
|
36
|
| NET
ASSETS—100.0% |
|
$23,213
|
See Notes to Financial Statements
AllianzGI Preferred
Securities and Income Fund
SCHEDULE OF INVESTMENTS (Continued)
September 30, 2021
($ reported in
thousands)
| Abbreviations:
|
| CDX.NA.HY
|
Credit
Default Swap Index North American High Yield |
| LIBOR
|
London
Interbank Offered Rate |
| LP
|
Limited
Partnership |
| Footnote
Legend: |
|
(1) |
All
or a portion of the security is segregated as collateral for open swap contracts. |
|
(2) |
No
contractual maturity date. |
|
(3) |
Security
exempt from registration under Rule 144A of the Securities Act of 1933. These securities may be resold in transactions exempt from registration, normally to qualified institutional buyers. At September 30, 2021, these securities amounted to a value
of $2,642 or 11.4% of net assets. |
|
(4) |
Variable
rate security. Rate disclosed is as of September 30, 2021. Information in parenthesis represents benchmark and reference rate for each security. Certain variable rate securities are not based on a published reference rate and spread but are
determined by the issuer or agent and are based on current market conditions, or, for mortgage-backed securities, are impacted by the individual mortgages which are paying off over time. These securities do not indicate a reference rate and spread
in their descriptions. |
|
(5) |
Value
shown as par value. |
|
(6) |
Shares
of this fund are publicly offered, and its prospectus and annual report are publicly available. |
| Counterparties:
|
|
| ICE
|
Intercontinental
Exchange |
| Country
Weightings (Unaudited)† |
| United
States |
84%
|
| United
Kingdom |
6
|
| Bermuda
|
4
|
| Germany
|
2
|
| Spain
|
2
|
| Italy
|
1
|
| Canada
|
1
|
| Total
|
100%
|
|
† % of total investments as of September 30, 2021. |
| Exchange-Traded
Futures contracts as of September 30, 2021 were as follows: |
| Issue
|
Expiration
|
Contracts
Purchased/(Sold) |
Notional
Value |
Value
/
Unrealized
Appreciation |
|
Value
/
Unrealized
(Depreciation) |
| Long
Contracts: |
|
|
|
|
|
|
| 5
Year U.S. Treasury Note Future |
December
2021 |
3
|
$368
|
$—
|
|
$
(2) |
| Total
|
|
|
|
$—
|
|
$
(2) |
| Centrally
cleared credit default swap - buy protection(1) outstanding as of September 30, 2021 were as follows: |
| Reference
Entity |
Payment
Frequency |
Counterparty
|
Fixed
Rate |
Expiration
Date |
Notional
Amount(2) |
Value
|
|
Premiums
Paid
(Received) |
|
Unrealized
Appreciation |
|
Unrealized
(Depreciation) |
| CDX.NA.HY.37
(3) |
Quarterly
|
ICE
|
5.000%
|
12/20/26
|
$(2,250)
|
$(207)
|
|
$
(212) |
|
$
5 |
|
$—
|
| Simon
Property Group LP Senior |
Quarterly
|
ICE
|
1.000%
|
12/20/26
|
(95)
|
(1)
|
|
(1)
|
|
—
|
|
—
(4) |
| Total
|
|
|
|
|
|
|
$(208)
|
|
$
(213) |
|
$
5 |
|
$—
(4) |
|
Footnote Legend: |
|
(1) |
If
the Fund is a buyer of protection and a credit event occurs, as defined under the terms of that particular swap agreement, the Fund will either: (i) receive from the seller of protection an amount equal to the notional amount of the swap and
deliver the referenced obligation or underlying investments comprising the referenced index; or (ii) receive a net settlement amount in the form of cash or investments equal to the notional amount of the swap less the recovery value of the
referenced obligation or underlying investments comprising the referenced index. |
|
(2) |
The
maximum potential amount the Fund could be required to pay as a seller of credit protection or receive as a buyer of credit protection if a credit event occurs as defined under the terms of that particular swap agreement. |
|
(3) |
Markit
CDX.NA.HY Index, is composed of 100 of the most liquid North American entities with high yield credit ratings that trade in the credit default swap market. |
|
(4) |
Amount
is less than $500. |
For information regarding the abbreviations, see the Key Investment Terms
starting on page 6.
See Notes to Financial Statements
AllianzGI Preferred
Securities and Income Fund
SCHEDULE OF INVESTMENTS (Continued)
September 30, 2021
($ reported in
thousands)
The following table summarizes the market value of the
Fund’s investments as of September 30, 2021, based on the inputs used to value them (See Security Valuation Note 2A in the Notes to Financial Statements):
| |
Total
Value at
September 30, 2021 |
|
Level
1
Quoted Prices |
|
Level
2
Significant
Observable
Inputs |
| Assets:
|
|
|
|
|
|
| Debt
Securities: |
|
|
|
|
|
| Corporate
Bonds and Notes |
$14,461
|
|
$
— |
|
$14,461
|
| U.S.
Government Security |
190
|
|
—
|
|
190
|
| Equity
Securities: |
|
|
|
|
|
| Preferred
Stocks |
7,820
|
|
7,331
|
|
489
|
| Money
Market Mutual Fund |
706
|
|
706
|
|
—
|
| Total
Assets |
23,177
|
|
8,037
|
|
15,140
|
| Liabilities:
|
|
|
|
|
|
| Other
Financial Instruments: |
|
|
|
|
|
| Futures
Contract |
(2)
|
|
(2)
|
|
—
|
| Centrally
Cleared Credit Default Swap |
(208)
|
|
—
|
|
(208)
|
| Total
Liabilities |
(210)
|
|
(2)
|
|
(208)
|
| Total
Investments |
$22,967
|
|
$8,035
|
|
$14,932
|
There were no securities
valued using significant unobservable inputs (Level 3) at September 30, 2021.
There were no transfers into or out of Level 3 related
to securities held at September 30, 2021.
See Notes to Financial Statements
AllianzGI Short Duration
High Income Fund
SCHEDULE OF INVESTMENTS September 30, 2021
($ reported in thousands)
| |
Par
Value |
|
Value
|
| Corporate
Bonds and Notes—89.5% |
| Advertising—0.5%
|
|
|
Summer
BC Bidco B LLC 144A
5.500%, 10/31/26(1) |
$ 3,500
|
|
$ 3,587
|
| Aerospace
& Defense—2.8% |
|
|
Spirit
AeroSystems, Inc. 144A
7.500%, 4/15/25(1) |
19,524
|
|
20,671
|
| Airlines—1.7%
|
|
|
Hawaiian
Brand Intellectual Property Ltd. 144A
5.750%, 1/20/26(1) |
2,500
|
|
2,616
|
Mileage
Plus Holdings LLC 144A
6.500%, 6/20/27(1) |
6,450
|
|
7,014
|
Spirit
Loyalty Cayman Ltd. 144A
8.000%, 9/20/25(1) |
1,200
|
|
1,346
|
United
Airlines, Inc. 144A
4.375%, 4/15/26(1) |
2,000
|
|
2,052
|
| |
|
|
13,028
|
| |
|
|
|
| |
| Apparel—0.4%
|
|
|
Hanesbrands,
Inc. 144A
5.375%, 5/15/25(1) |
2,750
|
|
2,879
|
| Auto
Components—1.7% |
|
|
Clarios
Global LP 144A
6.750%, 5/15/25(1) |
720
|
|
759
|
Goodyear
Tire & Rubber Co. (The)
9.500%, 5/31/25 |
10,950
|
|
12,018
|
| |
|
|
12,777
|
| |
|
|
|
| |
| Auto
Manufacturers—2.2% |
|
|
Ford
Motor Co.
8.500%, 4/21/23 |
15,050
|
|
16,554
|
| Chemicals—0.0%
|
|
|
CVR
Partners LP 144A
9.250%, 6/15/23(1) |
207
|
|
208
|
| Coal—0.9%
|
|
|
Cloud
Peak Energy Resources LLC PIK
12.000%, 5/1/25(2) |
6,711
|
|
4,529
|
Navajo
Transitional Energy Co. LLC
9.000%, 10/24/24 |
3,813
|
|
2,478
|
| |
|
|
7,007
|
| |
|
|
|
| |
| Commercial
Services—3.1% |
|
|
Brink’s
Co. (The) 144A
5.500%, 7/15/25(1) |
5,000
|
|
5,225
|
Prime
Security Services Borrower LLC 144A
5.250%, 4/15/24(1) |
6,000
|
|
6,399
|
Shift4
Payments LLC 144A
4.625%, 11/1/26(1) |
3,500
|
|
3,653
|
| |
Par
Value |
|
Value
|
| |
|
|
|
| Commercial
Services—continued |
|
|
Square,
Inc. 144A
2.750%, 6/1/26(1) |
$ 1,750
|
|
$ 1,774
|
WASH
Multifamily Acquisition, Inc. 144A
5.750%, 4/15/26(1) |
5,400
|
|
5,639
|
| |
|
|
22,690
|
| |
|
|
|
| |
| Computers—0.1%
|
|
|
Dell
International LLC 144A
7.125%, 6/15/24(1) |
1,100
|
|
1,125
|
| Containers
& Packaging—0.3% |
|
|
Pactiv
Evergreen Group Issuer LLC 144A
4.375%, 10/15/28(1) |
2,000
|
|
2,007
|
| Distribution/Wholesale—2.2%
|
|
|
| Wolverine
Escrow LLC |
|
|
|
| 144A
8.500%, 11/15/24(1) |
12,259
|
|
11,401
|
| 144A
9.000%, 11/15/26(1) |
5,090
|
|
4,702
|
| |
|
|
16,103
|
| |
|
|
|
| |
| Diversified
Financial Services—9.0% |
|
|
| Alliance
Data Systems Corp. |
|
|
|
| 144A
4.750%, 12/15/24(1) |
19,000
|
|
19,461
|
| 144A
7.000%, 1/15/26(1) |
6,000
|
|
6,420
|
Global
Aircraft Leasing Co. Ltd. PIK 144A
6.500%, 9/15/24(1)(3) |
16,045
|
|
15,765
|
LD
Holdings Group LLC 144A
6.500%, 11/1/25(1) |
6,775
|
|
6,758
|
PennyMac
Financial Services, Inc. 144A
5.375%, 10/15/25(1) |
2,750
|
|
2,828
|
SLM
Corp.
4.200%, 10/29/25 |
8,950
|
|
9,595
|
United
Wholesale Mortgage LLC 144A
5.500%, 11/15/25(1) |
6,000
|
|
6,045
|
| |
|
|
66,872
|
| |
|
|
|
| |
| Electric
Utilities—2.2% |
|
|
Calpine
Corp. 144A
5.250%, 6/1/26(1) |
5,250
|
|
5,401
|
Vistra
Operations Co. LLC 144A
5.500%, 9/1/26(1) |
10,450
|
|
10,737
|
| |
|
|
16,138
|
| |
|
|
|
| |
Electronic
Equipment, Instruments &
Components—0.6% |
|
|
WESCO
Distribution, Inc. 144A
7.125%, 6/15/25(1) |
4,000
|
|
4,269
|
| |
Par
Value |
|
Value
|
| |
|
|
|
| Energy-Alternate
Sources—0.5% |
|
|
Sunnova
Energy Corp. 144A
5.875%, 9/1/26(1) |
$ 4,000
|
|
$ 4,075
|
| Engineering
& Construction—1.7% |
|
|
Artera
Services LLC 144A
9.033%, 12/4/25(1) |
11,553
|
|
12,535
|
| Entertainment—2.2%
|
|
|
Banijay
Entertainment SASU 144A
5.375%, 3/1/25(1) |
6,092
|
|
6,282
|
International
Game Technology plc 144A
4.125%, 4/15/26(1) |
1,500
|
|
1,559
|
Scientific
Games International, Inc. 144A
5.000%, 10/15/25(1) |
6,500
|
|
6,687
|
Wynn
Resorts Finance LLC 144A
7.750%, 4/15/25(1) |
1,800
|
|
1,899
|
| |
|
|
16,427
|
| |
|
|
|
| |
| Environmental
Services—0.2% |
|
|
Stericycle,
Inc. 144A
5.375%, 7/15/24(1) |
1,336
|
|
1,369
|
Equity
Real Estate Investment Trusts
(REITs)—1.1% |
|
|
Blackstone
Mortgage Trust, Inc. 144A
3.750%, 1/15/27(1) |
3,000
|
|
2,974
|
HAT
Holdings I LLC 144A
3.375%, 6/15/26(1) |
2,000
|
|
2,030
|
SBA
Communications Corp.
4.875%, 9/1/24 |
3,000
|
|
3,050
|
| |
|
|
8,054
|
| |
|
|
|
| |
| Food
Service—0.6% |
|
|
Aramark
Services, Inc. 144A
5.000%, 4/1/25(1) |
4,586
|
|
4,694
|
| Healthcare-Services—3.6%
|
|
|
Akumin,
Inc. 144A
7.000%, 11/1/25(1) |
10,875
|
|
10,549
|
IQVIA,
Inc. 144A
5.000%, 10/15/26(1) |
5,000
|
|
5,124
|
RP
Escrow Issuer LLC 144A
5.250%, 12/15/25(1) |
2,400
|
|
2,469
|
| Tenet
Healthcare Corp. |
|
|
|
| 4.625%,
7/15/24 |
1,764
|
|
1,791
|
| 144A
4.875%, 1/1/26(1) |
6,500
|
|
6,727
|
| |
|
|
26,660
|
| |
|
|
|
| |
| Home
Builders—0.5% |
|
|
Forestar
Group, Inc. 144A
3.850%, 5/15/26(1) |
2,000
|
|
1,998
|
See Notes to Financial Statements
AllianzGI Short Duration
High Income Fund
SCHEDULE OF INVESTMENTS (Continued)
September 30, 2021
($ reported in
thousands)
| |
Par
Value |
|
Value
|
| |
|
|
|
| Home
Builders—continued |
|
|
Picasso
Finance Sub, Inc. 144A
6.125%, 6/15/25(1) |
$ 729
|
|
$ 771
|
Taylor
Morrison Communities, Inc. 144A
5.625%, 3/1/24(1) |
1,000
|
|
1,078
|
| |
|
|
3,847
|
| |
|
|
|
| |
| Household
Products/Wares—0.4% |
|
|
Spectrum
Brands, Inc.
5.750%, 7/15/25 |
3,099
|
|
3,176
|
| Internet—2.6%
|
|
|
Cogent
Communications Group, Inc. 144A
3.500%, 5/1/26(1) |
3,000
|
|
3,041
|
Millennium
Escrow Corp. 144A
6.625%, 8/1/26(1) |
15,900
|
|
16,376
|
| |
|
|
19,417
|
| |
|
|
|
| |
| Iron
& Steel—0.9% |
|
|
Cleveland-Cliffs,
Inc. 144A
6.750%, 3/15/26(1) |
6,039
|
|
6,439
|
| Lodging—1.6%
|
|
|
Hilton
Worldwide Finance LLC
4.875%, 4/1/27 |
2,965
|
|
3,065
|
MGM
Resorts International
7.750%, 3/15/22 |
500
|
|
514
|
Wynn
Las Vegas LLC 144A
5.500%, 3/1/25(1) |
8,000
|
|
8,160
|
| |
|
|
11,739
|
| |
|
|
|
| |
| Machinery-Diversified—0.4%
|
|
|
CNH
Industrial Capital LLC
4.375%, 4/5/22 |
2,675
|
|
2,726
|
| Media—3.0%
|
|
|
AMC
Networks, Inc.
5.000%, 4/1/24 |
9,749
|
|
9,859
|
CCO
Holdings LLC 144A
5.500%, 5/1/26(1) |
750
|
|
773
|
DIRECTV
Holdings LLC 144A
5.875%, 8/15/27(1) |
3,000
|
|
3,131
|
Sirius
XM Radio, Inc. 144A
3.125%, 9/1/26(1) |
3,000
|
|
3,041
|
TEGNA,
Inc. 144A
4.750%, 3/15/26(1) |
1,500
|
|
1,565
|
Townsquare
Media, Inc. 144A
6.875%, 2/1/26(1) |
1,871
|
|
1,963
|
| |
Par
Value |
|
Value
|
| |
|
|
|
| Media—continued
|
|
|
Univision
Communications, Inc. 144A
5.125%, 2/15/25(1) |
$ 2,000
|
|
$ 2,029
|
| |
|
|
22,361
|
| |
|
|
|
| |
| Miscellaneous
Manufacturing—2.9% |
|
|
Hillenbrand,
Inc.
5.750%, 6/15/25 |
2,000
|
|
2,110
|
| LSB
Industries, Inc. |
|
|
|
| 144A
9.625%, 5/1/23(1) |
13,100
|
|
13,637
|
| 144A
6.250%, 10/15/28(1) |
5,750
|
|
5,800
|
| |
|
|
21,547
|
| |
|
|
|
| |
| Oil,
Gas & Consumable Fuels—8.9% |
|
|
AmeriGas
Partners LP
5.625%, 5/20/24 |
2,710
|
|
2,934
|
CVR
Energy, Inc. 144A
5.250%, 2/15/25(1) |
27,929
|
|
27,650
|
| PBF
Holding Co. LLC |
|
|
|
| 7.250%,
6/15/25 |
24,000
|
|
16,152
|
| 144A
9.250%, 5/15/25(1) |
4,000
|
|
3,790
|
TechnipFMC
plc 144A
6.500%, 2/1/26(1) |
14,385
|
|
15,428
|
| |
|
|
65,954
|
| |
|
|
|
| |
| Pharmaceuticals—0.6%
|
|
|
Bausch
Health Cos., Inc. 144A
5.500%, 11/1/25(1) |
3,000
|
|
3,045
|
PRA
Health Sciences, Inc. 144A
2.875%, 7/15/26(1) |
1,500
|
|
1,515
|
| |
|
|
4,560
|
| |
|
|
|
| |
| Pipelines—8.8%
|
|
|
Cheniere
Energy Partners LP
5.625%, 10/1/26 |
10,000
|
|
10,275
|
Delek
Logistics Partners LP 144A
7.125%, 6/1/28(1) |
2,000
|
|
2,131
|
EQM
Midstream Partners LP 144A
6.000%, 7/1/25(1) |
8,000
|
|
8,770
|
| New
Fortress Energy, Inc. |
|
|
|
| 144A
6.750%, 9/15/25(1) |
17,700
|
|
17,036
|
| 144A
6.500%, 9/30/26(1) |
5,250
|
|
5,020
|
NuStar
Logistics LP
5.750%, 10/1/25 |
3,450
|
|
3,717
|
PBF
Logistics LP
6.875%, 5/15/23 |
11,912
|
|
11,614
|
Rattler
Midstream LP 144A
5.625%, 7/15/25(1) |
5,000
|
|
5,207
|
| |
Par
Value |
|
Value
|
| |
|
|
|
| Pipelines—continued
|
|
|
Targa
Resources Partners LP
5.875%, 4/15/26 |
$ 1,500
|
|
$ 1,567
|
| |
|
|
65,337
|
| |
|
|
|
| |
| Real
Estate—2.2% |
|
|
Newmark
Group, Inc.
6.125%, 11/15/23 |
10,197
|
|
11,033
|
Realogy
Group LLC 144A
7.625%, 6/15/25(1) |
5,000
|
|
5,340
|
| |
|
|
16,373
|
| |
|
|
|
| |
| Retail—3.5%
|
|
|
Carvana
Co. 144A
5.625%, 10/1/25(1) |
2,000
|
|
2,067
|
| eG
Global Finance plc |
|
|
|
| 144A
6.750%, 2/7/25(1) |
6,250
|
|
6,391
|
| 144A
8.500%, 10/30/25(1) |
9,104
|
|
9,480
|
New
Red Finance, Inc. 144A
5.750%, 4/15/25(1) |
4,500
|
|
4,724
|
Sally
Holdings LLC
5.625%, 12/1/25 |
3,534
|
|
3,621
|
| |
|
|
26,283
|
| |
|
|
|
| |
| Semiconductors—0.8%
|
|
|
ams
AG 144A
7.000%, 7/31/25(1) |
5,250
|
|
5,631
|
| Software—4.5%
|
|
|
ACI
Worldwide, Inc. 144A
5.750%, 8/15/26(1) |
2,500
|
|
2,613
|
| Consensus
Cloud Solutions, Inc. |
|
|
|
| 144A
6.000%, 10/15/26(1) |
7,250
|
|
7,449
|
| 144A
6.500%, 10/15/28(1) |
5,900
|
|
6,123
|
Veritas
US, Inc. 144A
7.500%, 9/1/25(1) |
16,500
|
|
17,160
|
| |
|
|
33,345
|
| |
|
|
|
| |
| Telecommunications—7.3%
|
|
|
CommScope,
Inc. 144A
6.000%, 3/1/26(1) |
7,000
|
|
7,268
|
Connect
Finco Sarl 144A
6.750%, 10/1/26(1) |
26,140
|
|
27,349
|
| Level
3 Financing, Inc. |
|
|
|
| 5.375%,
5/1/25 |
3,000
|
|
3,065
|
| 5.250%,
3/15/26 |
1,000
|
|
1,032
|
LogMeIn,
Inc. 144A
5.500%, 9/1/27(1) |
2,000
|
|
2,035
|
| Lumen
Technologies, Inc. |
|
|
|
| 5.800%,
3/15/22 |
500
|
|
510
|
See Notes to Financial Statements
AllianzGI Short Duration
High Income Fund
SCHEDULE OF INVESTMENTS (Continued)
September 30, 2021
($ reported in
thousands)
| |
Par
Value |
|
Value
|
| |
|
|
|
| Telecommunications—continued
|
|
|
| 144A
5.125%, 12/15/26(1) |
$ 3,000
|
|
$
3,112 |
Sprint
Communications, Inc.
6.000%, 11/15/22 |
3,000
|
|
3,154
|
Viasat,
Inc. 144A
5.625%, 4/15/27(1) |
6,250
|
|
6,516
|
| |
|
|
54,041
|
| |
|
|
|
| |
| Transportation—3.0%
|
|
|
Fly
Leasing Ltd. 144A
7.000%, 10/15/24(1) |
9,990
|
|
9,954
|
Fortress
Transportation and Infrastructure Investors LLC 144A
6.500%, 10/1/25(1) |
10,188
|
|
10,487
|
XPO
Logistics, Inc. 144A
6.250%, 5/1/25(1) |
1,500
|
|
1,583
|
| |
|
|
22,024
|
| |
|
|
|
| |
Total
Corporate Bonds and Notes
(Identified Cost $674,830) |
|
664,529
|
| |
|
|
|
| |
| |
|
|
|
| |
| Leveraged
Loans—7.0% |
| Advertising—0.4%
|
|
|
Summer
BC Bidco B LLC Tranche B-2 (3 month LIBOR + 4.500%)
5.250%, 12/4/26 (4) |
3,000
|
|
2,998
|
| Airlines—0.3%
|
|
|
United
AirLines, Inc. Tranche B (1 month LIBOR + 3.750%)
4.500%, 4/21/28 (4) |
1,990
|
|
2,002
|
| Commercial
Services—1.6% |
|
|
APX
Group, Inc. (1 month LIBOR + 3.500%)
4.000%, 7/10/28 (4) |
10,000
|
|
9,965
|
Spin
Holdco, Inc. (3 month LIBOR + 4.000%)
4.750%, 3/4/28 (4) |
1,990
|
|
1,995
|
| |
|
|
11,960
|
| |
|
|
|
| |
| Electric
Utilities—1.3% |
|
|
PG&E
Corp. Tranche B (3 month LIBOR + 3.000%)
3.500%, 6/23/25 (4) |
9,825
|
|
9,650
|
| Electronics—0.4%
|
|
|
Ingram
Micro, Inc. (3 month LIBOR + 3.500%)
4.000%, 6/30/28 (4) |
2,993
|
|
2,999
|
| |
Par
Value |
|
Value
|
| |
|
|
|
| Insurance—2.1%
|
|
|
| Asurion
LLC |
|
|
|
Tranche
B-3, Second Lien (1 month LIBOR + 5.250%)
5.334%, 1/31/28 (4) |
$ 8,000
|
|
$
7,972 |
Tranche
B-8 (1 month LIBOR + 3.250%)
3.334%, 12/23/26 (4) |
8,028
|
|
7,905
|
| |
|
|
15,877
|
| |
|
|
|
| |
| Pipelines—0.9%
|
|
|
Prairie
ECI Acquiror LP (1 month LIBOR + 4.750%)
4.834%, 3/11/26 (4) |
7,200
|
|
6,952
|
Total
Leveraged Loans
(Identified Cost $52,779) |
|
52,438
|
| |
|
|
|
| |
| |
|
|
|
| |
| |
Shares
|
|
| Common
Stocks—0.0% |
| Oil,
Gas & Consumable Fuels—0.0% |
|
| Cloud
Peak Energy, Inc.(5)(6)(7) |
40,020
|
—
|
Total
Common Stocks
(Identified Cost $—) |
—
|
| |
|
|
| |
| |
|
|
| |
Total
Long-Term Investments—96.5%
(Identified Cost $727,609) |
716,967
|
| |
|
|
| |
| |
|
|
| |
| Short-Term
Investment—4.2% |
| Money
Market Mutual Fund—4.2% |
| Dreyfus
Government Cash Management Fund - Institutional Shares (seven-day effective yield 0.030%)(8) |
31,151,691
|
31,152
|
Total
Short-Term Investment
(Identified Cost $31,152) |
31,152
|
| |
|
|
| |
| |
|
|
| |
TOTAL
INVESTMENTS—100.7%
(Identified Cost $758,761) |
$748,119
|
| Other
assets and liabilities, net—(0.7)% |
(5,526)
|
| NET
ASSETS—100.0% |
$742,593
|
| Abbreviations:
|
| LIBOR
|
London
Interbank Offered Rate |
| LLC
|
Limited
Liability Company |
| LP
|
Limited
Partnership |
| PIK
|
Payment-in-Kind
Security |
| REIT
|
Real
Estate Investment Trust |
| Footnote
Legend: |
|
(1) |
Security
exempt from registration under Rule 144A of the Securities Act of 1933. These securities may be resold in transactions exempt from registration, normally to qualified institutional buyers. At September 30, 2021, these securities amounted to a value
of $524,390 or 70.6% of net assets. |
|
(2) |
100% of
the income received was in PIK. |
|
(3) |
100% of
the income received was in cash. |
|
(4) |
Variable
rate security. Rate disclosed is as of September 30, 2021. Information in parenthesis represents benchmark and reference rate for each security. Certain variable rate securities are not based on a published reference rate and spread but are
determined by the issuer or agent and are based on current market conditions, or, for mortgage-backed securities, are impacted by the individual mortgages which are paying off over time. These securities do not indicate a reference rate and spread
in their descriptions. |
|
(5) |
The
value of this security was determined using significant unobservable inputs and is reported as a Level 3 security in the Fair Value Hierarchy table located after the Schedule of Investments. |
|
(6) |
Non-income
producing. |
|
(7) |
All
or a portion of the security is restricted. |
|
(8) |
Shares
of this fund are publicly offered, and its prospectus and annual report are publicly available. |
| Country
Weightings (Unaudited)† |
| United
States |
84%
|
| United
Kingdom |
4
|
| Luxembourg
|
4
|
| Cayman
Islands |
3
|
| Canada
|
2
|
| Bermuda
|
1
|
| France
|
1
|
| Other
|
1
|
| Total
|
100%
|
|
† % of total investments as of September 30, 2021. |
For information regarding the abbreviations, see the Key
Investment Terms starting on page 6.
See Notes to Financial Statements
AllianzGI Short Duration
High Income Fund
SCHEDULE OF INVESTMENTS (Continued)
September 30, 2021
($ reported in
thousands)
The following table summarizes the market value of the
Fund’s investments as of September 30, 2021, based on the inputs used to value them (See Security Valuation Note 2A in the Notes to Financial Statements):
| |
Total
Value at
September 30, 2021 |
|
Level
1
Quoted Prices |
|
Level
2
Significant
Observable
Inputs |
|
Level
3
Significant
Unobservable
Inputs |
| Assets:
|
|
|
|
|
|
|
|
| Debt
Securities: |
|
|
|
|
|
|
|
| Corporate
Bonds and Notes |
$664,529
|
|
$
— |
|
$664,529
|
|
$—
|
| Leveraged
Loans |
52,438
|
|
—
|
|
52,438
|
|
—
|
| Common
Stocks |
—
|
|
—
|
|
—
|
|
—
(1) |
| Money
Market Mutual Fund |
31,152
|
|
31,152
|
|
—
|
|
—
|
| Total
Investments |
$748,119
|
|
$31,152
|
|
$716,967
|
|
$—
(1) |
|
(1) |
Includes
internally fair valued securities currently priced at zero ($0). |
There were no transfers into or out of Level 3 related
to securities held at September 30, 2021.
Some of
the Fund’s investments that were categorized as Level 3 were valued utilizing third party pricing information without adjustment. Such valuations are based on unobservable inputs. A significant change in third party information could result in
a significantly lower or higher value of Level 3 investments.
Management has determined that the amount of Level 3
securities compared to total net assets is not material; therefore, the rollforward of Level 3 securities and assumptions are not shown for the period ended September 30, 2021.
See Notes to
Financial Statements
AllianzGI Water Fund
SCHEDULE OF INVESTMENTS September 30,
2021
($ reported in thousands)
| |
Shares
|
|
Value
|
| Common
Stocks—97.5% |
| Australia—1.6%
|
|
|
| Reliance
Worldwide Corp. Ltd. |
4,580,410
|
|
$ 16,656
|
| Austria—0.9%
|
|
|
| Wienerberger
AG |
276,018
|
|
9,268
|
| Canada—4.1%
|
|
|
| Algonquin
Power & Utilities Corp. |
944,988
|
|
13,855
|
| Stantec,
Inc. |
601,890
|
|
28,274
|
| |
|
|
42,129
|
| |
|
|
|
| |
| France—2.4%
|
|
|
| Veolia
Environnement S.A. |
788,374
|
|
24,089
|
| Ireland—2.8%
|
|
|
| STERIS
plc |
51,552
|
|
10,531
|
| Trane
Technologies plc |
105,471
|
|
18,210
|
| |
|
|
28,741
|
| |
|
|
|
| |
| Italy—0.9%
|
|
|
| Hera
SpA |
2,189,318
|
|
8,926
|
| Japan—1.8%
|
|
|
| Kubota
Corp. |
883,500
|
|
18,803
|
| Netherlands—1.7%
|
|
|
| Arcadis
NV |
338,278
|
|
16,896
|
| Sweden—5.1%
|
|
|
| Alfa
Laval AB |
1,396,043
|
|
52,070
|
| Switzerland—11.2%
|
|
|
| Bucher
Industries AG |
30,193
|
|
14,336
|
| Geberit
AG |
59,241
|
|
43,495
|
| Georg
Fischer AG |
24,529
|
|
36,326
|
| Sika
AG Registered Shares |
61,823
|
|
19,547
|
| |
|
|
113,704
|
| |
|
|
|
| |
| United
Kingdom—10.7% |
|
|
| CNH
Industrial NV |
1,089,448
|
|
18,313
|
| Halma
plc |
911,208
|
|
34,757
|
| Pennon
Group plc |
1,562,318
|
|
23,814
|
| Severn
Trent plc |
918,404
|
|
32,152
|
| |
|
|
109,036
|
| |
|
|
|
| |
| |
Shares
|
|
Value
|
| |
|
|
|
| United
States—54.3% |
|
|
| AGCO
Corp. |
170,297
|
|
$
20,867 |
| Agilent
Technologies, Inc. |
98,100
|
|
15,454
|
| American
Water Works Co., Inc. |
340,527
|
|
57,563
|
| Badger
Meter, Inc. |
196,858
|
|
19,910
|
| Danaher
Corp. |
126,110
|
|
38,393
|
| Deere
& Co. |
69,516
|
|
23,293
|
| Ecolab,
Inc. |
84,994
|
|
17,731
|
| Evoqua
Water Technologies Corp.(1) |
463,454
|
|
17,407
|
| Fortune
Brands Home & Security, Inc. |
203,613
|
|
18,207
|
| Franklin
Electric Co., Inc. |
335,867
|
|
26,819
|
| IDEX
Corp. |
176,842
|
|
36,597
|
| Itron,
Inc.(1) |
273,061
|
|
20,652
|
| Lindsay
Corp. |
122,196
|
|
18,548
|
| Mueller
Water Products, Inc. Class A |
653,447
|
|
9,945
|
| PerkinElmer,
Inc. |
125,973
|
|
21,830
|
| Tetra
Tech, Inc. |
201,384
|
|
30,075
|
| Thermo
Fisher Scientific, Inc. |
64,707
|
|
36,969
|
| Trimble,
Inc.(1) |
305,766
|
|
25,149
|
| Valmont
Industries, Inc. |
84,034
|
|
19,758
|
| Waste
Management, Inc. |
105,543
|
|
15,764
|
| Xylem,
Inc. |
509,007
|
|
62,954
|
| |
|
|
553,885
|
| |
|
|
|
| |
Total
Common Stocks
(Identified Cost $679,465) |
|
994,203
|
| |
|
|
|
| |
| |
|
|
|
| |
| Rights—0.1%
|
| France—0.1%
|
|
|
| Veolia
Environnement S.A.(1) |
788,374
|
|
616
|
Total
Rights
(Identified Cost $—) |
|
616
|
| |
|
|
|
| |
| |
|
|
|
| |
Total
Long-Term Investments—97.6%
(Identified Cost $679,465) |
|
994,819 |
| |
|
|
|
| |
| |
|
|
|
| |
| |
Shares
|
|
Value
|
| |
|
|
|
| |
|
|
|
| Short-Term
Investment—1.4% |
| Money
Market Mutual Fund—1.4% |
| Dreyfus
Government Cash Management Fund - Institutional Shares (seven-day effective yield 0.030%)(2) |
14,252,527
|
|
$
14,253 |
Total
Short-Term Investment
(Identified Cost $14,253) |
|
14,253
|
| |
|
|
|
| |
| |
|
|
|
| |
TOTAL
INVESTMENTS—99.0%
(Identified Cost $693,718) |
|
$1,009,072
|
| Other
assets and liabilities, net—1.0% |
|
10,544
|
| NET
ASSETS—100.0% |
|
$1,019,616
|
| Footnote
Legend: |
|
(1) |
Non-income
producing. |
|
(2) |
Shares
of this fund are publicly offered, and its prospectus and annual report are publicly available. |
| Country
Weightings (Unaudited)† |
| United
States |
56%
|
| Switzerland
|
11
|
| United
Kingdom |
11
|
| Sweden
|
5
|
| Canada
|
4
|
| Ireland
|
3
|
| France
|
2
|
| Other
|
8
|
| Total
|
100%
|
|
† % of total investments as of September 30, 2021. |
See Notes to Financial Statements
AllianzGI Water Fund
SCHEDULE OF INVESTMENTS (Continued)
September 30, 2021
($ reported in
thousands)
The following table summarizes the market value of the
Fund’s investments as of September 30, 2021, based on the inputs used to value them (See Security Valuation Note 2A in the Notes to Financial Statements):
| |
Total
Value at
September 30, 2021 |
|
Level
1
Quoted Prices |
|
Level
2
Significant
Observable
Inputs |
| Assets:
|
|
|
|
|
|
| Equity
Securities: |
|
|
|
|
|
| Common
Stocks |
$
994,203 |
|
$624,755
|
|
$369,448
|
| Rights
|
616
|
|
616
|
|
—
|
| Money
Market Mutual Fund |
14,253
|
|
14,253
|
|
—
|
| Total
Investments |
$1,009,072
|
|
$639,624
|
|
$369,448
|
There were no securities
valued using significant unobservable inputs (Level 3) at September 30, 2021.
There were no transfers into or out of Level 3 related
to securities held at September 30, 2021.
See Notes to Financial Statements
NFJ Emerging Markets Value
Fund
SCHEDULE OF INVESTMENTS
September 30, 2021
($ reported in thousands)
| |
Shares
|
|
Value
|
| Preferred
Stock—4.4% |
| South
Korea—4.4% |
|
|
| Samsung
Electronics Co., Ltd. |
112,522
|
|
$
6,564 |
Total
Preferred Stock
(Identified Cost $6,226) |
|
6,564
|
| |
|
|
|
| |
| |
|
|
|
| |
| Common
Stocks—93.3% |
| Argentina—0.7%
|
|
|
| MercadoLibre,
Inc.(1) |
600
|
|
1,008
|
| Brazil—3.2%
|
|
|
| Ambipar
Participacoes e Empreendimentos S.A. |
136,600
|
|
1,180
|
| B3
SA - Brasil Bolsa Balcao |
723,648
|
|
1,698
|
| Cia
de Locacao das Americas |
197,407
|
|
867
|
| Magazine
Luiza S.A. |
236,900
|
|
625
|
| StoneCo
Ltd. Class A(1) |
13,626
|
|
473
|
| |
|
|
4,843
|
| |
|
|
|
| |
| China—35.9%
|
|
|
| Aier
Eye Hospital Group Co. Ltd. Class A |
129,293
|
|
1,066
|
| Alibaba
Group Holding Ltd.(1) |
387,100
|
|
7,167
|
| A-Living
Smart City Services Co., Ltd. |
155,000
|
|
550
|
| Anhui
Conch Cement Co., Ltd. Class H |
70,000
|
|
378
|
| ANTA
Sports Products Ltd. |
51,000
|
|
963
|
| Bank
of Ningbo Co., Ltd. Class A |
58,954
|
|
320
|
| China
Construction Bank Corp. Class H |
734,000
|
|
524
|
| China
Lesso Group Holdings Ltd. |
196,000
|
|
312
|
| China
Merchants Bank Co., Ltd. Class A |
115,544
|
|
898
|
| China
Merchants Bank Co., Ltd. Class H |
505,100
|
|
4,020
|
| CIFI
Holdings Group Co., Ltd. |
690,000
|
|
468
|
| CSPC
Pharmaceutical Group Ltd. |
274,800
|
|
328
|
| Double
Medical Technology, Inc. Class A |
47,100
|
|
384
|
| East
Money Information Co., Ltd. Class A |
505,766
|
|
2,674
|
| ENN
Energy Holdings Ltd. |
54,900
|
|
905
|
| Foshan
Haitian Flavouring & Food Co., Ltd. Class A |
49,243
|
|
835
|
| Gree
Electric Appliances, Inc. of Zhuhai Class A |
134,100
|
|
801
|
| Hangzhou
Tigermed Consulting Co. Ltd. Class A |
42,200
|
|
1,135
|
| JD.com,
Inc. Class A(1) |
28,100
|
|
1,013
|
| |
Shares
|
|
Value
|
| |
|
|
|
| China—continued
|
|
|
| Jiangsu
Hengli Hydraulic Co., Ltd. Class A |
80,100
|
|
$ 1,046
|
| Kweichow
Moutai Co., Ltd. Class A |
3,200
|
|
903
|
| Li
Ning Co., Ltd. |
112,500
|
|
1,297
|
| Longfor
Group Holdings Ltd. |
141,500
|
|
647
|
| LONGi
Green Energy Technology Co., Ltd. Class A |
91,140
|
|
1,158
|
| Luxshare
Precision Industry Co., Ltd. Class A |
1,004,130
|
|
5,509
|
| Meituan
Class B(1) |
32,700
|
|
1,044
|
| Midea
Group Co., Ltd. Class A |
94,200
|
|
1,013
|
| NetEase,
Inc. |
36,300
|
|
614
|
| Ping
An Insurance Group Co. of China Ltd. Class H |
277,000
|
|
1,894
|
| Shandong
Weigao Group Medical Polymer Co., Ltd. Class H |
248,000
|
|
440
|
| Shenzhou
International Group Holdings Ltd. |
20,600
|
|
437
|
| Sino
Biopharmaceutical Ltd. |
282,500
|
|
234
|
| Tencent
Holdings Ltd. |
162,300
|
|
9,689
|
| Wuliangye
Yibin Co., Ltd. Class A |
26,855
|
|
909
|
| Wuxi
Biologics Cayman, Inc.(1) |
67,500
|
|
1,095
|
| Yealink
Network Technology Corp. Ltd. Class A |
35,835
|
|
450
|
| Yihai
International Holding Ltd.(1) |
97,000
|
|
541
|
| |
|
|
53,661
|
| |
|
|
|
| |
| Hong
Kong—3.9% |
|
|
| AIA
Group Ltd. |
53,800
|
|
619
|
| China
Mengniu Dairy Co., Ltd.(1) |
170,000
|
|
1,095
|
| Hong
Kong Exchanges & Clearing Ltd. |
18,900
|
|
1,161
|
| SITC
International Holdings Co., Ltd. |
270,000
|
|
961
|
| SUNeVision
Holdings Ltd. |
686,000
|
|
645
|
| Techtronic
Industries Co., Ltd. |
70,500
|
|
1,393
|
| |
|
|
5,874
|
| |
|
|
|
| |
| India—9.4%
|
|
|
| Aarti
Industries Ltd. |
76,014
|
|
950
|
| Asian
Paints Ltd. |
26,188
|
|
1,142
|
| Atul
Ltd. |
6,323
|
|
804
|
| Bajaj
Finserv Ltd. |
2,552
|
|
610
|
| Britannia
Industries Ltd. |
10,478
|
|
556
|
| Coromandel
International Ltd. |
92,616
|
|
987
|
| HDFC
Bank Ltd. |
53,285
|
|
1,139
|
| Hindustan
Unilever Ltd. |
14,046
|
|
511
|
| Indraprastha
Gas Ltd. |
139,067
|
|
996
|
| Infosys
Ltd. |
54,304
|
|
1,217
|
| |
Shares
|
|
Value
|
| |
|
|
|
| India—continued
|
|
|
| Ipca
Laboratories Ltd. |
38,744
|
|
$ 1,254
|
| Manappuram
Finance Ltd. |
182,000
|
|
412
|
| Muthoot
Finance Ltd. |
20,073
|
|
390
|
| Reliance
Industries Ltd. |
73,237
|
|
2,479
|
| Tata
Consultancy Services Ltd. |
13,409
|
|
679
|
| |
|
|
14,126
|
| |
|
|
|
| |
| Indonesia—0.7%
|
|
|
| Bank
Central Asia Tbk PT |
446,100
|
|
1,087
|
| Kazakhstan—0.8%
|
|
|
| Kaspi.KZ
JSC GDR |
11,098
|
|
1,183
|
| Netherlands—2.4%
|
|
|
| ASM
International N.V. |
2,708
|
|
1,060
|
| ASML
Holding N.V. |
1,480
|
|
1,106
|
| Prosus
N.V.(1) |
5,092
|
|
408
|
| Yandex
N.V. Class A(1) |
12,066
|
|
961
|
| |
|
|
3,535
|
| |
|
|
|
| |
| Poland—0.7%
|
|
|
| Dino
Polska S.A.(1) |
12,505
|
|
1,043
|
| Russia—1.0%
|
|
|
| LUKOIL
PJSC Sponsored ADR |
11,153
|
|
1,059
|
| Polyus
PJSC GDR |
5,431
|
|
444
|
| |
|
|
1,503
|
| |
|
|
|
| |
| Saudi
Arabia—1.4% |
|
|
| Abdullah
Al Othaim Markets Co. |
16,408
|
|
493
|
| Al
Rajhi Bank |
18,733
|
|
610
|
| Saudi
Arabian Oil Co. |
107,268
|
|
1,029
|
| |
|
|
2,132
|
| |
|
|
|
| |
| Singapore—2.1%
|
|
|
| Keppel
DC REIT |
462,200
|
|
844
|
| Mapletree
Industrial Trust |
437,800
|
|
895
|
| Sea
Ltd. ADR(1) |
4,139
|
|
1,319
|
| |
|
|
3,058
|
| |
|
|
|
| |
| South
Africa—3.8% |
|
|
| AngloGold
Ashanti Ltd. |
43,362
|
|
695
|
| Capitec
Bank Holdings Ltd. |
6,810
|
|
826
|
| Clicks
Group Ltd. |
56,489
|
|
1,041
|
| Gold
Fields Ltd. Sponsored ADR |
312,286
|
|
2,536
|
| Naspers
Ltd. Class N |
3,318
|
|
548
|
| |
|
|
5,646
|
| |
|
|
|
| |
| South
Korea—4.7% |
|
|
| Coupang,
Inc. Class A(1) |
27,019
|
|
753
|
| Douzone
Bizon Co., Ltd. |
6,899
|
|
554
|
| Hansol
Chemical Co., Ltd. |
2,780
|
|
806
|
| Kakao
Corp. |
8,499
|
|
836
|
| Macquarie
Korea Infrastructure Fund |
42,125
|
|
455
|
See Notes to Financial Statements
NFJ Emerging Markets Value
Fund
SCHEDULE OF INVESTMENTS (Continued)
September 30, 2021
($ reported in
thousands)
| |
Shares
|
|
Value
|
| |
|
|
|
| South
Korea—continued |
|
|
| NAVER
Corp. |
2,682
|
|
$ 870
|
| NCSoft
Corp. |
913
|
|
463
|
| NICE
Information Service Co., Ltd. |
30,455
|
|
522
|
| Samsung
Electronics Co., Ltd. |
17,057
|
|
1,057
|
| SK
Hynix, Inc. |
8,457
|
|
724
|
| |
|
|
7,040
|
| |
|
|
|
| |
| Taiwan—11.9%
|
|
|
| Accton
Technology Corp. |
70,000
|
|
660
|
| ASMedia
Technology, Inc. |
14,000
|
|
827
|
| ASPEED
Technology, Inc. |
15,000
|
|
1,235
|
| Chailease
Holding Co., Ltd. |
94,206
|
|
827
|
| E.Sun
Financial Holding Co., Ltd. |
1,193,774
|
|
1,123
|
| Getac
Technology Corp. |
120,000
|
|
221
|
| Lotes
Co., Ltd. |
44,000
|
|
871
|
| MediaTek,
Inc. |
28,000
|
|
901
|
| Micro-Star
International Co., Ltd. |
102,000
|
|
471
|
| Parade
Technologies Ltd. |
18,000
|
|
1,054
|
| Poya
International Co., Ltd. |
26,780
|
|
453
|
| Realtek
Semiconductor Corp. |
51,200
|
|
902
|
| Sinbon
Electronics Co., Ltd. |
89,000
|
|
748
|
| Taiwan
Semiconductor Manufacturing Co., Ltd. |
109,000
|
|
2,254
|
| Taiwan
Semiconductor Manufacturing Co., Ltd. Sponsored ADR |
7,667
|
|
856
|
| Taiwan
Union Technology Corp. |
62,000
|
|
238
|
| Unimicron
Technology Corp. |
220,000
|
|
1,029
|
| Vanguard
International Semiconductor Corp. |
245,000
|
|
1,315
|
| Voltronic
Power Technology Corp. |
21,350
|
|
1,302
|
| Wiwynn
Corp. |
17,133
|
|
531
|
| |
|
|
17,818
|
| |
|
|
|
| |
| Thailand—1.1%
|
|
|
| Carabao
Group PCL NVDR |
147,800
|
|
520
|
| Global
Power Synergy PCL NVDR |
405,500
|
|
900
|
| |
Shares
|
|
Value
|
| |
|
|
|
| Thailand—continued
|
|
|
| Tisco
Financial Group PCL NVDR |
87,400
|
|
$
236 |
| |
|
|
1,656
|
| |
|
|
|
| |
| United
States—9.6% |
|
|
| Advanced
Micro Devices, Inc.(1) |
12,950
|
|
1,333
|
| American
Tower Corp. |
3,501
|
|
929
|
| Broadcom,
Inc. |
2,271
|
|
1,101
|
| Fabrinet
(1) |
8,735
|
|
895
|
| Lam
Research Corp. |
1,416
|
|
806
|
| Micron
Technology, Inc. |
13,109
|
|
931
|
| Monolithic
Power Systems, Inc. |
2,993
|
|
1,451
|
| NVIDIA
Corp. |
6,168
|
|
1,278
|
| Skyworks
Solutions, Inc. |
5,137
|
|
846
|
| Southern
Copper Corp. |
9,554
|
|
536
|
| Teradyne,
Inc. |
39,159
|
|
4,275
|
| |
|
|
14,381
|
| |
|
|
|
| |
Total
Common Stocks
(Identified Cost $115,986) |
|
139,594
|
| |
|
|
|
| |
| |
|
|
|
| |
Total
Long-Term Investments—97.7%
(Identified Cost $122,212) |
|
146,158
|
| |
|
|
|
| |
| |
|
|
|
| |
| Short-Term
Investment—2.7% |
| Money
Market Mutual Fund—2.7% |
| Dreyfus
Government Cash Management Fund - Institutional Shares (seven-day effective yield 0.030%)(2) |
4,042,719
|
|
4,043
|
Total
Short-Term Investment
(Identified Cost $4,043) |
|
4,043
|
| |
|
|
|
| |
| |
|
|
|
| |
TOTAL
INVESTMENTS—100.4%
(Identified Cost $126,255) |
|
$150,201
|
| Other
assets and liabilities, net—(0.4)% |
|
(537)
|
| NET
ASSETS—100.0% |
|
$149,664
|
| Abbreviations:
|
| ADR
|
American
Depositary Receipt |
| GDR
|
Global
Depositary Receipt |
| JSC
|
Joint Stock
Company |
| NVDR
|
Non-Voting
Depositary Receipts |
| PJSC
|
Public
Joint Stock Company |
| REIT
|
Real
Estate Investment Trust |
| Footnote
Legend: |
|
(1) |
Non-income
producing. |
|
(2) |
Shares
of this fund are publicly offered, and its prospectus and annual report are publicly available. |
| Country
Weightings (Unaudited)† |
| China
|
36%
|
| United
States |
12
|
| Taiwan
|
12
|
| India
|
9
|
| South
Korea |
9
|
| Hong
Kong |
4
|
| South
Africa |
4
|
| Other
|
14
|
| Total
|
100%
|
|
† % of total investments as of September 30, 2021. |
For information regarding the abbreviations, see the Key
Investment Terms starting on page 6.
See Notes to Financial Statements
NFJ Emerging Markets Value
Fund
SCHEDULE OF INVESTMENTS (Continued)
September 30, 2021
($ reported in
thousands)
The following table summarizes the market value of the
Fund’s investments as of September 30, 2021, based on the inputs used to value them (See Security Valuation Note 2A in the Notes to Financial Statements):
| |
Total
Value at
September 30, 2021 |
|
Level
1
Quoted Prices |
|
Level
2
Significant
Observable
Inputs |
| Assets:
|
|
|
|
|
|
| Equity
Securities: |
|
|
|
|
|
| Common
Stocks |
$139,594
|
|
$28,740
|
|
$110,854
|
| Preferred
Stock |
6,564
|
|
—
|
|
6,564
|
| Money
Market Mutual Fund |
4,043
|
|
4,043
|
|
—
|
| Total
Investments |
$150,201
|
|
$32,783
|
|
$117,418
|
There were no securities
valued using significant unobservable inputs (Level 3) at September 30, 2021.
There were no transfers into or out of Level 3 related
to securities held at September 30, 2021.
See Notes to Financial Statements
VIRTUS STRATEGY
TRUST
STATEMENTS OF ASSETS AND LIABILITIES September 30, 2021
(Reported in thousands except shares and per share amounts)
| |
AllianzGI
Convertible Fund |
|
AllianzGI
Core Plus Bond Fund |
|
AllianzGI
Emerging Markets Consumer Fund |
|
AllianzGI
Global Allocation Fund |
| Assets
|
|
|
|
|
|
|
|
|
Investment in securities at
value(1)
|
$
3,036,897 |
|
$
58,671 |
|
$
3,956 |
|
$
179,805 |
|
Investment in affiliates at
value(2)
|
—
|
|
—
|
|
—
|
|
95,077
|
|
Foreign currency at
value(3)
|
—
|
|
—
|
|
73
|
|
39
|
|
Cash
|
2,792
|
|
48
|
|
50
|
|
100
|
|
Due from
broker
|
—
|
|
—
|
|
—
|
|
8,549
|
|
Cash pledged as collateral for
futures
|
—
|
|
17
|
|
—
|
|
3,064
|
|
Cash pledged as collateral for cleared
swaps
|
—
|
|
366
|
|
—
|
|
339
|
|
Margin due from counterparty on cleared
swaps
|
—
|
|
596
|
|
—
|
|
596
|
| Receivables
|
|
|
|
|
|
|
|
|
Investment securities sold
|
3,154
|
|
4,078
|
|
2,957
|
|
2,401
|
|
Fund shares sold
|
8,505
|
|
—
|
|
—
|
|
8
|
|
Dividends and
interest
|
3,353
|
|
256
|
|
9
|
|
521
|
|
Tax reclaims
|
—
|
|
—
|
|
13
|
|
17
|
|
Prepaid Trustees’
retainer
|
—
|
|
—
|
|
—
|
|
—
|
|
Prepaid expenses
|
83
|
|
23
|
|
14
|
|
39
|
|
Other assets
|
230
|
|
2
|
|
9
|
|
85
|
|
Total
assets
|
3,055,014
|
|
64,057
|
|
7,081
|
|
290,640
|
| Liabilities
|
|
|
|
|
|
|
|
|
Due to
Broker
|
—
|
|
107
|
|
—
|
|
—
|
|
Variation margin payable on futures
contracts
|
—
|
|
1
|
|
—
|
|
351
|
|
Swaps at
value(4)
|
—
|
|
583
|
|
—
|
|
529
|
| Payables
|
|
|
|
|
|
|
|
|
Fund shares repurchased
|
4,556
|
|
—
|
|
3,134
|
|
94
|
|
Investment securities purchased
|
35,539
|
|
9,063
|
|
—
|
|
3,013
|
|
Investment advisory fees
|
1,027
|
|
36
|
|
64
|
|
47
|
|
Distribution and service fees
|
310
|
|
—
|
|
—
(a) |
|
15
|
|
Administration and accounting
fees
|
248
|
|
5
|
|
1
|
|
25
|
|
Transfer agent and sub-transfer agent fees and
expenses
|
567
|
|
2
|
|
1
|
|
26
|
|
Professional fees
|
94
|
|
42
|
|
36
|
|
33
|
|
Trustee deferred compensation plan
|
230
|
|
2
|
|
9
|
|
85
|
|
Interest expense and/or commitment
fees
|
3
|
|
1
|
|
—
(a) |
|
—
(a) |
|
Other accrued
expenses
|
244
|
|
11
|
|
11
|
|
23
|
|
Total
liabilities
|
42,818
|
|
9,853
|
|
3,256
|
|
4,241
|
|
Net
Assets
|
$
3,012,196 |
|
$
54,204 |
|
$
3,825 |
|
$
286,399 |
| Net
Assets Consist of: |
|
|
|
|
|
|
|
|
Capital paid in on shares of beneficial
interest
|
$
2,147,428 |
|
$
53,532 |
|
$
(728) |
|
$
239,595 |
|
Accumulated earnings
(loss)
|
864,768
|
|
672
|
|
4,553
|
|
46,804
|
|
Net
Assets
|
$
3,012,196 |
|
$
54,204 |
|
$
3,825 |
|
$
286,399 |
| Net
Assets: |
|
|
|
|
|
|
|
|
Class A
|
$
396,378 |
|
$
— |
|
$
92 |
|
$
49,743 |
|
Class
C
|
$
141,138 |
|
$
— |
|
$
— |
|
$
2,558 |
|
Class
P
|
$
808,844 |
|
$
12 |
|
$
— |
|
$
6,536 |
|
Institutional
Class
|
$
1,640,171 |
|
$
1,650 |
|
$
3,733 |
|
$
10,820 |
|
Class
R6
|
$
— |
|
$
52,542 |
|
$
— |
|
$
216,700 |
|
Administrative
Class
|
$
25,665 |
|
$
— |
|
$
— |
|
$
42 |
See Notes to Financial Statements
VIRTUS STRATEGY
TRUST
STATEMENTS OF ASSETS AND LIABILITIES (Continued)
September 30, 2021
(Reported in
thousands except shares and per share amounts)
| |
AllianzGI
Convertible Fund |
|
AllianzGI
Core Plus Bond Fund |
|
AllianzGI
Emerging Markets Consumer Fund |
|
AllianzGI
Global Allocation Fund |
| Shares
Outstanding (unlimited number of shares authorized, no par value): |
|
|
|
|
|
|
|
|
Class A
|
8,665,508
|
|
—
|
|
5,682
|
|
4,149,758
|
|
Class
C
|
3,044,292
|
|
—
|
|
—
|
|
204,641
|
|
Class
P
|
18,287,187
|
|
809
|
|
—
|
|
554,155
|
|
Institutional
Class
|
36,599,628
|
|
107,734
|
|
227,652
|
|
909,998
|
|
Class
R6
|
—
|
|
3,426,384
|
|
—
|
|
18,698,011
|
|
Administrative
Class
|
568,477
|
|
—
|
|
—
|
|
3,402
|
| Net
Asset Value and Redemption Price Per Share:* |
|
|
|
|
|
|
|
|
Class A
|
$
45.74 |
|
$
— |
|
$
16.21 |
|
$
11.99 |
|
Class
C
|
$
46.36 |
|
$
— |
|
$
— |
|
$
12.50 |
|
Class
P
|
$
44.23 |
|
$
15.35 |
|
$
— |
|
$
11.79 |
|
Institutional
Class
|
$
44.81 |
|
$
15.32 |
|
$
16.40 |
|
$
11.89 |
|
Class
R6
|
$
— |
|
$
15.33 |
|
$
— |
|
$
11.59 |
|
Administrative
Class
|
$
45.15 |
|
$
— |
|
$
— |
|
$
12.42 |
| Maximum
Offering Price Per Share (NAV/(1-Maximum Sales Charge)): |
|
|
|
|
|
|
|
|
Class A
|
$
48.40 |
|
$
— |
|
$
17.15 |
|
$
12.69 |
|
Maximum Sales Charge - Class
A
|
5.50%
|
|
—%
|
|
5.50%
|
|
5.50%
|
|
(1) Investment in securities at
cost
|
$
2,645,828 |
|
$
58,097 |
|
$
2,984 |
|
$
177,800 |
|
(2) Investment in affiliates at
cost
|
$
— |
|
$
— |
|
$
— |
|
$
68,576 |
|
(3) Foreign currency at
cost
|
$
— |
|
$
— |
|
$
75 |
|
$
38 |
|
(4) Includes premiums paid (received) on swaps
|
$
— |
|
$
(582) |
|
$
— |
|
$
(534) |
|
(a) |
Amount
is less than $500. |
| *
|
Net
Asset Value and Redemption Price Per Share are calculated using unrounded net assets. |
See Notes to Financial Statements
VIRTUS STRATEGY
TRUST
STATEMENTS OF ASSETS AND LIABILITIES (Continued)
September 30, 2021
(Reported in
thousands except shares and per share amounts)
| |
AllianzGI
Global Dynamic Allocation Fund |
|
AllianzGI
Global Sustainability Fund |
|
AllianzGI
High Yield Bond Fund |
|
AllianzGI
International Small-Cap Fund |
| Assets
|
|
|
|
|
|
|
|
|
Investment in securities at
value(1)
|
$
54,890 |
|
$
125,481 |
|
$
69,811 |
|
$
76,688 |
|
Investment in affiliates at
value(2)
|
—
|
|
—
|
|
1,894
|
|
—
|
|
Foreign currency at
value(3)
|
67
|
|
—
|
|
—
|
|
198
|
|
Cash
|
50
|
|
100
|
|
50
|
|
50
|
|
Due from
broker
|
732
|
|
—
|
|
—
|
|
—
|
|
Cash pledged as collateral for
futures
|
1,073
|
|
—
|
|
—
|
|
—
|
|
Cash pledged as collateral for cleared
swaps
|
46
|
|
—
|
|
—
|
|
—
|
|
Margin due from counterparty on cleared
swaps
|
82
|
|
—
|
|
—
|
|
—
|
| Receivables
|
|
|
|
|
|
|
|
|
Investment securities sold
|
741
|
|
—
|
|
—
|
|
736
|
|
Fund shares sold
|
54
|
|
8
|
|
1
|
|
30
|
|
Dividends and
interest
|
142
|
|
27
|
|
872
|
|
178
|
|
Tax reclaims
|
58
|
|
98
|
|
3
|
|
334
|
|
Prepaid expenses
|
44
|
|
27
|
|
40
|
|
36
|
|
Other assets
|
46
|
|
6
|
|
60
|
|
34
|
|
Total
assets
|
58,025
|
|
125,747
|
|
72,731
|
|
78,284
|
| Liabilities
|
|
|
|
|
|
|
|
|
Variation margin payable on futures
contracts
|
89
|
|
—
|
|
—
|
|
—
|
|
Swaps at
value(4)
|
121
|
|
—
|
|
—
|
|
—
|
| Payables
|
|
|
|
|
|
|
|
|
Fund shares repurchased
|
2
|
|
10
|
|
1
|
|
44
|
|
Investment securities purchased
|
900
|
|
—
|
|
2,505
|
|
958
|
|
Investment advisory fees
|
85
|
|
98
|
|
90
|
|
103
|
|
Distribution and service fees
|
2
|
|
8
|
|
10
|
|
8
|
|
Administration and accounting
fees
|
5
|
|
11
|
|
6
|
|
8
|
|
Transfer agent and sub-transfer agent fees and
expenses
|
8
|
|
16
|
|
15
|
|
16
|
|
Professional fees
|
28
|
|
37
|
|
41
|
|
39
|
|
Trustee deferred compensation plan
|
46
|
|
6
|
|
60
|
|
34
|
|
Interest expense and/or commitment
fees
|
—
(a) |
|
—
(a) |
|
—
(a) |
|
—
(a) |
|
Other accrued
expenses
|
28
|
|
36
|
|
12
|
|
27
|
|
Total
liabilities
|
1,314
|
|
222
|
|
2,740
|
|
1,237
|
|
Net
Assets
|
$
56,711 |
|
$
125,525 |
|
$
69,991 |
|
$
77,047 |
| Net
Assets Consist of: |
|
|
|
|
|
|
|
|
Capital paid in on shares of beneficial
interest
|
$
44,681 |
|
$
66,404 |
|
$
108,757 |
|
$
47,639 |
|
Accumulated earnings
(loss)
|
12,030
|
|
59,121
|
|
(38,766)
|
|
29,408
|
|
Net
Assets
|
$
56,711 |
|
$
125,525 |
|
$
69,991 |
|
$
77,047 |
| Net
Assets: |
|
|
|
|
|
|
|
|
Class A
|
$
3,648 |
|
$
5,305 |
|
$
20,763 |
|
$
4,853 |
|
Class
C
|
$
944 |
|
$
— |
|
$
2,255 |
|
$
373 |
|
Class
P
|
$
16,310 |
|
$
5,336 |
|
$
4,196 |
|
$
10,911 |
|
Institutional
Class
|
$
13,464 |
|
$
114,884 |
|
$
42,666 |
|
$
29,125 |
|
Class
R6
|
$
22,314 |
|
$
— |
|
$
— |
|
$
31,785 |
|
Administrative
Class
|
$
31 |
|
$
— |
|
$
111 |
|
$
— |
See Notes to Financial Statements
VIRTUS STRATEGY
TRUST
STATEMENTS OF ASSETS AND LIABILITIES (Continued)
September 30, 2021
(Reported in
thousands except shares and per share amounts)
| |
AllianzGI
Global Dynamic Allocation Fund |
|
AllianzGI
Global Sustainability Fund |
|
AllianzGI
High Yield Bond Fund |
|
AllianzGI
International Small-Cap Fund |
| Shares
Outstanding (unlimited number of shares authorized, no par value): |
|
|
|
|
|
|
|
|
Class A
|
208,886
|
|
208,034
|
|
2,314,466
|
|
115,807
|
|
Class
C
|
55,485
|
|
—
|
|
251,889
|
|
9,300
|
|
Class
P
|
902,332
|
|
207,493
|
|
491,353
|
|
261,173
|
|
Institutional
Class
|
754,219
|
|
4,372,137
|
|
4,978,442
|
|
673,547
|
|
Class
R6
|
1,264,466
|
|
—
|
|
—
|
|
741,517
|
|
Administrative
Class
|
1,799
|
|
—
|
|
13,059
|
|
—
|
| Net
Asset Value and Redemption Price Per Share:* |
|
|
|
|
|
|
|
|
Class A
|
$
17.46 |
|
$
25.50 |
|
$
8.97 |
|
$
41.91 |
|
Class
C
|
$
17.00 |
|
$
— |
|
$
8.95 |
|
$
40.12 |
|
Class
P
|
$
18.08 |
|
$
25.72 |
|
$
8.54 |
|
$
41.77 |
|
Institutional
Class
|
$
17.85 |
|
$
26.28 |
|
$
8.57 |
|
$
43.24 |
|
Class
R6
|
$
17.65 |
|
$
— |
|
$
— |
|
$
42.86 |
|
Administrative
Class
|
$
17.38 |
|
$
— |
|
$
8.52 |
|
$
— |
| Maximum
Offering Price Per Share (NAV/(1-Maximum Sales Charge)): |
|
|
|
|
|
|
|
|
Class A
|
$
18.48 |
|
$
26.98 |
|
$
9.32 |
|
$
44.35 |
|
Maximum Sales Charge - Class
A
|
5.50%
|
|
5.50%
|
|
3.75%
|
|
5.50%
|
|
(1) Investment in securities at
cost
|
$
50,193 |
|
$
88,345 |
|
$
70,668 |
|
$
57,746 |
|
(2) Investment in affiliates at
cost
|
$
— |
|
$
— |
|
$
1,857 |
|
$
— |
|
(3) Foreign currency at
cost
|
$
68 |
|
$
— |
|
$
— |
|
$
198 |
|
(4) Includes premiums paid (received) on swaps
|
$
(81) |
|
$
— |
|
$
— |
|
$
— |
|
(a) |
Amount
is less than $500. |
| *
|
Net
Asset Value and Redemption Price Per Share are calculated using unrounded net assets. |
See Notes to Financial Statements
VIRTUS STRATEGY
TRUST
STATEMENTS OF ASSETS AND LIABILITIES (Continued)
September 30, 2021
(Reported in
thousands except shares and per share amounts)
| |
AllianzGI
Preferred Securities and Income Fund |
|
AllianzGI
Short Duration High Income Fund |
|
AllianzGI
Water Fund |
|
NFJ
Emerging Markets Value Fund |
| Assets
|
|
|
|
|
|
|
|
|
Investment in securities at
value(1)
|
$
23,177 |
|
$
748,119 |
|
$
1,009,072 |
|
$
150,201 |
|
Foreign currency at
value(2)
|
—
|
|
—
|
|
6,034
|
|
—
|
|
Cash
|
50
|
|
100
|
|
100
|
|
100
|
|
Cash pledged as collateral for
futures
|
2
|
|
—
|
|
—
|
|
—
|
|
Cash pledged as collateral for cleared
swaps
|
113
|
|
—
|
|
—
|
|
—
|
|
Margin due from counterparty on cleared
swaps
|
213
|
|
—
|
|
—
|
|
—
|
|
Variation margin receivable on futures
contracts
|
—
(a) |
|
—
|
|
—
|
|
—
|
| Receivables
|
|
|
|
|
|
|
|
|
Investment securities sold
|
97
|
|
5,293
|
|
3
|
|
—
|
|
Fund shares sold
|
225
|
|
1,081
|
|
4,719
|
|
91
|
|
Dividends and
interest
|
182
|
|
12,297
|
|
845
|
|
163
|
|
Tax reclaims
|
—
|
|
—
|
|
1,095
|
|
6
|
|
Prepaid expenses
|
22
|
|
48
|
|
47
|
|
38
|
|
Other assets
|
—
(a) |
|
272
|
|
133
|
|
20
|
|
Total
assets
|
24,081
|
|
767,210
|
|
1,022,048
|
|
150,619
|
| Liabilities
|
|
|
|
|
|
|
|
|
Due to
custodian
|
—
|
|
—
|
|
—
|
|
—
|
|
Due to
Broker
|
90
|
|
—
|
|
—
|
|
—
|
|
Swaps at
value(3)
|
208
|
|
—
|
|
—
|
|
—
|
| Payables
|
|
|
|
|
|
|
|
|
Fund shares repurchased
|
1
|
|
1,446
|
|
997
|
|
177
|
|
Investment securities purchased
|
492
|
|
21,972
|
|
3
|
|
—
|
|
Foreign capital gains
tax
|
—
|
|
—
|
|
—
|
|
493
|
|
Investment advisory fees
|
30
|
|
289
|
|
549
|
|
106
|
|
Distribution and service fees
|
—
|
|
281
|
|
250
|
|
9
|
|
Administration and accounting
fees
|
2
|
|
62
|
|
88
|
|
13
|
|
Transfer agent and sub-transfer agent fees and
expenses
|
2
|
|
176
|
|
232
|
|
57
|
|
Professional fees
|
38
|
|
46
|
|
47
|
|
27
|
|
Trustee deferred compensation plan
|
—
(a) |
|
272
|
|
133
|
|
20
|
|
Interest expense and/or commitment
fees
|
—
(a) |
|
1
|
|
1
|
|
—
(a) |
|
Other accrued
expenses
|
5
|
|
72
|
|
132
|
|
53
|
|
Total
liabilities
|
868
|
|
24,617
|
|
2,432
|
|
955
|
|
Net
Assets
|
$
23,213 |
|
$
742,593 |
|
$
1,019,616 |
|
$
149,664 |
| Net
Assets Consist of: |
|
|
|
|
|
|
|
|
Capital paid in on shares of beneficial
interest
|
$
20,796 |
|
$
900,187 |
|
$
624,290 |
|
$
135,961 |
|
Accumulated earnings
(loss)
|
2,417
|
|
(157,594)
|
|
395,326
|
|
13,703
|
|
Net
Assets
|
$
23,213 |
|
$
742,593 |
|
$
1,019,616 |
|
$
149,664 |
| Net
Assets: |
|
|
|
|
|
|
|
|
Class A
|
$
— |
|
$
145,424 |
|
$
286,453 |
|
$
15,565 |
|
Class
C
|
$
— |
|
$
77,032 |
|
$
68,805 |
|
$
914 |
|
Class
P
|
$
13 |
|
$
247,819 |
|
$
339,111 |
|
$
10,449 |
|
Institutional
Class
|
$
6,904 |
|
$
251,201 |
|
$
325,247 |
|
$
122,736 |
|
Class
R6
|
$
16,296 |
|
$
21,117 |
|
$
— |
|
$
— |
| Shares
Outstanding (unlimited number of shares authorized, no par value): |
|
|
|
|
|
|
|
|
Class A
|
—
|
|
9,970,075
|
|
12,761,061
|
|
774,001
|
|
Class
C
|
—
|
|
5,265,950
|
|
3,249,121
|
|
45,435
|
|
Class
P
|
804
|
|
17,070,677
|
|
15,054,121
|
|
522,655
|
|
Institutional
Class
|
421,910
|
|
17,359,506
|
|
14,742,699
|
|
6,142,810
|
|
Class
R6
|
996,305
|
|
1,457,966
|
|
—
|
|
—
|
See Notes to Financial Statements
VIRTUS STRATEGY
TRUST
STATEMENTS OF ASSETS AND LIABILITIES (Continued)
September 30, 2021
(Reported in
thousands except shares and per share amounts)
| |
AllianzGI
Preferred Securities and Income Fund |
|
AllianzGI
Short Duration High Income Fund |
|
AllianzGI
Water Fund |
|
NFJ
Emerging Markets Value Fund |
| Net
Asset Value and Redemption Price Per Share:* |
|
|
|
|
|
|
|
|
Class A
|
$
— |
|
$
14.59 |
|
$
22.45 |
|
$
20.11 |
|
Class
C
|
$
— |
|
$
14.63 |
|
$
21.18 |
|
$
20.12 |
|
Class
P
|
$
16.35 |
|
$
14.52 |
|
$
22.53 |
|
$
19.99 |
|
Institutional
Class
|
$
16.36 |
|
$
14.47 |
|
$
22.06 |
|
$
19.98 |
|
Class
R6
|
$
16.36 |
|
$
14.48 |
|
$
— |
|
$
— |
| Maximum
Offering Price Per Share (NAV/(1-Maximum Sales Charge)): |
|
|
|
|
|
|
|
|
Class A
|
$
— |
|
$
14.93 |
|
$
23.76 |
|
$
21.28 |
|
Maximum Sales Charge - Class
A
|
—%
|
|
2.25%
|
|
5.50%
|
|
5.50%
|
|
(1) Investment in securities at
cost
|
$
22,105 |
|
$
758,761 |
|
$
693,718 |
|
$
126,255 |
|
(2) Foreign currency at
cost
|
$
— |
|
$
— |
|
$
6,173 |
|
$
— |
|
(3) Includes premiums paid (received) on swaps
|
$
(213) |
|
$
— |
|
$
— |
|
$
— |
|
(a) |
Amount
is less than $500. |
| *
|
Net
Asset Value and Redemption Price Per Share are calculated using unrounded net assets. |
See Notes to Financial Statements
VIRTUS STRATEGY
TRUST
STATEMENTS OF OPERATIONS YEAR ENDED September 30, 2021
($ reported in thousands)
| |
AllianzGI
Convertible Fund |
|
AllianzGI
Core Plus Bond Fund |
|
AllianzGI
Emerging Markets Consumer Fund |
|
AllianzGI
Global Allocation Fund |
|
AllianzGI
Global Dynamic Allocation Fund |
| Investment
Income |
|
|
|
|
|
|
|
|
|
|
Dividends
|
$17,714
|
|
$
22 |
|
$
302 |
|
$
1,272 |
|
$
560 |
|
Dividends from affiliated
|
—
|
|
—
|
|
—
|
|
2,466
|
|
121
|
|
Interest
|
16,048
|
|
1,159
|
|
—
|
|
1,448
|
|
361
|
|
Foreign taxes withheld
|
—
|
|
—
|
|
(45)
|
|
(56)
|
|
(42)
|
|
Total investment
income
|
33,762
|
|
1,181
|
|
257
|
|
5,130
|
|
1,000
|
| Expenses
|
|
|
|
|
|
|
|
|
|
|
Investment advisory
fees
|
15,948
|
|
163
|
|
133
|
|
2,045
|
|
357
|
|
Distribution and service fees, Class A
|
967
|
|
—
|
|
—
(1) |
|
126
|
|
6
|
|
Distribution and service fees, Class
C
|
1,409
|
|
—
|
|
—
|
|
31
|
|
7
|
|
Distribution and service fees, Class
R
|
1
|
|
—
|
|
—
|
|
—
(1) |
|
—
(1) |
|
Distribution and service fees, Class
P
|
89
|
|
—
|
|
—
|
|
2
|
|
—
(1) |
|
Distribution and service fees, Administrative
Class
|
58
|
|
—
|
|
—
|
|
—
(1) |
|
—
(1) |
|
Administration and accounting
fees
|
1,865
|
|
37
|
|
10
|
|
189
|
|
35
|
|
Transfer agent fees and
expenses
|
931
|
|
18
|
|
4
|
|
111
|
|
19
|
|
Sub-transfer agent fees and expenses, Class A
|
225
|
|
—
|
|
—
(1) |
|
22
|
|
1
|
|
Sub-transfer agent fees and expenses, Class
C
|
80
|
|
—
|
|
—
|
|
1
|
|
—
(1) |
|
Sub-transfer agent fees and expenses, Class
R
|
—
(1) |
|
—
|
|
—
|
|
—
|
|
—
(1) |
|
Sub-transfer agent fees and expenses, Class
P
|
646
|
|
—
|
|
—
|
|
6
|
|
2
|
|
Sub-transfer agent fees and expenses, Institutional
Class
|
860
|
|
—
(1) |
|
—
(1) |
|
—
(1) |
|
11
|
|
Sub-transfer agent fees and expenses, Administrative
Class
|
2
|
|
—
|
|
—
|
|
1
|
|
—
(1) |
|
Custodian fees
|
264
|
|
38
|
|
66
|
|
84
|
|
144
|
|
Printing fees and expenses
|
215
|
|
—
|
|
—
|
|
16
|
|
1
|
|
Professional fees
|
180
|
|
46
|
|
47
|
|
62
|
|
73
|
|
Interest expense and/or commitment
fees
|
2
|
|
2
|
|
—
(1) |
|
1
|
|
—
(1) |
|
Registration fees
|
213
|
|
46
|
|
35
|
|
98
|
|
98
|
|
Trustees’ fees and expenses
|
245
|
|
6
|
|
3
|
|
31
|
|
7
|
|
Miscellaneous
expenses
|
100
|
|
7
|
|
7
|
|
25
|
|
17
|
|
Total
expenses
|
24,300
|
|
363
|
|
305
|
|
2,851
|
|
778
|
|
Less net expenses reimbursed and/or waived by investment
adviser(2)
|
(2,398)
|
|
(225)
|
|
(140)
|
|
(1,907)
|
|
(469)
|
|
Net
expenses
|
21,902
|
|
138
|
|
165
|
|
944
|
|
309
|
|
Net investment income
(loss)
|
11,860
|
|
1,043
|
|
92
|
|
4,186
|
|
691
|
| |
|
|
|
|
|
|
|
|
|
See Notes to Financial Statements
VIRTUS STRATEGY
TRUST
STATEMENTS OF OPERATIONS (Continued)
YEAR ENDED September 30,
2021
($ reported in thousands)
| |
AllianzGI
Convertible Fund |
|
AllianzGI
Core Plus Bond Fund |
|
AllianzGI
Emerging Markets Consumer Fund |
|
AllianzGI
Global Allocation Fund |
|
AllianzGI
Global Dynamic Allocation Fund |
| Net
Realized and Unrealized Gain (Loss) on Investments |
|
|
|
|
|
|
|
|
|
| Net
realized gain (loss) from: |
|
|
|
|
|
|
|
|
|
|
Investments
|
$498,165
|
|
$
865 |
|
$12,470
|
|
$
5,250 |
|
$
5,036 |
|
Investments in
affiliates
|
—
|
|
—
|
|
—
|
|
3,406
|
|
(2,547)
|
|
Foreign currency
transactions
|
—
|
|
(2)
|
|
(16)
|
|
(36)
|
|
38
|
|
Forward foreign currency
transactions
|
—
|
|
—
|
|
—
(1) |
|
—
(1) |
|
(2)
|
|
Futures
|
—
|
|
(119)
|
|
—
|
|
8,935
|
|
3,119
|
|
Swaps
|
—
|
|
(323)
|
|
—
|
|
43
|
|
580
|
|
Net increase from payment by
affiliate(3)
|
—
|
|
—
|
|
—
|
|
19
|
|
5
|
|
Capital gain received from investments in underlying
funds
|
—
|
|
—
|
|
—
|
|
4,055
|
|
4,137
|
| Net
change in unrealized appreciation (depreciation) on: |
|
|
|
|
|
|
|
|
|
|
Investments
|
40,697
|
|
(404)
|
|
(9,589)
|
|
334
|
|
1,639
|
|
Investments in
affiliates
|
—
|
|
—
|
|
—
|
|
15,281
|
|
(1,351)
|
|
Foreign currency
transactions
|
—
|
|
—
|
|
(5)
|
|
(28)
|
|
(7)
|
|
Futures
|
—
|
|
58
|
|
—
|
|
(597)
|
|
(152)
|
|
Swaps
|
—
|
|
331
|
|
—
|
|
4
|
|
(50)
|
|
Net realized and unrealized gain (loss) on
investments
|
538,862
|
|
406
|
|
2,860
|
|
36,666
|
|
10,445
|
|
Net increase (decrease) in net assets resulting from
operations
|
$550,722
|
|
$1,449
|
|
$
2,952 |
|
$40,852
|
|
$11,136
|
|
(1) |
Amount
is less than $500. |
|
(2) |
See
Note 4D in Notes to Financial Statements. |
|
(3) |
See
Note 4G in Notes to Financial Statements. |
See Notes to Financial Statements
VIRTUS STRATEGY
TRUST
STATEMENTS OF OPERATIONS (Continued)
YEAR ENDED September 30,
2021
($ reported in thousands)
| |
AllianzGI
Global Sustainability Fund |
|
AllianzGI
High Yield Bond Fund |
|
AllianzGI
International Small-Cap Fund |
|
AllianzGI
Preferred Securities and Income Fund |
|
AllianzGI
Short Duration High Income Fund |
| Investment
Income |
|
|
|
|
|
|
|
|
|
|
Dividends
|
$
2,251 |
|
$
432 |
|
$
1,677 |
|
$
350 |
|
$
4 |
|
Interest
|
—
|
|
4,154
|
|
—
|
|
746
|
|
40,077
|
|
Foreign taxes withheld
|
(132)
|
|
(7)
|
|
(177)
|
|
—
|
|
—
|
|
Total investment
income
|
2,119
|
|
4,579
|
|
1,500
|
|
1,096
|
|
40,081
|
| Expenses
|
|
|
|
|
|
|
|
|
|
|
Investment advisory
fees
|
1,218
|
|
362
|
|
859
|
|
101
|
|
3,771
|
|
Distribution and service fees, Class A
|
10
|
|
53
|
|
13
|
|
—
|
|
364
|
|
Distribution and service fees, Class
C
|
—
|
|
30
|
|
6
|
|
—
|
|
433
|
|
Distribution and service fees, Class
R
|
—
|
|
—
(1) |
|
1
|
|
—
|
|
—
|
|
Distribution and service fees, Class
P
|
6
|
|
2
|
|
3
|
|
—
|
|
86
|
|
Distribution and service fees, Administrative
Class
|
—
|
|
—
(1) |
|
—
|
|
—
|
|
—
|
|
Administration and accounting
fees
|
90
|
|
47
|
|
57
|
|
16
|
|
490
|
|
Transfer agent fees and
expenses
|
45
|
|
27
|
|
30
|
|
7
|
|
268
|
|
Sub-transfer agent fees and expenses, Class A
|
2
|
|
14
|
|
5
|
|
—
|
|
65
|
|
Sub-transfer agent fees and expenses, Class
C
|
—
|
|
2
|
|
—
(1) |
|
—
|
|
59
|
|
Sub-transfer agent fees and expenses, Class
R
|
—
|
|
—
(1) |
|
1
|
|
—
|
|
—
|
|
Sub-transfer agent fees and expenses, Class
P
|
14
|
|
5
|
|
11
|
|
—
|
|
238
|
|
Sub-transfer agent fees and expenses, Institutional
Class
|
26
|
|
24
|
|
34
|
|
8
|
|
181
|
|
Sub-transfer agent fees and expenses, Administrative
Class
|
—
|
|
1
|
|
—
|
|
—
|
|
—
|
|
Custodian fees
|
136
|
|
31
|
|
109
|
|
22
|
|
108
|
|
Printing fees and expenses
|
5
|
|
1
|
|
—
|
|
—
|
|
42
|
|
Professional fees
|
48
|
|
45
|
|
43
|
|
43
|
|
69
|
|
Interest expense and/or commitment
fees
|
1
|
|
—
(1) |
|
—
(1) |
|
—
(1) |
|
5
|
|
Registration fees
|
48
|
|
85
|
|
85
|
|
47
|
|
101
|
|
Trustees’ fees and expenses
|
18
|
|
9
|
|
9
|
|
3
|
|
87
|
|
Miscellaneous
expenses
|
13
|
|
15
|
|
16
|
|
4
|
|
47
|
|
Total
expenses
|
1,680
|
|
753
|
|
1,282
|
|
251
|
|
6,414
|
|
Less net expenses reimbursed and/or waived by investment
adviser(2)
|
(600)
|
|
(10)
|
|
(377)
|
|
(136)
|
|
(763)
|
|
Net
expenses
|
1,080
|
|
743
|
|
905
|
|
115
|
|
5,651
|
|
Net investment income
(loss)
|
1,039
|
|
3,836
|
|
595
|
|
981
|
|
34,430
|
| Net
Realized and Unrealized Gain (Loss) on Investments |
|
|
|
|
|
|
|
|
|
| Net
realized gain (loss) from: |
|
|
|
|
|
|
|
|
|
|
Investments
|
21,616
|
|
(2,022)
|
|
11,176
|
|
1,638
|
|
(2,872)
|
|
Foreign currency
transactions
|
(26)
|
|
—
|
|
28
|
|
—
(1) |
|
—
|
|
Forward foreign currency
transactions
|
1
|
|
—
|
|
(3)
|
|
—
|
|
—
|
|
Futures
|
—
|
|
—
|
|
—
|
|
(4)
|
|
—
|
|
Swaps
|
—
|
|
—
|
|
—
|
|
(136)
|
|
—
|
|
Net increase from payment by
affiliate(3)
|
—
|
|
—
|
|
—
|
|
4
|
|
—
|
| Net
change in unrealized appreciation (depreciation) on: |
|
|
|
|
|
|
|
|
|
|
Investments
|
11,562
|
|
6,147
|
|
6,276
|
|
1,046
|
|
49,267
|
|
Investments in
affiliates
|
—
|
|
1,282
|
|
—
|
|
—
|
|
—
|
|
Foreign currency
transactions
|
(2)
|
|
—
|
|
(21)
|
|
—
|
|
—
|
|
Forward foreign currency
transactions
|
—
|
|
—
|
|
—
(1) |
|
—
|
|
—
|
|
Futures
|
—
|
|
—
|
|
—
|
|
(2)
|
|
—
|
|
Swaps
|
—
|
|
—
|
|
—
|
|
130
|
|
—
|
|
Net realized and unrealized gain (loss) on
investments
|
33,151
|
|
5,407
|
|
17,456
|
|
2,676
|
|
46,395
|
See Notes to Financial Statements
VIRTUS STRATEGY
TRUST
STATEMENTS OF OPERATIONS (Continued)
YEAR ENDED September 30,
2021
($ reported in thousands)
| |
AllianzGI
Global Sustainability Fund |
|
AllianzGI
High Yield Bond Fund |
|
AllianzGI
International Small-Cap Fund |
|
AllianzGI
Preferred Securities and Income Fund |
|
AllianzGI
Short Duration High Income Fund |
|
Net increase (decrease) in net assets resulting from
operations
|
$34,190
|
|
$
9,243 |
|
$18,051
|
|
$3,657
|
|
$80,825
|
|
(1) |
Amount
is less than $500. |
|
(2) |
See
Note 4D in Notes to Financial Statements. |
|
(3) |
See
Note 4G in Notes to Financial Statements. |
See Notes to Financial Statements
VIRTUS STRATEGY
TRUST
STATEMENTS OF OPERATIONS (Continued)
YEAR ENDED September 30,
2021
($ reported in thousands)
| |
AllianzGI
Water Fund |
|
NFJ
Emerging Markets Value Fund |
| Investment
Income |
|
|
|
|
Dividends
|
$
22,727 |
|
$
2,508 |
|
Foreign taxes withheld
|
(705)
|
|
(304)
|
|
Total investment
income
|
22,022
|
|
2,204
|
| Expenses
|
|
|
|
|
Investment advisory
fees
|
8,494
|
|
1,341
|
|
Distribution and service fees, Class A
|
631
|
|
42
|
|
Distribution and service fees, Class
C
|
673
|
|
11
|
|
Distribution and service fees, Class
P
|
80
|
|
3
|
|
Administration and accounting
fees
|
602
|
|
103
|
|
Transfer agent fees and
expenses
|
309
|
|
52
|
|
Sub-transfer agent fees and expenses, Class A
|
180
|
|
11
|
|
Sub-transfer agent fees and expenses, Class
C
|
55
|
|
1
|
|
Sub-transfer agent fees and expenses, Class
P
|
288
|
|
27
|
|
Sub-transfer agent fees and expenses, Institutional
Class
|
216
|
|
121
|
|
Custodian fees
|
245
|
|
206
|
|
Printing fees and expenses
|
63
|
|
7
|
|
Professional fees
|
72
|
|
44
|
|
Interest expense and/or commitment
fees
|
3
|
|
—
(1) |
|
Registration fees
|
82
|
|
65
|
|
Trustees’ fees and expenses
|
81
|
|
16
|
|
Miscellaneous
expenses
|
111
|
|
17
|
|
Total
expenses
|
12,185
|
|
2,067
|
|
Less net expenses reimbursed and/or waived by investment
adviser(2)
|
(2,405)
|
|
(600)
|
|
Net
expenses
|
9,780
|
|
1,467
|
|
Net investment income
(loss)
|
12,242
|
|
737
|
| Net
Realized and Unrealized Gain (Loss) on Investments |
|
|
|
| Net
realized gain (loss) from: |
|
|
|
|
Investments
|
74,295
|
|
15,389
|
|
Foreign currency
transactions
|
(51)
|
|
33
|
|
Foreign capital gains
tax
|
—
|
|
—
(1) |
|
Forward foreign currency
transactions
|
(28)
|
|
—
|
| Net
change in unrealized appreciation (depreciation) on: |
|
|
|
|
Investments
|
125,508
|
|
1,569
|
|
Foreign currency
transactions
|
(117)
|
|
(33)
|
|
Foreign capital gains
tax
|
—
|
|
(493)
|
|
Net realized and unrealized gain (loss) on
investments
|
199,607
|
|
16,465
|
|
Net increase (decrease) in net assets resulting from
operations
|
$211,849
|
|
$17,202
|
|
(1) |
Amount
is less than $500. |
|
(2) |
See
Note 4D in Notes to Financial Statements. |
See Notes to Financial Statements
VIRTUS STRATEGIC
TRUST
STATEMENTS OF CHANGES IN NET ASSETS
($ reported in
thousands)
| |
AllianzGI
Convertible Fund |
|
AllianzGI
Core Plus Bond Fund |
|
AllianzGI
Emerging Markets Consumer Fund |
| |
Year
Ended
September 30,
2021 |
|
Year
Ended
September 30,
2020 |
|
Year
Ended
September 30,
2021 |
|
Year
Ended
September 30,
2020 |
|
Year
Ended
September 30,
2021 |
|
Year
Ended
September 30,
2020 |
| Increase
(Decrease) in Net Assets Resulting from Operations |
|
|
|
|
|
|
|
|
|
|
|
|
Net investment income (loss)
|
$
11,860 |
|
$
11,292 |
|
$
1,043 |
|
$
1,465 |
|
$
92 |
|
$
413 |
|
Net realized gain (loss)
|
498,165
|
|
138,326
|
|
421
|
|
3,868
|
|
12,454
|
|
(872)
|
|
Net change in unrealized appreciation (depreciation)
|
40,697
|
|
296,228
|
|
(15)
|
|
(258)
|
|
(9,594)
|
|
5,541
|
|
Increase (decrease) in net assets resulting from
operations
|
550,722
|
|
445,846
|
|
1,449
|
|
5,075
|
|
2,952
|
|
5,082
|
| Dividends
and Distributions to Shareholders |
|
|
|
|
|
|
|
|
|
|
|
| Net
Investment Income and Net Realized Gains: |
|
|
|
|
|
|
|
|
|
|
|
|
Class A
|
(22,125)
|
|
(3,905)
|
|
—
|
|
—
|
|
(3)
|
|
(1)
|
|
Class
C
|
(8,086)
|
|
(2,225)
|
|
—
|
|
—
|
|
—
|
|
—
|
|
Class
R
|
(23)
|
|
(7)
|
|
—
|
|
—
|
|
—
|
|
—
|
|
Class
P
|
(47,449)
|
|
(11,072)
|
|
(1)
|
|
(1)
|
|
—
|
|
—
|
|
Institutional
Class
|
(94,311)
|
|
(23,304)
|
|
(7)
|
|
(1)
|
|
(524)
|
|
(437)
|
|
Class
R6
|
—
|
|
—
|
|
(5,032)
|
|
(3,643)
|
|
—
|
|
—
|
|
Administrative
Class
|
(1,437)
|
|
(55)
|
|
—
|
|
—
|
|
—
|
|
—
|
|
Total dividends and distributions to
shareholders
|
(173,431)
|
|
(40,568)
|
|
(5,040)
|
|
(3,645)
|
|
(527)
|
|
(438)
|
| Change
in Net Assets from Capital Transactions (See Note 6): |
|
|
|
|
|
|
|
|
|
|
|
|
Class A
|
92,170
|
|
137,879
|
|
—
|
|
—
|
|
30
|
|
(8)
|
|
Class
C
|
7,742
|
|
26,863
|
|
—
|
|
—
|
|
—
|
|
—
|
|
Class
R
|
(318)
|
|
67
|
|
—
|
|
—
|
|
—
|
|
—
|
|
Class
P
|
158,447
|
|
284,708
|
|
1
|
|
1
|
|
—
|
|
—
|
|
Institutional
Class
|
393,391
|
|
451,431
|
|
1,631
|
|
27
|
|
(34,141)
|
|
(8,373)
|
|
Class
R6
|
—
|
|
—
|
|
5,729
|
|
(10,465)
|
|
—
|
|
—
|
|
Administrative
Class
|
8,952
|
|
11,822
|
|
—
|
|
—
|
|
—
|
|
—
|
|
Increase (decrease) in net assets from capital
transactions
|
660,384
|
|
912,770
|
|
7,361
|
|
(10,437)
|
|
(34,111)
|
|
(8,381)
|
|
Net increase (decrease) in net
assets
|
1,037,675
|
|
1,318,048
|
|
3,770
|
|
(9,007)
|
|
(31,686)
|
|
(3,737)
|
| Net
Assets |
|
|
|
|
|
|
|
|
|
|
|
|
Beginning of
period
|
1,974,521
|
|
656,473
|
|
50,434
|
|
59,441
|
|
35,511
|
|
39,248
|
|
End of
Period
|
$
3,012,196 |
|
$
1,974,521 |
|
$
54,204 |
|
$
50,434 |
|
$
3,825 |
|
$
35,511 |
See Notes to Financial Statements
VIRTUS STRATEGIC
TRUST
STATEMENTS OF CHANGES IN NET ASSETS (Continued)
($ reported in thousands)
| |
AllianzGI
Global Allocation Fund |
|
AllianzGI
Global Dynamic Allocation Fund |
|
AllianzGI
Global Sustainability Fund |
| |
Year
Ended
September 30,
2021 |
|
Year
Ended
September 30,
2020 |
|
Year
Ended
September 30,
2021 |
|
Year
Ended
September 30,
2020 |
|
Year
Ended
September 30,
2021 |
|
Year
Ended
September 30,
2020 |
| Increase
(Decrease) in Net Assets Resulting from Operations |
|
|
|
|
|
|
|
|
|
|
|
|
Net investment income (loss)
|
$
4,186 |
|
$
4,326 |
|
$
691 |
|
$
1,691 |
|
$
1,039 |
|
$
1,278 |
|
Net realized gain (loss)
|
21,653
|
|
21,915
|
|
10,361
|
|
9,397
|
|
21,591
|
|
3,487
|
|
Net increase from payment by
affiliate(1)
|
19
|
|
—
|
|
5
|
|
—
|
|
—
|
|
—
|
|
Net change in unrealized appreciation (depreciation)
|
14,994
|
|
3,684
|
|
79
|
|
35
|
|
11,560
|
|
22,095
|
|
Increase (decrease) in net assets resulting from
operations
|
40,852
|
|
29,925
|
|
11,136
|
|
11,123
|
|
34,190
|
|
26,860
|
| Dividends
and Distributions to Shareholders |
|
|
|
|
|
|
|
|
|
|
|
| Net
Investment Income and Net Realized Gains: |
|
|
|
|
|
|
|
|
|
|
|
|
Class A
|
(3,153)
|
|
(4,288)
|
|
(410)
|
|
(179)
|
|
(80)
|
|
(27)
|
|
Class
C
|
(169)
|
|
(444)
|
|
(143)
|
|
(64)
|
|
—
|
|
—
|
|
Class
R
|
(1)
|
|
(2)
|
|
(6)
|
|
(11)
|
|
—
|
|
—
|
|
Class
P
|
(403)
|
|
(674)
|
|
(19)
|
|
(5)
|
|
(1,011)
|
|
(491)
|
|
Institutional
Class
|
(739)
|
|
(587)
|
|
(3,319)
|
|
(1,011)
|
|
(4,100)
|
|
(2,565)
|
|
Class
R6
|
(16,125)
|
|
(24,244)
|
|
(8,451)
|
|
(11,996)
|
|
—
|
|
—
|
|
Administrative
Class
|
(2)
|
|
(2)
|
|
(7)
|
|
(2)
|
|
—
|
|
—
|
|
Total dividends and distributions to
shareholders
|
(20,592)
|
|
(30,241)
|
|
(12,355)
|
|
(13,268)
|
|
(5,191)
|
|
(3,083)
|
| Change
in Net Assets from Capital Transactions (See Note 6): |
|
|
|
|
|
|
|
|
|
|
|
|
Class A
|
(571)
|
|
(2,840)
|
|
2,159
|
|
(220)
|
|
2,234
|
|
600
|
|
Class
C
|
(1,274)
|
|
(2,756)
|
|
440
|
|
(42)
|
|
—
|
|
—
|
|
Class
R
|
(21)
|
|
2
|
|
(68)
|
|
(69)
|
|
—
|
|
—
|
|
Class
P
|
744
|
|
(795)
|
|
16,740
|
|
(11,732)
|
|
(26,093)
|
|
2,757
|
|
Institutional
Class
|
431
|
|
3,520
|
|
1,522
|
|
3,066
|
|
(42,410)
|
|
110,563
|
|
Class
R6
|
9,982
|
|
(57,148)
|
|
(8,304)
|
|
(94,041)
|
|
—
|
|
—
|
|
Administrative
Class
|
13
|
|
4
|
|
7
|
|
2
|
|
—
|
|
—
|
|
Increase (decrease) in net assets from capital
transactions
|
9,304
|
|
(60,013)
|
|
12,496
|
|
(103,036)
|
|
(66,269)
|
|
113,920
|
|
Net increase (decrease) in net
assets
|
29,564
|
|
(60,329)
|
|
11,277
|
|
(105,181)
|
|
(37,270)
|
|
137,697
|
| Net
Assets |
|
|
|
|
|
|
|
|
|
|
|
|
Beginning of
period
|
256,835
|
|
317,164
|
|
45,434
|
|
150,615
|
|
162,795
|
|
25,098
|
|
End of
Period
|
$
286,399 |
|
$
256,835 |
|
$
56,711 |
|
$
45,434 |
|
$
125,525 |
|
$
162,795 |
|
(1) |
See
Note 4G in Notes to Financial Statements. |
See Notes to Financial Statements
VIRTUS STRATEGIC
TRUST
STATEMENTS OF CHANGES IN NET ASSETS (Continued)
($ reported in thousands)
| |
AllianzGI
High Yield Bond Fund |
|
AllianzGI
International Small-Cap Fund |
|
AllianzGI
Preferred Securities and Income Fund |
| |
Year
Ended
September 30,
2021 |
|
Year
Ended
September 30,
2020 |
|
Year
Ended
September 30,
2021 |
|
Year
Ended
September 30,
2020 |
|
Year
Ended
September 30,
2021 |
|
Year
Ended
September 30,
2020 |
| Increase
(Decrease) in Net Assets Resulting from Operations |
|
|
|
|
|
|
|
|
|
|
|
|
Net investment income (loss)
|
$
3,836 |
|
$
5,555 |
|
$
595 |
|
$
570 |
|
$
981 |
|
$
954 |
|
Net realized gain (loss)
|
(2,022)
|
|
(3,056)
|
|
11,201
|
|
2,253
|
|
1,498
|
|
349
|
|
Net increase from payment by
affiliate(1)
|
—
|
|
—
|
|
—
|
|
—
|
|
4
|
|
—
|
|
Net change in unrealized appreciation (depreciation)
|
7,429
|
|
(3,143)
|
|
6,255
|
|
3,857
|
|
1,174
|
|
(690)
|
|
Increase (decrease) in net assets resulting from
operations
|
9,243
|
|
(644)
|
|
18,051
|
|
6,680
|
|
3,657
|
|
613
|
| Dividends
and Distributions to Shareholders |
|
|
|
|
|
|
|
|
|
|
|
| Net
Investment Income and Net Realized Gains: |
|
|
|
|
|
|
|
|
|
|
|
|
Class A
|
(1,000)
|
|
(1,141)
|
|
(43)
|
|
(68)
|
|
—
|
|
—
|
|
Class
C
|
(127)
|
|
(178)
|
|
(6)
|
|
(1)
|
|
—
|
|
—
|
|
Class
R
|
(9)
|
|
(33)
|
|
(12)
|
|
(20)
|
|
—
|
|
—
|
|
Class
P
|
(326)
|
|
(603)
|
|
(128)
|
|
(224)
|
|
(1)
|
|
(1)
|
|
Institutional
|
(2,439)
|
|
(4,000)
|
|
(499)
|
|
(629)
|
|
(363)
|
|
(290)
|
|
Class
R6
|
—
|
|
—
|
|
(431)
|
|
(690)
|
|
(856)
|
|
(1,120)
|
|
Administrative
Class
|
(5)
|
|
(1)
|
|
—
|
|
—
|
|
—
|
|
—
|
|
Total dividends and distributions to
shareholders
|
(3,906)
|
|
(5,956)
|
|
(1,119)
|
|
(1,632)
|
|
(1,220)
|
|
(1,411)
|
| Change
in Net Assets from Capital Transactions (See Note 6): |
|
|
|
|
|
|
|
|
|
|
|
|
Class A
|
(857)
|
|
(5,306)
|
|
458
|
|
(1,444)
|
|
—
|
|
—
|
|
Class
C
|
(1,861)
|
|
(758)
|
|
(495)
|
|
(296)
|
|
—
|
|
—
|
|
Class
R
|
(527)
|
|
(113)
|
|
(1,032)
|
|
(206)
|
|
—
|
|
—
|
|
Class
P
|
(6,426)
|
|
(1,274)
|
|
(2,178)
|
|
(9,573)
|
|
1
|
|
1
|
|
Institutional
|
(12,456)
|
|
(21,242)
|
|
(9,967)
|
|
(11,043)
|
|
(1,492)
|
|
4,359
|
|
Class
R6
|
—
|
|
—
|
|
(4,443)
|
|
(394)
|
|
(3,245)
|
|
4,258
|
|
Administrative
Class
|
83
|
|
3
|
|
—
|
|
—
|
|
—
|
|
—
|
|
Increase (decrease) in net assets from capital
transactions
|
(22,044)
|
|
(28,690)
|
|
(17,657)
|
|
(22,956)
|
|
(4,736)
|
|
8,618
|
|
Net increase (decrease) in net
assets
|
(16,707)
|
|
(35,290)
|
|
(725)
|
|
(17,908)
|
|
(2,299)
|
|
7,820
|
| Net
Assets |
|
|
|
|
|
|
|
|
|
|
|
|
Beginning of
period
|
86,698
|
|
121,988
|
|
77,772
|
|
95,680
|
|
25,512
|
|
17,692
|
|
End of
Period
|
$
69,991 |
|
$
86,698 |
|
$
77,047 |
|
$
77,772 |
|
$
23,213 |
|
$
25,512 |
|
(1) |
See
Note 4G in Notes to Financial Statements. |
See Notes to Financial Statements
VIRTUS STRATEGIC
TRUST
STATEMENTS OF CHANGES IN NET ASSETS (Continued)
($ reported in thousands)
| |
AllianzGI
Short Duration High Income Fund |
|
AllianzGI
Water Fund |
|
NFJ
Emerging Markets Value Fund |
| |
Year
Ended
September 30,
2021 |
|
Year
Ended
September 30,
2020 |
|
Year
Ended
September 30,
2021 |
|
Year
Ended
September 30,
2020 |
|
Year
Ended
September 30,
2021 |
|
Year
Ended
September 30,
2020 |
| Increase
(Decrease) in Net Assets Resulting from Operations |
|
|
|
|
|
|
|
|
|
|
|
|
Net investment income (loss)
|
$
34,430 |
|
$
48,272 |
|
$
12,242 |
|
$
3,027 |
|
$
737 |
|
$
1,321 |
|
Net realized gain (loss)
|
(2,872)
|
|
(45,704)
|
|
74,216
|
|
7,363
|
|
15,422
|
|
1,186
|
|
Net change in unrealized appreciation (depreciation)
|
49,267
|
|
(42,227)
|
|
125,391
|
|
58,381
|
|
1,043
|
|
18,437
|
|
Increase (decrease) in net assets resulting from
operations
|
80,825
|
|
(39,659)
|
|
211,849
|
|
68,771
|
|
17,202
|
|
20,944
|
| Dividends
and Distributions to Shareholders |
|
|
|
|
|
|
|
|
|
|
|
| Net
Investment Income and Net Realized Gains: |
|
|
|
|
|
|
|
|
|
|
|
|
Class A
|
(8,599)
|
|
(6,317)
|
|
(3,622)
|
|
(5,631)
|
|
(157)
|
|
(165)
|
|
Class
C
|
(4,603)
|
|
(4,670)
|
|
(945)
|
|
(1,776)
|
|
(1)
|
|
(6)
|
|
Class
P
|
(14,795)
|
|
(24,930)
|
|
(4,915)
|
|
(6,755)
|
|
(129)
|
|
(66)
|
|
Institutional
Class
|
(17,396)
|
|
(17,989)
|
|
(4,511)
|
|
(5,443)
|
|
(1,796)
|
|
(1,388)
|
|
Class
R6
|
(1,606)
|
|
(2,118)
|
|
—
|
|
—
|
|
—
|
|
—
|
|
Total dividends and distributions to
shareholders
|
(46,999)
|
|
(56,024)
|
|
(13,993)
|
|
(19,605)
|
|
(2,083)
|
|
(1,625)
|
| Change
in Net Assets from Capital Transactions (See Note 6): |
|
|
|
|
|
|
|
|
|
|
|
|
Class A
|
3,040
|
|
9,166
|
|
30,189
|
|
9,749
|
|
(1,008)
|
|
(1,390)
|
|
Class
C
|
(18,088)
|
|
(20,544)
|
|
(4,402)
|
|
(16,575)
|
|
(222)
|
|
(143)
|
|
Class
P
|
(28,217)
|
|
(182,217)
|
|
30,967
|
|
13,026
|
|
2,702
|
|
4,356
|
|
Institutional
Class
|
(45,650)
|
|
(76,766)
|
|
61,479
|
|
37,602
|
|
(5,859)
|
|
8,656
|
|
Class
R6
|
(14,092)
|
|
(4,370)
|
|
—
|
|
—
|
|
—
|
|
—
|
|
Increase (decrease) in net assets from capital
transactions
|
(103,007)
|
|
(274,731)
|
|
118,233
|
|
43,802
|
|
(4,387)
|
|
11,479
|
|
Net increase (decrease) in net
assets
|
(69,181)
|
|
(370,414)
|
|
316,089
|
|
92,968
|
|
10,732
|
|
30,798
|
| Net
Assets |
|
|
|
|
|
|
|
|
|
|
|
|
Beginning of
period
|
811,774
|
|
1,182,188
|
|
703,527
|
|
610,559
|
|
138,932
|
|
108,134
|
|
End of
Period
|
$
742,593 |
|
$
811,774 |
|
$
1,019,616 |
|
$
703,527 |
|
$
149,664 |
|
$
138,932 |
See Notes to Financial Statements
VIRTUS STRATEGY
TRUST
FINANCIAL HIGHLIGHTS
SELECTED PER SHARE DATA AND RATIOS FOR A SHARE OUTSTANDING
THROUGHOUT
EACH PERIOD
| |
|
Net
Asset Value,
Beginning of Period |
Net
Investment Income (Loss)(1) |
Capital
Gains Distributions
Received from Underlying Funds(1) |
Net
Realized and
Unrealized Gain (Loss) |
Total
from Investment Operations |
Dividends
from
Net Investment Income |
Distributions
from
Net Realized Gains |
Total
Distributions |
Payment
from Affiliate |
Change
in Net Asset Value |
Net
Asset Value, End of Period |
Total
Return(2)(3) |
Net
Assets, End of Period
(in thousands) |
Ratio
of Net Expenses to
Average Net Assets(4)(5) |
Ratio
of Gross Expenses
to Average Net Assets(4)(5) |
Ratio
of Net Investment Income (Loss)
to Average Net Assets(4) |
Portfolio
Turnover Rate(3) |
| |
|
|
|
|
|
|
|
|
|
|
|
|
|
|
|
|
|
|
| AllianzGI
Convertible Fund |
|
|
|
|
|
|
|
|
|
|
|
|
|
|
|
|
|
|
| Class
A |
|
|
|
|
|
|
|
|
|
|
|
|
|
|
|
|
|
|
| 10/1/20
to 9/30/21 |
|
$38.77
|
0.11
|
—
|
9.73
|
9.84
|
(0.20)
|
(2.67)
|
(2.87)
|
—
|
6.97
|
$45.74
|
25.71 %
|
$
396,378 |
0.95 %
(6) |
1.02 %
|
0.25 %
|
130 %
|
| 10/1/19
to 9/30/20 |
|
29.25
|
0.27
|
—
|
10.59
|
10.86
|
(0.43)
|
(0.91)
|
(1.34)
|
—
|
9.52
|
38.77
|
38.44
|
254,762
|
0.96
|
0.98
|
0.83
|
145
|
| 10/1/18
to 9/30/19 |
|
32.78
|
0.29
|
—
|
0.63
|
0.92
|
(0.90)
|
(3.55)
|
(4.45)
|
—
|
(3.53)
|
29.25
|
5.29
|
69,611
|
1.02
|
1.02
|
0.99
|
143
|
| 10/1/17
to 9/30/18 |
|
34.27
|
0.32
|
—
|
4.58
|
4.90
|
(1.30)
|
(5.09)
|
(6.39)
|
—
|
(1.49)
|
32.78
|
16.83
|
61,385
|
0.96
|
0.96
|
1.02
|
133
|
| 10/1/16
to 9/30/17 |
|
31.02
|
0.38
|
—
|
3.64
|
4.02
|
(0.77)
|
—
|
(0.77)
|
—
|
3.25
|
34.27
|
13.14
|
76,586
|
1.02
|
1.02
|
1.19
|
124
(7) |
| Class
C |
|
|
|
|
|
|
|
|
|
|
|
|
|
|
|
|
|
|
| 10/1/20
to 9/30/21 |
|
$39.39
|
(0.24)
|
—
|
9.88
|
9.64
|
—
(8) |
(2.67)
|
(2.67)
|
—
|
6.97
|
$46.36
|
24.75 %
|
$
141,138 |
1.72 %
(6) |
1.77 %
|
(0.52) %
|
130 %
|
| 10/1/19
to 9/30/20 |
|
29.61
|
0.02
|
—
|
10.77
|
10.79
|
(0.10)
|
(0.91)
|
(1.01)
|
—
|
9.78
|
39.39
|
37.40
|
112,523
|
1.73
|
1.74
|
0.06
|
145
|
| 10/1/18
to 9/30/19 |
|
32.95
|
0.08
|
—
|
0.67
|
0.75
|
(0.54)
|
(3.55)
|
(4.09)
|
—
|
(3.34)
|
29.61
|
4.53
|
60,434
|
1.75
|
1.75
|
0.26
|
143
|
| 10/1/17
to 9/30/18 |
|
34.36
|
0.08
|
—
|
4.59
|
4.67
|
(0.99)
|
(5.09)
|
(6.08)
|
—
|
(1.41)
|
32.95
|
15.90
|
53,461
|
1.73
|
1.73
|
0.24
|
133
|
| 10/1/16
to 9/30/17 |
|
31.19
|
0.17
|
—
|
3.65
|
3.82
|
(0.65)
|
—
|
(0.65)
|
—
|
3.17
|
34.36
|
12.41
|
48,905
|
1.69
|
1.69
|
0.51
|
124
(7) |
| Class
P |
|
|
|
|
|
|
|
|
|
|
|
|
|
|
|
|
|
|
| 10/1/20
to 9/30/21 |
|
$37.57
|
0.22
|
—
|
9.42
|
9.64
|
(0.31)
|
(2.67)
|
(2.98)
|
—
|
6.66
|
$44.23
|
26.03 %
|
$
808,844 |
0.69 %
(9) |
0.81 %
|
0.51 %
|
130 %
|
| 10/1/19
to 9/30/20 |
|
28.45
|
0.34
|
—
|
10.27
|
10.61
|
(0.58)
|
(0.91)
|
(1.49)
|
—
|
9.12
|
37.57
|
38.78
|
547,783
|
0.71
|
0.71
|
1.08
|
145
|
| 10/1/18
to 9/30/19 |
|
32.12
|
0.35
|
—
|
0.60
|
0.95
|
(1.07)
|
(3.55)
|
(4.62)
|
—
|
(3.67)
|
28.45
|
5.59
|
155,601
|
0.75
|
0.75
|
1.26
|
143
|
| 10/1/17
to 9/30/18 |
|
33.95
|
0.38
|
—
|
4.50
|
4.88
|
(1.62)
|
(5.09)
|
(6.71)
|
—
|
(1.83)
|
32.12
|
17.08
|
102,412
|
0.74
|
0.74
|
1.24
|
133
|
| 10/1/16
to 9/30/17 |
|
30.84
|
0.48
|
—
|
3.61
|
4.09
|
(0.98)
|
—
|
(0.98)
|
—
|
3.11
|
33.95
|
13.52
|
80,392
|
0.72
|
0.72
|
1.49
|
124
(7) |
| Institutional
Class |
|
|
|
|
|
|
|
|
|
|
|
|
|
|
|
|
|
|
| 10/1/20
to 9/30/21 |
|
$38.04
|
0.23
|
—
|
9.53
|
9.76
|
(0.32)
|
(2.67)
|
(2.99)
|
—
|
6.77
|
$44.81
|
26.02 %
|
$1,640,171
|
0.69 %
|
0.77 %
|
0.51 %
|
130 %
|
| 10/1/19
to 9/30/20 |
|
28.76
|
0.34
|
—
|
10.40
|
10.74
|
(0.55)
|
(0.91)
|
(1.46)
|
—
|
9.28
|
38.04
|
38.80
|
1,045,769
|
0.71
|
0.71
|
1.07
|
145
|
| 10/1/18
to 9/30/19 |
|
32.41
|
0.37
|
—
|
0.61
|
0.98
|
(1.08)
|
(3.55)
|
(4.63)
|
—
|
(3.65)
|
28.76
|
5.62
|
370,111
|
0.72
|
0.72
|
1.29
|
143
|
| 10/1/17
to 9/30/18 |
|
33.89
|
0.40
|
—
|
4.52
|
4.92
|
(1.31)
|
(5.09)
|
(6.40)
|
—
|
(1.48)
|
32.41
|
17.10
|
332,874
|
0.71
|
0.71
|
1.27
|
133
|
| 10/1/16
to 9/30/17 |
|
30.76
|
0.49
|
—
|
3.61
|
4.10
|
(0.97)
|
—
|
(0.97)
|
—
|
3.13
|
33.89
|
13.58
|
322,732
|
0.68
|
0.68
|
1.54
|
124
(7) |
| Administrative
Class |
|
|
|
|
|
|
|
|
|
|
|
|
|
|
|
|
|
|
| 10/1/20
to 9/30/21 |
|
$38.36
|
0.14
|
—
|
9.62
|
9.76
|
(0.30)
|
(2.67)
|
(2.97)
|
—
|
6.79
|
$45.15
|
25.79 %
|
$
25,665 |
0.91 %
|
0.97 %
|
0.31 %
|
130 %
|
| 10/1/19
to 9/30/20 |
|
28.95
|
0.35
|
—
|
10.42
|
10.77
|
(0.45)
|
(0.91)
|
(1.36)
|
—
|
9.41
|
38.36
|
38.50
|
13,386
|
0.93
|
0.93
|
0.99
|
145
|
| 10/1/18
to 9/30/19 |
|
32.46
|
0.30
|
—
|
0.61
|
0.91
|
(0.87)
|
(3.55)
|
(4.42)
|
—
|
(3.51)
|
28.95
|
5.29
|
550
|
0.97
|
0.97
|
1.03
|
143
|
| 10/1/17
to 9/30/18 |
|
34.08
|
0.33
|
—
|
4.54
|
4.87
|
(1.40)
|
(5.09)
|
(6.49)
|
—
|
(1.62)
|
32.46
|
16.88
|
997
|
0.93
|
0.93
|
1.05
|
133
|
| 10/1/16
to 9/30/17 |
|
30.96
|
0.42
|
—
|
3.62
|
4.04
|
(0.92)
|
—
|
(0.92)
|
—
|
3.12
|
34.08
|
13.30
|
1,240
|
0.89
|
0.89
|
1.32
|
124
(7) |
| |
|
|
|
|
|
|
|
|
|
|
|
|
|
|
|
|
|
|
| AllianzGI
Core Plus Bond Fund |
|
|
|
|
|
|
|
|
|
|
|
|
|
|
|
|
|
|
| Class
P |
|
|
|
|
|
|
|
|
|
|
|
|
|
|
|
|
|
|
| 10/1/20
to 9/30/21 |
|
$16.41
|
0.29
|
—
|
0.18
|
0.47
|
(0.45)
|
(1.08)
|
(1.53)
|
—
|
(1.06)
|
$15.35
|
2.89 %
|
$
12 |
0.35 %
|
0.67 %
|
1.83 %
|
361 %
|
| 10/1/19
to 9/30/20 |
|
16.00
|
0.39
|
—
|
1.00
|
1.39
|
(0.41)
|
(0.57)
|
(0.98)
|
—
|
0.41
|
16.41
|
9.18
|
12
|
0.35
|
0.73
|
2.46
|
552
|
| 10/1/18
to 9/30/19 |
|
14.92
|
0.46
|
—
|
1.06
|
1.52
|
(0.44)
|
—
|
(0.44)
|
—
|
1.08
|
16.00
|
10.39
|
11
|
0.35
|
0.93
|
3.01
|
864
|
| 5/30/18
(10) to 9/30/18 |
|
15.00
|
0.14
|
—
|
(0.11)
|
0.03
|
(0.11)
|
—
|
(0.11)
|
—
|
(0.08)
|
14.92
|
0.18
|
10
|
0.35
|
1.19
(11) |
2.81
(11) |
302
|
The footnote legend is at the end of the financial highlights.
See Notes to
Financial Statements
VIRTUS STRATEGY
TRUST
FINANCIAL HIGHLIGHTS (Continued)
SELECTED PER SHARE DATA AND RATIOS FOR A SHARE OUTSTANDING
THROUGHOUT EACH PERIOD
| |
|
Net
Asset Value,
Beginning of Period |
Net
Investment Income (Loss)(1) |
Capital
Gains Distributions
Received from Underlying Funds(1) |
Net
Realized and
Unrealized Gain (Loss) |
Total
from Investment Operations |
Dividends
from
Net Investment Income |
Distributions
from
Net Realized Gains |
Total
Distributions |
Payment
from Affiliate |
Change
in Net Asset Value |
Net
Asset Value, End of Period |
Total
Return(2)(3) |
Net
Assets, End of Period
(in thousands) |
Ratio
of Net Expenses to
Average Net Assets(4)(5) |
Ratio
of Gross Expenses
to Average Net Assets(4)(5) |
Ratio
of Net Investment Income (Loss)
to Average Net Assets(4) |
Portfolio
Turnover Rate(3) |
| AllianzGI
Core Plus Bond Fund (Continued) |
|
|
|
|
|
|
|
|
|
|
|
|
|
|
|
|
|
|
| Institutional
Class |
|
|
|
|
|
|
|
|
|
|
|
|
|
|
|
|
|
|
| 10/1/20
to 9/30/21 |
|
$16.41
|
0.04
|
—
|
0.43
|
0.47
|
(0.48)
|
(1.08)
|
(1.56)
|
—
|
(1.09)
|
$15.32
|
2.92 %
|
$
1,650 |
0.32 %
|
0.61 %
|
0.26 %
|
361 %
|
| 10/1/19
to 9/30/20 |
|
16.00
|
0.40
|
—
|
1.00
|
1.40
|
(0.42)
|
(0.57)
|
(0.99)
|
—
|
0.41
|
16.41
|
9.25
|
39
|
0.30
|
0.74
|
2.49
|
552
|
| 10/1/18
to 9/30/19 |
|
14.92
|
0.47
|
—
|
1.06
|
1.53
|
(0.45)
|
—
|
(0.45)
|
—
|
1.08
|
16.00
|
10.47
|
11
|
0.30
|
21.03
|
3.06
|
864
|
| 5/30/18
(10) to 9/30/18 |
|
15.00
|
0.14
|
—
|
(0.11)
|
0.03
|
(0.11)
|
—
|
(0.11)
|
—
|
(0.08)
|
14.92
|
0.20
|
10
|
0.30
|
1.19
(11) |
2.86
(11) |
302
|
| Class
R6 |
|
|
|
|
|
|
|
|
|
|
|
|
|
|
|
|
|
|
| 10/1/20
to 9/30/21 |
|
$16.41
|
0.30
|
—
|
0.17
|
0.47
|
(0.47)
|
(1.08)
|
(1.55)
|
—
|
(1.08)
|
$15.33
|
2.90 %
|
$
52,542 |
0.26 %
(6) |
0.67 %
|
1.93 %
|
361 %
|
| 10/1/19
to 9/30/20 |
|
16.00
|
0.41
|
—
|
1.00
|
1.41
|
(0.43)
|
(0.57)
|
(1.00)
|
—
|
0.41
|
16.41
|
9.28
|
50,383
|
0.25
|
0.76
|
2.56
|
552
|
| 10/1/18
to 9/30/19 |
|
14.92
|
0.48
|
—
|
1.07
|
1.55
|
(0.47)
|
—
|
(0.47)
|
—
|
1.08
|
16.00
|
10.56
|
59,419
|
0.25
|
0.94
|
3.11
|
864
|
| 5/30/18
(10) to 9/30/18 |
|
15.00
|
0.15
|
—
|
(0.12)
|
0.03
|
(0.11)
|
—
|
(0.11)
|
—
|
(0.08)
|
14.92
|
0.22
|
40,075
|
0.25
|
1.19
(11) |
2.91
(11) |
302
|
| |
|
|
|
|
|
|
|
|
|
|
|
|
|
|
|
|
|
|
| AllianzGI
Emerging Markets Consumer Fund |
|
|
|
|
|
|
|
|
|
|
|
|
|
|
|
|
|
|
| Class
A |
|
|
|
|
|
|
|
|
|
|
|
|
|
|
|
|
|
|
| 10/1/20
to 9/30/21 |
|
$15.88
|
0.14
|
—
|
0.88
|
1.02
|
(0.69)
|
—
|
(0.69)
|
—
|
0.33
|
$16.21
|
6.30 %
|
$
92 |
1.39 %
(12) |
2.28 %
|
0.80 %
|
65 %
|
| 10/1/19
to 9/30/20 |
|
13.51
|
0.12
|
—
|
2.35
|
2.47
|
(0.10)
|
—
|
(0.10)
|
—
|
2.37
|
15.88
|
18.34
|
63
|
1.40
|
1.81
|
0.86
|
57
|
| 10/1/18
to 9/30/19 |
|
13.88
|
0.12
|
—
|
(0.45)
|
(0.33)
|
(0.04)
|
—
|
(0.04)
|
—
|
(0.37)
|
13.51
|
(2.34)
|
62
|
1.52
|
1.75
|
0.90
|
82
|
| 10/1/17
to 9/30/18 |
|
15.76
|
0.11
|
—
|
(1.11)
|
(1.00)
|
(0.26)
|
(0.62)
|
(0.88)
|
—
|
(1.88)
|
13.88
|
(7.04)
|
69
|
1.55
|
1.78
|
0.68
|
115
|
| 10/1/16
to 9/30/17 |
|
13.60
|
0.21
|
—
|
2.07
|
2.28
|
(0.12)
|
—
|
(0.12)
|
—
|
2.16
|
15.76
|
16.97
|
155
|
1.55
|
16.84
|
1.47
|
122
|
| Institutional
Class |
|
|
|
|
|
|
|
|
|
|
|
|
|
|
|
|
|
|
| 10/1/20
to 9/30/21 |
|
$15.89
|
0.10
|
—
|
0.97
|
1.07
|
(0.56)
|
—
|
(0.56)
|
—
|
0.51
|
$16.40
|
6.63 %
|
$
3,733 |
1.05 %
(12) |
1.94 %
|
0.59 %
|
65 %
|
| 10/1/19
to 9/30/20 |
|
13.51
|
0.16
|
—
|
2.37
|
2.53
|
(0.15)
|
—
|
(0.15)
|
—
|
2.38
|
15.89
|
18.84
|
35,448
|
1.05
|
1.51
|
1.12
|
57
|
| 10/1/18
to 9/30/19 |
|
14.05
|
0.17
|
—
|
(0.48)
|
(0.31)
|
(0.23)
|
—
|
(0.23)
|
—
|
(0.54)
|
13.51
|
(2.05)
|
39,186
|
1.16
|
1.43
|
1.30
|
82
|
| 10/1/17
to 9/30/18 |
|
15.86
|
0.21
|
—
|
(1.17)
|
(0.96)
|
(0.23)
|
(0.62)
|
(0.85)
|
—
|
(1.81)
|
14.05
|
(6.69)
|
43,333
|
1.20
|
1.37
|
1.36
|
115
|
| 10/1/16
to 9/30/17 |
|
13.68
|
0.22
|
—
|
2.11
|
2.33
|
(0.15)
|
—
|
(0.15)
|
—
|
2.18
|
15.86
|
17.37
|
43,487
|
1.20
|
1.64
|
1.55
|
122
|
| |
|
|
|
|
|
|
|
|
|
|
|
|
|
|
|
|
|
|
| AllianzGI
Global Allocation Fund |
|
|
|
|
|
|
|
|
|
|
|
|
|
|
|
|
|
|
| Class
A |
|
|
|
|
|
|
|
|
|
|
|
|
|
|
|
|
|
|
| 10/1/20
to 9/30/21 |
|
$11.11
|
0.14
|
0.16
|
1.33
|
1.63
|
(0.22)
|
(0.53)
|
(0.75)
|
—
(8) |
0.88
|
$11.99
|
15.16 %
(13) |
$
49,743 |
0.56 %
(9) |
1.22 %
|
1.19 %
|
168 %
|
| 10/1/19
to 9/30/20 |
|
11.05
|
0.13
|
—
|
0.94
|
1.07
|
(0.12)
|
(0.89)
|
(1.01)
|
—
|
0.06
|
11.11
|
10.21
|
46,506
|
0.52
|
1.14
|
1.18
|
141
|
| 10/1/18
to 9/30/19 |
|
11.47
|
0.21
|
—
|
0.06
|
0.27
|
(0.25)
|
(0.44)
|
(0.69)
|
—
|
(0.42)
|
11.05
(14) |
3.05
(14) |
49,259
|
0.61
|
1.14
|
1.95
|
29
|
| 10/1/17
to 9/30/18 |
|
12.34
|
0.26
|
—
|
0.07
|
0.33
|
(0.55)
|
(0.65)
|
(1.20)
|
—
|
(0.87)
|
11.47
|
2.62
|
40,974
|
0.59
|
1.12
|
2.24
|
17
|
| 10/1/16
to 9/30/17 |
|
11.23
|
0.20
|
—
|
1.11
|
1.31
|
(0.20)
|
—
|
(0.20)
|
—
|
1.11
|
12.34
|
11.88
|
47,170
|
0.60
|
1.12
|
1.73
|
15
|
| Class
C |
|
|
|
|
|
|
|
|
|
|
|
|
|
|
|
|
|
|
| 10/1/20
to 9/30/21 |
|
$11.47
|
0.07
|
0.21
|
1.32
|
1.60
|
(0.04)
|
(0.53)
|
(0.57)
|
—
(8) |
1.03
|
$12.50
|
14.29 %
(13) |
$
2,558 |
1.31 %
(9) |
1.94 %
|
0.59 %
|
168 %
|
| 10/1/19
to 9/30/20 |
|
11.37
|
0.06
|
—
|
0.95
|
1.01
|
(0.02)
|
(0.89)
|
(0.91)
|
—
|
0.10
|
11.47
|
9.28
|
3,549
|
1.27
|
1.83
|
0.55
|
141
|
| 10/1/18
to 9/30/19 |
|
11.67
|
0.13
|
—
|
0.08
|
0.21
|
(0.07)
|
(0.44)
|
(0.51)
|
—
|
(0.30)
|
11.37
(14) |
2.29
(14) |
6,393
|
1.34
|
1.91
|
1.14
|
29
|
| 10/1/17
to 9/30/18 |
|
12.47
|
0.19
|
0.06
|
0.06
|
0.25
|
(0.40)
|
(0.65)
|
(1.05)
|
—
|
(0.80)
|
11.67
|
1.90
|
26,220
|
1.33
|
1.86
|
1.56
|
17
|
| 10/1/16
to 9/30/17 |
|
11.32
|
0.13
|
—
|
1.12
|
1.25
|
(0.10)
|
—
|
(0.10)
|
—
|
1.15
|
12.47
|
11.09
|
34,670
|
1.35
|
1.87
|
1.12
|
15
|
The footnote legend is at the end of the financial highlights.
See Notes to
Financial Statements
VIRTUS STRATEGY
TRUST
FINANCIAL HIGHLIGHTS (Continued)
SELECTED PER SHARE DATA AND RATIOS FOR A SHARE OUTSTANDING
THROUGHOUT EACH PERIOD
| |
|
Net
Asset Value,
Beginning of Period |
Net
Investment Income (Loss)(1) |
Capital
Gains Distributions
Received from Underlying Funds(1) |
Net
Realized and
Unrealized Gain (Loss) |
Total
from Investment Operations |
Dividends
from
Net Investment Income |
Distributions
from
Net Realized Gains |
Total
Distributions |
Payment
from Affiliate |
Change
in Net Asset Value |
Net
Asset Value, End of Period |
Total
Return(2)(3) |
Net
Assets, End of Period
(in thousands) |
Ratio
of Net Expenses to
Average Net Assets(4)(5) |
Ratio
of Gross Expenses
to Average Net Assets(4)(5) |
Ratio
of Net Investment Income (Loss)
to Average Net Assets(4) |
Portfolio
Turnover Rate(3) |
| AllianzGI
Global Allocation Fund (Continued) |
|
|
|
|
|
|
|
|
|
|
|
|
|
|
|
|
|
|
| Class
P |
|
|
|
|
|
|
|
|
|
|
|
|
|
|
|
|
|
|
| 10/1/20
to 9/30/21 |
|
$10.96
|
0.16
|
0.16
|
1.30
|
1.62
|
(0.26)
|
(0.53)
|
(0.79)
|
—
(8) |
0.83
|
$11.79
|
15.30 %
(13) |
$
6,536 |
0.36 %
(9) |
1.03 %
|
1.38 %
|
168 %
|
| 10/1/19
to 9/30/20 |
|
10.94
|
0.17
|
—
|
0.90
|
1.07
|
(0.16)
|
(0.89)
|
(1.05)
|
—
|
0.02
|
10.96
|
10.39
|
5,371
|
0.32
|
0.90
|
1.63
|
141
|
| 10/1/18
to 9/30/19 |
|
11.38
|
0.18
|
—
|
0.12
|
0.30
|
(0.30)
|
(0.44)
|
(0.74)
|
—
|
(0.44)
|
10.94
(14) |
3.30
(14) |
6,173
|
0.37
|
0.91
|
1.68
|
29
|
| 10/1/17
to 9/30/18 |
|
12.28
|
0.27
|
—
|
0.09
|
0.36
|
(0.61)
|
(0.65)
|
(1.26)
|
—
|
(0.90)
|
11.38
|
2.92
|
4,292
|
0.35
|
0.88
|
2.30
|
17
|
| 10/1/16
to 9/30/17 |
|
11.24
|
0.24
|
—
|
1.11
|
1.35
|
(0.31)
|
—
|
(0.31)
|
—
|
1.04
|
12.28
|
12.31
|
3,563
|
0.32
|
0.85
|
2.05
|
15
|
| Institutional
Class |
|
|
|
|
|
|
|
|
|
|
|
|
|
|
|
|
|
|
| 10/1/20
to 9/30/21 |
|
$11.05
|
0.17
|
0.16
|
1.32
|
1.65
|
(0.28)
|
(0.53)
|
(0.81)
|
—
(8) |
0.84
|
$11.89
|
15.46 %
(13) |
$
10,820 |
0.31 %
(9) |
0.86 %
|
1.43 %
|
168 %
|
| 10/1/19
to 9/30/20 |
|
11.02
|
0.14
|
—
|
0.94
|
1.08
|
(0.16)
|
(0.89)
|
(1.05)
|
—
|
0.03
|
11.05
|
10.40
|
9,609
|
0.29
|
0.88
|
1.28
|
141
|
| 10/1/18
to 9/30/19 |
|
11.45
|
0.24
|
—
|
0.06
|
0.30
|
(0.29)
|
(0.44)
|
(0.73)
|
—
|
(0.43)
|
11.02
(14) |
3.34
(14) |
6,026
|
0.36
|
0.89
|
2.25
|
29
|
| 10/1/17
to 9/30/18 |
|
12.15
|
0.28
|
—
|
0.08
|
0.36
|
(0.41)
|
(0.65)
|
(1.06)
|
—
|
(0.70)
|
11.45
|
2.92
|
6,652
|
0.33
|
0.86
|
2.43
|
17
|
| 10/1/16
to 9/30/17 |
|
11.11
|
0.26
|
—
|
1.05
|
1.31
|
(0.27)
|
—
|
(0.27)
|
—
|
1.04
|
12.15
|
12.08
|
6,871
|
0.40
|
0.95
|
2.35
|
15
|
| Class
R6 |
|
|
|
|
|
|
|
|
|
|
|
|
|
|
|
|
|
|
| 10/1/20
to 9/30/21 |
|
$10.79
|
0.17
|
0.16
|
1.28
|
1.61
|
(0.28)
|
(0.53)
|
(0.81)
|
—
(8) |
0.80
|
$11.59
|
15.46 %
(13) |
$
216,700 |
0.26 %
(9) |
0.91 %
|
1.50 %
|
168 %
|
| 10/1/19
to 9/30/20 |
|
10.78
|
0.16
|
—
|
0.92
|
1.08
|
(0.18)
|
(0.89)
|
(1.07)
|
—
|
0.01
|
10.79
|
10.57
|
191,750
|
0.22
|
0.83
|
1.52
|
141
|
| 10/1/18
to 9/30/19 |
|
11.23
|
0.23
|
—
|
0.06
|
0.29
|
(0.30)
|
(0.44)
|
(0.74)
|
—
|
(0.45)
|
10.78
(14) |
3.34
(14) |
249,269
|
0.28
|
0.82
|
2.23
|
29
|
| 10/1/17
to 9/30/18 |
|
12.13
|
0.29
|
—
|
0.07
|
0.36
|
(0.61)
|
(0.65)
|
(1.26)
|
—
|
(0.90)
|
11.23
|
2.95
|
252,313
|
0.28
|
0.81
|
2.48
|
17
|
| 10/1/16
to 9/30/17 |
|
11.10
|
0.23
|
—
|
1.11
|
1.34
|
(0.31)
|
—
|
(0.31)
|
—
|
1.03
|
12.13
|
12.40
|
264,255
|
0.28
|
0.80
|
1.99
|
15
|
| Administrative
Class |
|
|
|
|
|
|
|
|
|
|
|
|
|
|
|
|
|
|
| 10/1/20
to 9/30/21 |
|
$11.46
|
0.33
|
0.16
|
1.37
|
1.86
|
(0.37)
|
(0.53)
|
(0.90)
|
—
(8) |
0.96
|
$12.42
|
16.73 %
(13) |
$
42 |
0.47 %
(9) |
2.34 %
|
2.68 %
|
168 %
|
| 10/1/19
to 9/30/20 |
|
11.38
|
0.13
|
—
|
0.98
|
1.11
|
(0.14)
|
(0.89)
|
(1.03)
|
—
|
0.08
|
11.46
|
10.24
|
27
|
0.47
|
1.08
|
1.17
|
141
|
| 10/1/18
to 9/30/19 |
|
11.77
|
0.22
|
—
|
0.08
|
0.30
|
(0.25)
|
(0.44)
|
(0.69)
|
—
|
(0.39)
|
11.38
(14) |
3.17
(14) |
23
|
0.53
|
1.07
|
1.97
|
29
|
| 10/1/17
to 9/30/18 |
|
12.64
|
0.28
|
—
|
0.07
|
0.35
|
(0.57)
|
(0.65)
|
(1.22)
|
—
|
(0.87)
|
11.77
|
2.68
|
22
|
0.53
|
1.06
|
2.28
|
17
|
| 10/1/16
to 9/30/17 |
|
11.52
|
0.22
|
—
|
1.15
|
1.37
|
(0.25)
|
—
|
(0.25)
|
—
|
1.12
|
12.64
|
12.07
|
26
|
0.53
|
1.06
|
1.86
|
15
|
| |
|
|
|
|
|
|
|
|
|
|
|
|
|
|
|
|
|
|
| AllianzGI
Global Dynamic Allocation Fund |
|
|
|
|
|
|
|
|
|
|
|
|
|
|
|
|
|
|
| Class
A |
|
|
|
|
|
|
|
|
|
|
|
|
|
|
|
|
|
|
| 10/1/20
to 9/30/21 |
|
$18.74
|
0.19
|
0.96
|
2.86
|
4.01
|
(1.74)
|
(3.55)
|
(5.29)
|
—
(8) |
(1.28)
|
$17.46
|
25.22 %
(13) |
$
3,648 |
0.84 %
(9) |
1.75 %
|
1.06 %
|
206 %
|
| 10/1/19
to 9/30/20 |
|
19.21
|
0.21
|
—
|
1.34
|
1.55
|
(0.72)
|
(1.30)
|
(2.02)
|
—
|
(0.47)
|
18.74
|
8.20
|
1,491
|
0.82
|
1.62
|
1.17
|
221
|
| 10/1/18
to 9/30/19 |
|
20.19
|
0.34
|
—
|
(0.48)
|
(0.14)
|
(0.36)
|
(0.48)
|
(0.84)
|
—
|
(0.98)
|
19.21
|
(0.25)
|
1,812
|
0.97
|
1.32
|
1.78
|
222
|
| 10/1/17
to 9/30/18 |
|
20.52
|
0.28
|
—
|
0.32
|
0.60
|
(0.21)
|
(0.72)
|
(0.93)
|
—
|
(0.33)
|
20.19
|
2.93
|
2,015
|
0.97
|
1.25
|
1.37
|
152
|
| 10/1/16
to 9/30/17 |
|
18.32
|
0.20
|
—
|
2.00
|
2.20
|
—
|
—
|
—
|
—
|
2.20
|
20.52
|
12.01
|
2,421
|
1.02
|
1.35
|
1.05
|
192
|
| Class
C |
|
|
|
|
|
|
|
|
|
|
|
|
|
|
|
|
|
|
| 10/1/20
to 9/30/21 |
|
$18.32
|
0.05
|
1.22
|
2.52
|
3.79
|
(1.56)
|
(3.55)
|
(5.11)
|
—
(8) |
(1.32)
|
$17.00
|
24.29 %
(13) |
$
944 |
1.61 %
(9) |
2.52 %
|
0.31 %
|
206 %
|
| 10/1/19
to 9/30/20 |
|
18.84
|
0.07
|
—
|
1.30
|
1.37
|
(0.59)
|
(1.30)
|
(1.89)
|
—
|
(0.52)
|
18.32
|
7.37
|
525
|
1.58
|
2.38
|
0.40
|
221
|
| 10/1/18
to 9/30/19 |
|
19.56
|
0.19
|
—
|
(0.43)
|
(0.24)
|
—
|
(0.48)
|
(0.48)
|
—
|
(0.72)
|
18.84
|
(1.00)
|
588
|
1.74
|
2.08
|
1.00
|
222
|
| 10/1/17
to 9/30/18 |
|
20.05
|
0.12
|
—
|
0.31
|
0.43
|
(0.20)
|
(0.72)
|
(0.92)
|
—
|
(0.49)
|
19.56
|
2.09
|
1,195
|
1.74
|
2.01
|
0.61
|
152
|
| 10/1/16
to 9/30/17 |
|
18.05
|
0.08
|
—
|
1.92
|
2.00
|
—
|
—
|
—
|
—
|
2.00
|
20.05
|
11.08
|
1,325
|
1.77
|
2.08
|
0.42
|
192
|
The footnote legend is at the end of the financial highlights.
See Notes to
Financial Statements
VIRTUS STRATEGY
TRUST
FINANCIAL HIGHLIGHTS (Continued)
SELECTED PER SHARE DATA AND RATIOS FOR A SHARE OUTSTANDING
THROUGHOUT EACH PERIOD
| |
|
Net
Asset Value,
Beginning of Period |
Net
Investment Income (Loss)(1) |
Capital
Gains Distributions
Received from Underlying Funds(1) |
Net
Realized and
Unrealized Gain (Loss) |
Total
from Investment Operations |
Dividends
from
Net Investment Income |
Distributions
from
Net Realized Gains |
Total
Distributions |
Payment
from Affiliate |
Change
in Net Asset Value |
Net
Asset Value, End of Period |
Total
Return(2)(3) |
Net
Assets, End of Period
(in thousands) |
Ratio
of Net Expenses to
Average Net Assets(4)(5) |
Ratio
of Gross Expenses
to Average Net Assets(4)(5) |
Ratio
of Net Investment Income (Loss)
to Average Net Assets(4) |
Portfolio
Turnover Rate(3) |
| AllianzGI
Global Dynamic Allocation Fund (Continued) |
|
|
|
|
|
|
|
|
|
|
|
|
|
|
|
|
|
|
| Class
P |
|
|
|
|
|
|
|
|
|
|
|
|
|
|
|
|
|
|
| 10/1/20
to 9/30/21 |
|
$19.61
|
0.19
|
0.08
|
3.93
|
4.20
|
(2.18)
|
(3.55)
|
(5.73)
|
—
(8) |
(1.53)
|
$18.08
|
25.45 %
(13) |
$
16,310 |
0.66 %
(9) |
1.52 %
|
1.01 %
|
206 %
|
| 10/1/19
to 9/30/20 |
|
19.09
|
0.21
|
—
|
1.61
|
1.82
|
—
|
(1.30)
|
(1.30)
|
—
|
0.52
|
19.61
|
9.73
|
59
|
0.68
|
1.19
|
1.05
|
221
|
| 10/1/18
to 9/30/19 |
|
20.07
|
0.36
|
—
|
(0.46)
|
(0.10)
|
(0.40)
|
(0.48)
|
(0.88)
|
—
|
(0.98)
|
19.09
|
(0.05)
|
11,456
|
0.80
|
1.12
|
1.95
|
222
|
| 10/1/17
to 9/30/18 |
|
20.48
|
0.32
|
—
|
0.31
|
0.63
|
(0.32)
|
(0.72)
|
(1.04)
|
—
|
(0.41)
|
20.07
|
3.08
|
13,436
|
0.80
|
1.03
|
1.58
|
152
|
| 10/1/16
to 9/30/17 |
|
18.36
|
0.28
|
—
|
1.94
|
2.22
|
(0.10)
|
—
|
(0.10)
|
—
|
2.12
|
20.48
|
12.18
|
12,730
|
0.82
|
1.11
|
1.44
|
192
|
| Institutional
Class |
|
|
|
|
|
|
|
|
|
|
|
|
|
|
|
|
|
|
| 10/1/20
to 9/30/21 |
|
$19.05
|
0.25
|
1.51
|
2.37
|
4.13
|
(1.78)
|
(3.55)
|
(5.33)
|
—
(8) |
(1.20)
|
$17.85
|
25.59 %
(13) |
$
13,464 |
0.58 %
(9) |
1.56 %
|
1.39 %
|
206 %
|
| 10/1/19
to 9/30/20 |
|
19.50
|
0.26
|
—
|
1.37
|
1.63
|
(0.78)
|
(1.30)
|
(2.08)
|
—
|
(0.45)
|
19.05
|
8.52
|
12,294
|
0.54
|
1.40
|
1.42
|
221
|
| 10/1/18
to 9/30/19 |
|
20.22
|
0.39
|
—
|
(0.45)
|
(0.06)
|
(0.18)
|
(0.48)
|
(0.66)
|
—
|
(0.72)
|
19.50
|
0.03
|
9,330
|
0.70
|
1.12
|
2.05
|
222
|
| 10/1/17
to 9/30/18 |
|
20.61
|
0.34
|
—
|
0.32
|
0.66
|
(0.33)
|
(0.72)
|
(1.05)
|
—
|
(0.39)
|
20.22
|
3.18
|
13,225
|
0.70
|
0.94
|
1.65
|
152
|
| 10/1/16
to 9/30/17 |
|
18.37
|
0.27
|
—
|
1.98
|
2.25
|
(0.01)
|
—
|
(0.01)
|
—
|
2.24
|
20.61
|
12.27
|
31,783
|
0.75
|
1.03
|
1.42
|
192
|
| Class
R6 |
|
|
|
|
|
|
|
|
|
|
|
|
|
|
|
|
|
|
| 10/1/20
to 9/30/21 |
|
$18.75
|
0.25
|
1.50
|
2.33
|
4.08
|
(1.63)
|
(3.55)
|
(5.18)
|
—
(8) |
(1.10)
|
$17.65
|
25.61 %
(13) |
$
22,314 |
0.58 %
(6)(9) |
1.48 %
|
1.40 %
|
206 %
|
| 10/1/19
to 9/30/20 |
|
19.18
|
0.27
|
—
|
1.33
|
1.60
|
(0.73)
|
(1.30)
|
(2.03)
|
—
|
(0.43)
|
18.75
|
8.54
|
30,996
|
0.54
|
1.28
|
1.45
|
221
|
| 10/1/18
to 9/30/19 |
|
20.15
|
0.39
|
—
|
(0.48)
|
(0.09)
|
(0.40)
|
(0.48)
|
(0.88)
|
—
|
(0.97)
|
19.18
|
(0.01)
|
127,285
|
0.70
|
1.01
|
2.08
|
222
|
| 10/1/17
to 9/30/18 |
|
20.56
|
0.34
|
—
|
0.32
|
0.66
|
(0.35)
|
(0.72)
|
(1.07)
|
—
|
(0.41)
|
20.15
|
3.19
|
192,375
|
0.70
|
0.91
|
1.67
|
152
|
| 10/1/16
to 9/30/17 |
|
18.38
|
0.28
|
—
|
1.99
|
2.27
|
(0.09)
|
—
|
(0.09)
|
—
|
2.18
|
20.56
|
12.39
|
231,584
|
0.70
|
0.99
|
1.49
|
192
|
| Administrative
Class |
|
|
|
|
|
|
|
|
|
|
|
|
|
|
|
|
|
|
| 10/1/20
to 9/30/21 |
|
$18.67
|
0.20
|
1.37
|
2.43
|
4.00
|
(1.74)
|
(3.55)
|
(5.29)
|
—
(8) |
(1.29)
|
$17.38
|
25.27 %
(13) |
$
31 |
0.82 %
(9) |
1.71 %
|
1.13 %
|
206 %
|
| 10/1/19
to 9/30/20 |
|
19.16
|
0.21
|
—
|
1.34
|
1.55
|
(0.74)
|
(1.30)
|
(2.04)
|
—
|
(0.49)
|
18.67
|
8.24
|
25
|
0.79
|
1.57
|
1.18
|
221
|
| 10/1/18
to 9/30/19 |
|
20.15
|
0.34
|
—
|
(0.48)
|
(0.14)
|
(0.37)
|
(0.48)
|
(0.85)
|
—
|
(0.99)
|
19.16
|
(0.26)
|
23
|
0.95
|
1.27
|
1.80
|
222
|
| 10/1/17
to 9/30/18 |
|
20.55
|
0.29
|
—
|
0.32
|
0.61
|
(0.29)
|
(0.72)
|
(1.01)
|
—
|
(0.40)
|
20.15
|
2.93
|
23
|
0.96
|
1.17
|
1.42
|
152
|
| 10/1/16
to 9/30/17 |
|
18.35
|
0.23
|
—
|
1.97
|
2.20
|
—
|
—
|
—
|
—
|
2.20
|
20.55
|
11.99
|
23
|
1.00
|
1.25
|
1.18
|
192
|
| |
|
|
|
|
|
|
|
|
|
|
|
|
|
|
|
|
|
|
| AllianzGI
Global Sustainability Fund |
|
|
|
|
|
|
|
|
|
|
|
|
|
|
|
|
|
|
| Class
A |
|
|
|
|
|
|
|
|
|
|
|
|
|
|
|
|
|
|
| 10/1/20
to 9/30/21 |
|
$21.06
|
0.13
|
—
|
4.97
|
5.10
|
(0.16)
|
(0.50)
|
(0.66)
|
—
|
4.44
|
$25.50
|
24.61 %
|
$
5,305 |
0.94 %
|
1.37 %
|
0.54 %
|
30 %
|
| 10/1/19
to 9/30/20 |
|
18.27
|
0.11
|
—
|
3.03
|
3.14
|
(0.02)
|
(0.33)
|
(0.35)
|
—
|
2.79
|
21.06
|
17.35
|
2,350
|
0.98
|
1.44
|
0.58
|
31
|
| 10/1/18
to 9/30/19 |
|
19.46
|
0.14
|
—
|
0.04
|
0.18
|
(0.30)
|
(1.07)
|
(1.37)
|
—
|
(1.19)
|
18.27
|
2.43
|
1,444
|
1.09
|
1.84
|
0.77
|
49
|
| 10/1/17
to 9/30/18 |
|
17.96
|
0.17
|
—
|
1.98
|
2.15
|
(0.21)
|
(0.44)
|
(0.65)
|
—
|
1.50
|
19.46
|
12.23
|
614
|
1.09
|
1.70
|
0.92
|
20
|
| 10/1/16
to 9/30/17 |
|
15.80
|
0.13
|
—
|
2.20
|
2.33
|
(0.14)
|
(0.03)
|
(0.17)
|
—
|
2.16
|
17.96
|
14.94
|
402
|
1.12
|
7.55
|
0.79
|
27
|
| Class
P |
|
|
|
|
|
|
|
|
|
|
|
|
|
|
|
|
|
|
| 10/1/20
to 9/30/21 |
|
$21.22
|
0.10
|
—
|
5.07
|
5.17
|
(0.17)
|
(0.50)
|
(0.67)
|
—
|
4.50
|
$25.72
|
24.78 %
|
$
5,336 |
0.79 %
|
1.17 %
|
0.44 %
|
30 %
|
| 10/1/19
to 9/30/20 |
|
18.39
|
0.14
|
—
|
3.05
|
3.19
|
(0.03)
|
(0.33)
|
(0.36)
|
—
|
2.83
|
21.22
|
17.52
|
28,372
|
0.84
|
1.13
|
0.74
|
31
|
| 10/1/18
to 9/30/19 |
|
19.68
|
0.21
|
—
|
(0.02)
|
0.19
|
(0.41)
|
(1.07)
|
(1.48)
|
—
|
(1.29)
|
18.39
|
2.56
|
21,582
|
0.94
|
1.65
|
1.17
|
49
|
| 10/1/17
to 9/30/18 |
|
18.13
|
0.16
|
—
|
2.05
|
2.21
|
(0.22)
|
(0.44)
|
(0.66)
|
—
|
1.55
|
19.68
|
12.44
|
11,362
|
0.94
|
1.25
|
0.84
|
20
|
| 10/1/16
to 9/30/17 |
|
15.91
|
0.15
|
—
|
2.23
|
2.38
|
(0.13)
|
(0.03)
|
(0.16)
|
—
|
2.22
|
18.13
|
15.13
|
64
|
0.96
|
1.62
|
0.88
|
27
|
The footnote legend is at the end of the financial highlights.
See Notes to
Financial Statements
VIRTUS STRATEGY
TRUST
FINANCIAL HIGHLIGHTS (Continued)
SELECTED PER SHARE DATA AND RATIOS FOR A SHARE OUTSTANDING
THROUGHOUT EACH PERIOD
| |
|
Net
Asset Value,
Beginning of Period |
Net
Investment Income (Loss)(1) |
Capital
Gains Distributions
Received from Underlying Funds(1) |
Net
Realized and
Unrealized Gain (Loss) |
Total
from Investment Operations |
Dividends
from
Net Investment Income |
Distributions
from
Net Realized Gains |
Total
Distributions |
Payment
from Affiliate |
Change
in Net Asset Value |
Net
Asset Value, End of Period |
Total
Return(2)(3) |
Net
Assets, End of Period
(in thousands) |
Ratio
of Net Expenses to
Average Net Assets(4)(5) |
Ratio
of Gross Expenses
to Average Net Assets(4)(5) |
Ratio
of Net Investment Income (Loss)
to Average Net Assets(4) |
Portfolio
Turnover Rate(3) |
| AllianzGI
Global Sustainability Fund (Continued) |
|
|
|
|
|
|
|
|
|
|
|
|
|
|
|
|
|
|
| Institutional
Class |
|
|
|
|
|
|
|
|
|
|
|
|
|
|
|
|
|
|
| 10/1/20
to 9/30/21 |
|
$21.64
|
0.18
|
—
|
5.13
|
5.31
|
(0.17)
|
(0.50)
|
(0.67)
|
—
|
4.64
|
$26.28
|
24.95 %
|
$
114,884 |
0.69 %
|
1.09 %
|
0.72 %
|
30 %
|
| 10/1/19
to 9/30/20 |
|
18.75
|
0.17
|
—
|
3.10
|
3.27
|
(0.05)
|
(0.33)
|
(0.38)
|
—
|
2.89
|
21.64
|
17.59
|
132,073
|
0.74
|
1.03
|
0.88
|
31
|
| 10/1/18
to 9/30/19 |
|
19.72
|
0.19
|
—
|
0.06
|
0.25
|
(0.15)
|
(1.07)
|
(1.22)
|
—
|
(0.97)
|
18.75
|
2.63
|
2,072
|
0.84
|
1.66
|
1.05
|
49
|
| 10/1/17
to 9/30/18 |
|
18.13
|
0.22
|
—
|
2.00
|
2.22
|
(0.19)
|
(0.44)
|
(0.63)
|
—
|
1.59
|
19.72
|
12.52
|
28,237
|
0.84
|
1.43
|
1.18
|
20
|
| 10/1/16
to 9/30/17 |
|
15.92
|
0.19
|
—
|
2.20
|
2.39
|
(0.15)
|
(0.03)
|
(0.18)
|
—
|
2.21
|
18.13
|
15.25
|
26,615
|
0.89
|
1.63
|
1.16
|
27
|
| |
|
|
|
|
|
|
|
|
|
|
|
|
|
|
|
|
|
|
| AllianzGI
High Yield Bond Fund |
|
|
|
|
|
|
|
|
|
|
|
|
|
|
|
|
|
|
| Class
A |
|
|
|
|
|
|
|
|
|
|
|
|
|
|
|
|
|
|
| 10/1/20
to 9/30/21 |
|
$
8.39 |
0.43
|
—
|
0.58
|
1.01
|
(0.43)
|
—
|
(0.43)
|
—
|
0.58
|
$
8.97 |
12.20 %
|
$
20,763 |
1.13 %
(6) |
1.14 %
|
4.93 %
|
153 %
|
| 10/1/19
to 9/30/20 |
|
8.91
|
0.42
|
—
|
(0.50)
|
(0.08)
|
(0.44)
|
—
|
(0.44)
|
—
|
(0.52)
|
8.39
|
(0.82)
|
20,251
|
1.12
|
1.12
|
4.96
|
143
|
| 10/1/18
to 9/30/19 |
|
8.91
|
0.43
|
—
|
0.01
|
0.44
|
(0.44)
|
—
|
(0.44)
|
—
|
—
|
8.91
|
5.18
|
26,937
|
1.07
|
1.07
|
4.98
|
70
|
| 10/1/17
to 9/30/18 |
|
9.31
|
0.45
|
—
|
(0.39)
|
0.06
|
(0.46)
|
—
|
(0.46)
|
—
|
(0.40)
|
8.91
|
0.67
|
33,768
|
1.05
|
1.05
|
4.93
|
40
|
| 10/1/16
to 9/30/17 |
|
9.14
|
0.48
|
—
|
0.18
|
0.66
|
(0.49)
|
—
|
(0.49)
|
—
|
0.17
|
9.31
|
7.42
|
58,525
|
1.09
|
1.09
|
5.19
|
37
|
| Class
C |
|
|
|
|
|
|
|
|
|
|
|
|
|
|
|
|
|
|
| 10/1/20
to 9/30/21 |
|
$
8.38 |
0.37
|
—
|
0.56
|
0.93
|
(0.36)
|
—
|
(0.36)
|
—
|
0.57
|
$
8.95 |
11.32 %
|
$
2,255 |
1.86 %
(6) |
1.89 %
|
4.21 %
|
153 %
|
| 10/1/19
to 9/30/20 |
|
8.89
|
0.36
|
—
|
(0.49)
|
(0.13)
|
(0.38)
|
—
|
(0.38)
|
—
|
(0.51)
|
8.38
|
(1.41)
|
3,880
|
1.81
|
1.81
|
4.26
|
143
|
| 10/1/18
to 9/30/19 |
|
8.90
|
0.37
|
—
|
—
|
0.37
|
(0.38)
|
—
|
(0.38)
|
—
|
(0.01)
|
8.89
|
4.33
|
4,880
|
1.76
|
1.76
|
4.28
|
70
|
| 10/1/17
to 9/30/18 |
|
9.30
|
0.39
|
—
|
(0.39)
|
—
|
(0.40)
|
—
|
(0.40)
|
—
|
(0.40)
|
8.90
|
0.02
|
8,544
|
1.71
|
1.71
|
4.27
|
40
|
| 10/1/16
to 9/30/17 |
|
9.12
|
0.42
|
—
|
0.20
|
0.62
|
(0.44)
|
—
|
(0.44)
|
—
|
0.18
|
9.30
|
6.90
|
11,723
|
1.70
|
1.70
|
4.59
|
37
|
| Class
P |
|
|
|
|
|
|
|
|
|
|
|
|
|
|
|
|
|
|
| 10/1/20
to 9/30/21 |
|
$
8.01 |
0.44
|
—
|
0.54
|
0.98
|
(0.45)
|
—
|
(0.45)
|
—
|
0.53
|
$
8.54 |
12.47 %
|
$
4,196 |
0.85 %
|
0.95 %
|
5.20 %
|
153 %
|
| 10/1/19
to 9/30/20 |
|
8.53
|
0.43
|
—
|
(0.48)
|
(0.05)
|
(0.47)
|
—
|
(0.47)
|
—
|
(0.52)
|
8.01
|
(0.46)
|
10,113
|
0.80
|
0.80
|
5.28
|
143
|
| 10/1/18
to 9/30/19 |
|
8.55
|
0.44
|
—
|
0.01
|
0.45
|
(0.47)
|
—
|
(0.47)
|
—
|
(0.02)
|
8.53
|
5.56
|
12,128
|
0.73
|
0.73
|
5.31
|
70
|
| 10/1/17
to 9/30/18 |
|
8.96
|
0.46
|
—
|
(0.38)
|
0.08
|
(0.49)
|
—
|
(0.49)
|
—
|
(0.41)
|
8.55
|
0.94
|
17,535
|
0.70
|
0.70
|
5.26
|
40
|
| 10/1/16
to 9/30/17 |
|
8.80
|
0.50
|
—
|
0.19
|
0.69
|
(0.53)
|
—
|
(0.53)
|
—
|
0.16
|
8.96
|
8.07
|
35,931
|
0.67
|
0.67
|
5.62
|
37
|
| Institutional
|
|
|
|
|
|
|
|
|
|
|
|
|
|
|
|
|
|
|
| 10/1/20
to 9/30/21 |
|
$
8.04 |
0.44
|
—
|
0.54
|
0.98
|
(0.45)
|
—
|
(0.45)
|
—
|
0.53
|
$
8.57 |
12.43 %
|
$
42,666 |
0.87 %
|
0.88 %
|
5.19 %
|
153 %
|
| 10/1/19
to 9/30/20 |
|
8.56
|
0.43
|
—
|
(0.48)
|
(0.05)
|
(0.47)
|
—
|
(0.47)
|
—
|
(0.52)
|
8.04
|
(0.50)
|
51,920
|
0.83
|
0.83
|
5.22
|
143
|
| 10/1/18
to 9/30/19 |
|
8.58
|
0.44
|
—
|
0.01
|
0.45
|
(0.47)
|
—
|
(0.47)
|
—
|
(0.02)
|
8.56
|
5.48
|
77,365
|
0.79
|
0.79
|
5.25
|
70
|
| 10/1/17
to 9/30/18 |
|
8.98
|
0.46
|
—
|
(0.37)
|
0.09
|
(0.49)
|
—
|
(0.49)
|
—
|
(0.400)
|
8.58
|
1.03
|
122,078
|
0.73
|
0.73
|
5.26
|
40
|
| 10/1/16
to 9/30/17 |
|
8.83
|
0.50
|
—
|
0.18
|
0.68
|
(0.53)
|
—
|
(0.53)
|
—
|
0.15
|
8.98
|
7.91
|
155,022
|
0.69
|
0.69
|
5.61
|
37
|
| Administrative
Class |
|
|
|
|
|
|
|
|
|
|
|
|
|
|
|
|
|
|
| 10/1/20
to 9/30/21 |
|
$
8.02 |
0.74
|
—
|
0.40
|
1.14
|
(0.64)
|
—
|
(0.64)
|
—
|
0.50
|
$
8.52 |
14.60 %
|
$
111 |
1.00 %
|
2.16 %
|
8.73 %
|
153 %
|
| 10/1/19
to 9/30/20 |
|
8.54
|
0.42
|
—
|
(0.48)
|
(0.06)
|
(0.46)
|
—
|
(0.46)
|
—
|
(0.52)
|
8.02
|
(0.63)
|
26
|
1.00
|
1.00
|
5.14
|
143
|
| 10/1/18
to 9/30/19 |
|
8.44
|
0.43
|
—
|
0.03
|
0.46
|
(0.36)
|
—
|
(0.36)
|
—
|
0.10
|
8.54
|
5.60
|
24
|
0.94
|
0.94
|
5.10
|
70
|
| 10/1/17
to 9/30/18 |
|
8.84
|
0.44
|
—
|
(0.37)
|
0.07
|
(0.47)
|
—
|
(0.47)
|
—
|
(0.40)
|
8.44
|
0.83
|
20
|
0.88
|
0.88
|
4.93
|
40
|
| 10/1/16
to 9/30/17 |
|
8.70
|
0.48
|
—
|
0.17
|
0.65
|
(0.51)
|
—
|
(0.51)
|
—
|
0.14
|
8.84
|
7.75
|
1,490
|
0.86
|
0.86
|
5.45
|
37
|
The footnote legend is at the end of the financial highlights.
See Notes to
Financial Statements
VIRTUS STRATEGY
TRUST
FINANCIAL HIGHLIGHTS (Continued)
SELECTED PER SHARE DATA AND RATIOS FOR A SHARE OUTSTANDING
THROUGHOUT EACH PERIOD
| |
|
Net
Asset Value,
Beginning of Period |
Net
Investment Income (Loss)(1) |
Capital
Gains Distributions
Received from Underlying Funds(1) |
Net
Realized and
Unrealized Gain (Loss) |
Total
from Investment Operations |
Dividends
from
Net Investment Income |
Distributions
from
Net Realized Gains |
Total
Distributions |
Payment
from Affiliate |
Change
in Net Asset Value |
Net
Asset Value, End of Period |
Total
Return(2)(3) |
Net
Assets, End of Period
(in thousands) |
Ratio
of Net Expenses to
Average Net Assets(4)(5) |
Ratio
of Gross Expenses
to Average Net Assets(4)(5) |
Ratio
of Net Investment Income (Loss)
to Average Net Assets(4) |
Portfolio
Turnover Rate(3) |
| |
|
|
|
|
|
|
|
|
|
|
|
|
|
|
|
|
|
|
| AllianzGI
International Small-Cap Fund |
|
|
|
|
|
|
|
|
|
|
|
|
|
|
|
|
|
|
| Class
A |
|
|
|
|
|
|
|
|
|
|
|
|
|
|
|
|
|
|
| 10/1/20
to 9/30/21 |
|
$34.36
|
0.22
|
—
|
7.76
|
7.98
|
(0.30)
|
(0.13)
|
(0.43)
|
—
|
7.55
|
$41.91
|
23.32 %
|
$
4,853 |
1.25 %
|
1.77 %
|
0.54 %
|
51 %
|
| 10/1/19
to 9/30/20 |
|
32.15
|
0.15
|
—
|
2.54
|
2.69
|
(0.48)
|
—
|
(0.48)
|
—
|
2.21
|
34.36
|
8.37
|
3,619
|
1.25
|
1.75
|
0.47
|
60
|
| 10/1/18
to 9/30/19 |
|
43.09
|
0.34
|
—
|
(6.28)
|
(5.94)
|
(0.10)
|
(4.90)
|
(5.00)
|
—
|
(10.94)
|
32.15
|
(12.05)
|
4,826
|
1.25
|
1.94
|
1.05
|
55
|
| 10/1/17
to 9/30/18 |
|
41.19
|
0.42
|
—
|
2.41
|
2.83
|
(0.25)
|
(0.68)
|
(0.93)
|
—
|
1.90
|
43.09
|
6.88
|
9,108
|
1.25
|
1.50
|
0.95
|
62
|
| 10/1/16
to 9/30/17 |
|
34.57
|
—
|
—
|
6.93
|
6.93
|
(0.31)
|
—
|
(0.31)
|
—
|
6.62
|
41.19
(14) |
20.34
(14) |
6,068
|
1.36
|
1.93
|
0.01
|
67
|
| Class
C |
|
|
|
|
|
|
|
|
|
|
|
|
|
|
|
|
|
|
| 10/1/20
to 9/30/21 |
|
$33.00
|
(0.24)
|
—
|
7.60
|
7.36
|
(0.11)
|
(0.13)
|
(0.24)
|
—
|
7.12
|
$40.12
|
22.36 %
|
$
373 |
2.00 %
|
2.47 %
|
(0.62) %
|
51 %
|
| 10/1/19
to 9/30/20 |
|
30.72
|
(0.08)
|
—
|
2.40
|
2.32
|
(0.04)
|
—
|
(0.04)
|
—
|
2.28
|
33.00
|
7.56
|
722
|
2.00
|
2.49
|
(0.27)
|
60
|
| 10/1/18
to 9/30/19 |
|
41.63
|
0.05
|
—
|
(6.06)
|
(6.01)
|
—
|
(4.90)
|
(4.90)
|
—
|
(10.91)
|
30.72
|
(12.75)
|
963
|
2.04
|
2.59
|
0.16
|
55
|
| 10/1/17
to 9/30/18 |
|
40.01
|
(0.15)
|
—
|
2.55
|
2.40
|
(0.10)
|
(0.68)
|
(0.78)
|
—
|
1.62
|
41.63
|
5.99
|
2,610
|
2.08
|
2.27
|
(0.35)
|
62
|
| 10/1/16
to 9/30/17 |
|
33.78
|
(0.19)
|
—
|
6.67
|
6.48
|
(0.25)
|
—
|
(0.25)
|
—
|
6.23
|
40.01
(14) |
19.39
(14) |
2,829
|
2.14
|
2.50
|
(0.56)
|
67
|
| Class
P |
|
|
|
|
|
|
|
|
|
|
|
|
|
|
|
|
|
|
| 10/1/20
to 9/30/21 |
|
$34.20
|
0.27
|
—
|
7.72
|
7.99
|
(0.29)
|
(0.13)
|
(0.42)
|
—
|
7.57
|
$41.77
|
23.45 %
|
$
10,911 |
1.10 %
|
1.53 %
|
0.65 %
|
51 %
|
| 10/1/19
to 9/30/20 |
|
31.91
|
0.17
|
—
|
2.56
|
2.73
|
(0.44)
|
—
|
(0.44)
|
—
|
2.29
|
34.20
|
8.55
|
10,751
|
1.10
|
1.49
|
0.53
|
60
|
| 10/1/18
to 9/30/19 |
|
43.06
|
0.33
|
—
|
(6.25)
|
(5.92)
|
(0.33)
|
(4.90)
|
(5.23)
|
—
|
(11.15)
|
31.91
|
(11.92)
|
19,740
|
1.10
|
1.58
|
1.01
|
55
|
| 10/1/17
to 9/30/18 |
|
41.33
|
0.22
|
—
|
2.68
|
2.90
|
(0.49)
|
(0.68)
|
(1.17)
|
—
|
1.73
|
43.06
|
7.02
|
48,830
|
1.10
|
1.29
|
0.51
|
62
|
| 10/1/16
to 9/30/17 |
|
34.66
|
0.19
|
—
|
6.82
|
7.01
|
(0.34)
|
—
|
(0.34)
|
—
|
6.67
|
41.33
(14) |
20.55
(14) |
55,843
|
1.17
|
1.42
|
0.55
|
67
|
| Institutional
Class |
|
|
|
|
|
|
|
|
|
|
|
|
|
|
|
|
|
|
| 10/1/20
to 9/30/21 |
|
$35.49
|
0.29
|
—
|
8.03
|
8.32
|
(0.44)
|
(0.13)
|
(0.57)
|
—
|
7.75
|
$43.24
|
23.55 %
|
$
29,125 |
1.04 %
|
1.50 %
|
0.69 %
|
51 %
|
| 10/1/19
to 9/30/20 |
|
33.21
|
0.23
|
—
|
2.63
|
2.86
|
(0.58)
|
—
|
(0.58)
|
—
|
2.28
|
35.49
|
8.61
|
31,942
|
1.04
|
1.51
|
0.69
|
60
|
| 10/1/18
to 9/30/19 |
|
44.65
|
0.47
|
—
|
(6.58)
|
(6.11)
|
(0.43)
|
(4.90)
|
(5.33)
|
—
|
(11.44)
|
33.21
|
(11.88)
|
40,477
|
1.04
|
1.61
|
1.39
|
55
|
| 10/1/17
to 9/30/18 |
|
42.85
|
0.32
|
—
|
2.71
|
3.03
|
(0.55)
|
(0.68)
|
(1.23)
|
—
|
1.80
|
44.65
|
7.09
|
49,443
|
1.05
|
1.28
|
0.70
|
62
|
| 10/1/16
to 9/30/17 |
|
35.91
|
0.36
|
—
|
6.92
|
7.28
|
(0.34)
|
—
|
(0.34)
|
—
|
6.94
|
42.85
(14) |
20.58
(14) |
67,921
|
1.11
|
1.43
|
0.94
|
67
|
| Class
R6 |
|
|
|
|
|
|
|
|
|
|
|
|
|
|
|
|
|
|
| 10/1/20
to 9/30/21 |
|
$35.17
|
0.32
|
—
|
7.94
|
8.26
|
(0.44)
|
(0.13)
|
(0.57)
|
—
|
7.69
|
$42.86
|
23.60 %
|
$
31,785 |
1.00 %
|
1.41 %
|
0.77 %
|
51 %
|
| 10/1/19
to 9/30/20 |
|
33.03
|
0.26
|
—
|
2.59
|
2.85
|
(0.71)
|
—
|
(0.71)
|
—
|
2.14
|
35.17
|
8.63
|
29,889
|
1.00
|
1.43
|
0.80
|
60
|
| 10/1/18
to 9/30/19 |
|
44.64
|
0.48
|
—
|
(6.59)
|
(6.11)
|
(0.60)
|
(4.90)
|
(5.50)
|
—
|
(11.61)
|
33.03
|
(11.82)
|
28,630
|
1.00
|
1.49
|
1.44
|
55
|
| 10/1/17
to 9/30/18 |
|
42.90
|
0.40
|
—
|
2.66
|
3.06
|
(0.64)
|
(0.68)
|
(1.32)
|
—
|
1.74
|
44.64
|
7.14
|
33,876
|
1.00
|
1.22
|
0.87
|
62
|
| 10/1/16
to 9/30/17 |
|
35.94
|
0.22
|
—
|
7.09
|
7.31
|
(0.35)
|
—
|
(0.35)
|
—
|
6.96
|
42.90
(14) |
20.66
(14) |
17,804
|
1.05
|
1.42
|
0.60
|
67
|
| |
|
|
|
|
|
|
|
|
|
|
|
|
|
|
|
|
|
|
| AllianzGI
Preferred Securities and Income Fund |
|
|
|
|
|
|
|
|
|
|
|
|
|
|
|
|
|
|
| Class
P |
|
|
|
|
|
|
|
|
|
|
|
|
|
|
|
|
|
|
| 10/1/20
to 9/30/21 |
|
$14.73
|
0.68
|
—
|
1.80
|
2.48
|
(0.77)
|
(0.09)
|
(0.86)
|
—
(8) |
1.62
|
$16.35
|
17.18 %
(13) |
$
13 |
0.60 %
|
1.08 %
|
4.29 %
|
132 %
|
| 10/1/19
to 9/30/20 |
|
15.65
|
0.63
|
—
|
(0.48)
|
0.15
|
(0.68)
|
(0.39)
|
(1.07)
|
—
|
(0.92)
|
14.73
|
1.01
|
11
|
0.60
|
1.36
|
4.27
|
166
|
| 10/1/18
to 9/30/19 |
|
15.06
|
0.68
|
—
|
0.64
|
1.32
|
(0.71)
|
(0.02)
|
(0.73)
|
—
|
0.59
|
15.65
|
9.14
|
11
|
0.60
|
2.04
|
4.55
|
98
|
| 5/30/18
(10) to 9/30/18 |
|
15.00
|
0.23
|
—
|
0.03
|
0.26
|
(0.20)
|
—
|
(0.20)
|
—
|
0.06
|
15.06
|
1.74
|
10
|
0.60
(11) |
3.21
(11) |
4.62
(11) |
39
|
The footnote legend is at the end of the financial highlights.
See Notes to
Financial Statements
VIRTUS STRATEGY
TRUST
FINANCIAL HIGHLIGHTS (Continued)
SELECTED PER SHARE DATA AND RATIOS FOR A SHARE OUTSTANDING
THROUGHOUT EACH PERIOD
| |
|
Net
Asset Value,
Beginning of Period |
Net
Investment Income (Loss)(1) |
Capital
Gains Distributions
Received from Underlying Funds(1) |
Net
Realized and
Unrealized Gain (Loss) |
Total
from Investment Operations |
Dividends
from
Net Investment Income |
Distributions
from
Net Realized Gains |
Total
Distributions |
Payment
from Affiliate |
Change
in Net Asset Value |
Net
Asset Value, End of Period |
Total
Return(2)(3) |
Net
Assets, End of Period
(in thousands) |
Ratio
of Net Expenses to
Average Net Assets(4)(5) |
Ratio
of Gross Expenses
to Average Net Assets(4)(5) |
Ratio
of Net Investment Income (Loss)
to Average Net Assets(4) |
Portfolio
Turnover Rate(3) |
| AllianzGI
Preferred Securities and Income Fund (Continued) |
|
|
|
|
|
|
|
|
|
|
|
|
|
|
|
|
|
|
| Institutional
Class |
|
|
|
|
|
|
|
|
|
|
|
|
|
|
|
|
|
|
| 10/1/20
to 9/30/21 |
|
$14.74
|
0.69
|
—
|
1.79
|
2.48
|
(0.77)
|
(0.09)
|
(0.86)
|
—
(8) |
1.62
|
$16.36
|
17.13 %
(13) |
$
6,904 |
0.55 %
|
1.21 %
|
4.36 %
|
132 %
|
| 10/1/19
to 9/30/20 |
|
15.65
|
0.66
|
—
|
(0.50)
|
0.16
|
(0.68)
|
(0.39)
|
(1.07)
|
—
|
(0.91)
|
14.74
|
1.13
|
7,662
|
0.55
|
1.34
|
4.52
|
166
|
| 10/1/18
to 9/30/19 |
|
15.06
|
0.69
|
—
|
0.64
|
1.33
|
(0.72)
|
(0.02)
|
(0.74)
|
—
|
0.59
|
15.65
|
9.21
|
3,035
|
0.55
|
2.09
|
4.62
|
98
|
| 5/30/18
(10) to 9/30/18 |
|
15.00
|
0.26
|
—
|
—
|
0.26
|
(0.20)
|
—
|
(0.20)
|
—
|
0.06
|
15.06
|
1.76
|
1,548
|
0.56
(11) |
4.22
(11) |
5.28
(11) |
39
|
| Class
R6 |
|
|
|
|
|
|
|
|
|
|
|
|
|
|
|
|
|
|
| 10/1/20
to 9/30/21 |
|
$14.73
|
0.70
|
—
|
1.80
|
2.50
|
(0.78)
|
(0.09)
|
(0.87)
|
—
(8) |
1.63
|
$16.36
|
17.32 %
(13) |
$
16,296 |
0.50 %
|
1.08 %
|
4.39 %
|
132 %
|
| 10/1/19
to 9/30/20 |
|
15.65
|
0.65
|
—
|
(0.49)
|
0.16
|
(0.69)
|
(0.39)
|
(1.08)
|
—
|
(0.92)
|
14.73
|
1.10
|
17,839
|
0.50
|
1.35
|
4.41
|
166
|
| 10/1/18
to 9/30/19 |
|
15.06
|
0.70
|
—
|
0.64
|
1.34
|
(0.73)
|
(0.02)
|
(0.75)
|
—
|
0.59
|
15.65
|
9.26
|
14,646
|
0.50
|
2.00
|
4.66
|
98
|
| 5/30/18
(10) to 9/30/18 |
|
15.00
|
0.24
|
—
|
0.03
|
0.27
|
(0.21)
|
—
|
(0.21)
|
—
|
0.06
|
15.06
|
1.78
|
10,157
|
0.50
(11) |
3.22
(11) |
4.71
(11) |
39
|
| |
|
|
|
|
|
|
|
|
|
|
|
|
|
|
|
|
|
|
| AllianzGI
Short Duration High Income Fund |
|
|
|
|
|
|
|
|
|
|
|
|
|
|
|
|
|
|
| Class
A |
|
|
|
|
|
|
|
|
|
|
|
|
|
|
|
|
|
|
| 10/1/20
to 9/30/21 |
|
$13.99
|
0.62
|
—
|
0.84
|
1.46
|
(0.86)
|
—
|
(0.86)
|
—
|
0.60
|
$14.59
|
10.65 %
|
$
145,424 |
0.86 %
|
0.93 %
|
4.24 %
|
69 %
|
| 10/1/19
to 9/30/20 |
|
14.62
|
0.58
|
—
|
(0.54)
|
0.04
|
(0.67)
|
—
|
(0.67)
|
—
|
(0.63)
|
13.99
|
0.37
|
136,690
|
0.86
|
0.87
|
4.13
|
81
|
| 10/1/18
to 9/30/19 |
|
14.93
|
0.51
|
—
|
(0.11)
|
0.40
|
(0.71)
|
—
|
(0.71)
|
—
|
(0.31)
|
14.62
|
2.85
|
136,086
|
0.88
|
0.88
|
3.52
|
47
|
| 10/1/17
to 9/30/18 |
|
15.18
|
0.59
|
—
|
(0.16)
|
0.43
|
(0.68)
|
—
|
(0.68)
|
—
|
(0.25)
|
14.93
|
2.95
|
150,899
|
0.89
|
0.89
|
3.92
|
60
|
| 10/1/16
to 9/30/17 |
|
15.29
|
0.60
|
—
|
0.04
|
0.64
|
(0.75)
|
—
|
(0.75)
|
—
|
(0.11)
|
15.18
|
4.27
|
218,312
|
0.89
|
0.89
|
3.94
|
88
|
| Class
C |
|
|
|
|
|
|
|
|
|
|
|
|
|
|
|
|
|
|
| 10/1/20
to 9/30/21 |
|
$13.98
|
0.58
|
—
|
0.84
|
1.42
|
(0.77)
|
—
|
(0.77)
|
—
|
0.65
|
$14.63
|
10.34 %
|
$
77,032 |
1.11 %
|
1.20 %
|
4.00 %
|
69 %
|
| 10/1/19
to 9/30/20 |
|
14.61
|
0.54
|
—
|
(0.54)
|
—
|
(0.63)
|
—
|
(0.63)
|
—
|
(0.63)
|
13.98
|
0.12
|
90,863
|
1.12
|
1.13
|
3.86
|
81
|
| 10/1/18
to 9/30/19 |
|
14.90
|
0.47
|
—
|
(0.10)
|
0.37
|
(0.66)
|
—
|
(0.66)
|
—
|
(0.29)
|
14.61
|
2.58
|
117,058
|
1.14
|
1.14
|
3.25
|
47
|
| 10/1/17
to 9/30/18 |
|
15.15
|
0.55
|
—
|
(0.15)
|
0.40
|
(0.65)
|
—
|
(0.65)
|
—
|
(0.25)
|
14.90
|
2.74
|
135,483
|
1.11
|
1.11
|
3.70
|
60
|
| 10/1/16
to 9/30/17 |
|
15.27
|
0.56
|
—
|
0.03
|
0.59
|
(0.71)
|
—
|
(0.71)
|
—
|
(0.12)
|
15.15
|
4.00
|
148,587
|
1.12
|
1.12
|
3.70
|
88
|
| Class
P |
|
|
|
|
|
|
|
|
|
|
|
|
|
|
|
|
|
|
| 10/1/20
to 9/30/21 |
|
$13.90
|
0.65
|
—
|
0.83
|
1.48
|
(0.86)
|
—
|
(0.86)
|
—
|
0.62
|
$14.52
|
10.81 %
|
$
247,819 |
0.65 %
|
0.76 %
|
4.45 %
|
69 %
|
| 10/1/19
to 9/30/20 |
|
14.51
|
0.59
|
—
|
(0.51)
|
0.08
|
(0.69)
|
—
|
(0.69)
|
—
|
(0.61)
|
13.90
|
0.69
|
264,908
|
0.63
|
0.67
|
4.16
|
81
|
| 10/1/18
to 9/30/19 |
|
14.88
|
0.53
|
—
|
(0.10)
|
0.43
|
(0.80)
|
—
|
(0.80)
|
—
|
(0.37)
|
14.51
|
3.05
|
501,138
|
0.65
|
0.65
|
3.70
|
47
|
| 10/1/17
to 9/30/18 |
|
15.13
|
0.62
|
—
|
(0.15)
|
0.47
|
(0.72)
|
—
|
(0.72)
|
—
|
(0.25)
|
14.88
|
3.21
|
411,367
|
0.65
|
0.65
|
4.14
|
60
|
| 10/1/16
to 9/30/17 |
|
15.24
|
0.63
|
—
|
0.05
|
0.68
|
(0.79)
|
—
|
(0.79)
|
—
|
(0.11)
|
15.13
|
4.56
|
700,376
|
0.63
|
0.63
|
4.19
|
88
|
| Institutional
Class |
|
|
|
|
|
|
|
|
|
|
|
|
|
|
|
|
|
|
| 10/1/20
to 9/30/21 |
|
$13.89
|
0.65
|
—
|
0.84
|
1.49
|
(0.91)
|
—
|
(0.91)
|
—
|
0.58
|
$14.47
|
10.91 %
|
$
251,201 |
0.60 %
|
0.70 %
|
4.50 %
|
69 %
|
| 10/1/19
to 9/30/20 |
|
14.52
|
0.61
|
—
|
(0.54)
|
0.07
|
(0.70)
|
—
|
(0.70)
|
—
|
(0.63)
|
13.89
|
0.63
|
285,572
|
0.61
|
0.64
|
4.35
|
81
|
| 10/1/18
to 9/30/19 |
|
14.89
|
0.54
|
—
|
(0.11)
|
0.43
|
(0.80)
|
—
|
(0.80)
|
—
|
(0.37)
|
14.52
|
3.06
|
388,672
|
0.63
|
0.63
|
3.74
|
47
|
| 10/1/17
to 9/30/18 |
|
15.14
|
0.63
|
—
|
(0.15)
|
0.48
|
(0.73)
|
—
|
(0.73)
|
—
|
(0.25)
|
14.89
|
3.26
|
388,443
|
0.60
|
0.60
|
4.20
|
60
|
| 10/1/16
to 9/30/17 |
|
15.25
|
0.64
|
—
|
0.04
|
0.68
|
(0.79)
|
—
|
(0.79)
|
—
|
(0.11)
|
15.14
|
4.61
|
539,078
|
0.59
|
0.59
|
4.22
|
88
|
The footnote legend is at the end of the financial highlights.
See Notes to
Financial Statements
VIRTUS STRATEGY
TRUST
FINANCIAL HIGHLIGHTS (Continued)
SELECTED PER SHARE DATA AND RATIOS FOR A SHARE OUTSTANDING
THROUGHOUT EACH PERIOD
| |
|
Net
Asset Value,
Beginning of Period |
Net
Investment Income (Loss)(1) |
Capital
Gains Distributions
Received from Underlying Funds(1) |
Net
Realized and
Unrealized Gain (Loss) |
Total
from Investment Operations |
Dividends
from
Net Investment Income |
Distributions
from
Net Realized Gains |
Total
Distributions |
Payment
from Affiliate |
Change
in Net Asset Value |
Net
Asset Value, End of Period |
Total
Return(2)(3) |
Net
Assets, End of Period
(in thousands) |
Ratio
of Net Expenses to
Average Net Assets(4)(5) |
Ratio
of Gross Expenses
to Average Net Assets(4)(5) |
Ratio
of Net Investment Income (Loss)
to Average Net Assets(4) |
Portfolio
Turnover Rate(3) |
| AllianzGI
Short Duration High Income Fund (Continued) |
|
|
|
|
|
|
|
|
|
|
|
|
|
|
|
|
|
|
| Class
R6 |
|
|
|
|
|
|
|
|
|
|
|
|
|
|
|
|
|
|
| 10/1/20
to 9/30/21 |
|
$13.89
|
0.66
|
—
|
0.83
|
1.49
|
(0.90)
|
—
|
(0.90)
|
—
|
0.59
|
$14.48
|
10.95 %
|
$
21,117 |
0.55 %
|
0.63 %
|
4.59 %
|
69 %
|
| 10/1/19
to 9/30/20 |
|
14.52
|
0.62
|
—
|
(0.54)
|
0.08
|
(0.71)
|
—
|
(0.71)
|
—
|
(0.63)
|
13.89
|
0.70
|
33,741
|
0.55
|
0.56
|
4.49
|
81
|
| 10/1/18
to 9/30/19 |
|
14.89
|
0.56
|
—
|
(0.11)
|
0.45
|
(0.82)
|
—
|
(0.82)
|
—
|
(0.37)
|
14.52
|
3.20
|
39,234
|
0.57
|
0.57
|
3.89
|
47
|
| 10/1/17
to 9/30/18 |
|
15.14
|
0.64
|
—
|
(0.16)
|
0.48
|
(0.73)
|
—
|
(0.73)
|
—
|
(0.25)
|
14.89
|
3.29
|
52,922
|
0.55
|
0.55
|
4.27
|
60
|
| 2/1/17
(10) to 9/30/17 |
|
15.18
|
0.42
|
—
|
0.03
|
0.45
|
(0.49)
|
—
|
(0.49)
|
—
|
(0.04)
|
15.14
|
3.04
|
70,595
|
0.56
|
0.56
|
4.25
|
88
|
| |
|
|
|
|
|
|
|
|
|
|
|
|
|
|
|
|
|
|
| AllianzGI
Water Fund |
|
|
|
|
|
|
|
|
|
|
|
|
|
|
|
|
|
|
| Class
A |
|
|
|
|
|
|
|
|
|
|
|
|
|
|
|
|
|
|
| 10/1/20
to 9/30/21 |
|
$17.63
|
0.26
|
—
|
4.87
|
5.13
|
(0.04)
|
(0.27)
|
(0.31)
|
—
|
4.82
|
$22.45
|
29.41 %
|
$
286,453 |
1.22 %
|
1.45 %
|
1.23 %
|
32 %
|
| 10/1/19
to 9/30/20 |
|
16.31
|
0.06
|
—
|
1.77
|
1.83
|
(0.11)
|
(0.40)
|
(0.51)
|
—
|
1.32
|
17.63
|
11.35
|
200,384
|
1.22
|
1.40
|
0.37
|
28
|
| 10/1/18
to 9/30/19 |
|
15.54
|
0.11
|
—
|
1.15
|
1.26
|
(0.13)
|
(0.36)
|
(0.49)
|
—
|
0.77
|
16.31
|
8.88
|
177,463
|
1.23
|
1.40
|
0.76
|
33
|
| 10/1/17
to 9/30/18 |
|
15.49
|
0.13
|
—
|
0.34
|
0.47
|
(0.04)
|
(0.38)
|
(0.42)
|
—
|
0.05
|
15.54
|
3.05
|
172,374
|
1.19
|
1.41
|
0.84
|
34
|
| 10/1/16
to 9/30/17 |
|
14.46
|
0.08
|
—
|
1.08
|
1.16
|
(0.05)
|
(0.08)
|
(0.13)
|
—
|
1.03
|
15.49
|
8.18
|
190,693
|
1.33
|
1.44
|
0.59
|
29
|
| Class
C |
|
|
|
|
|
|
|
|
|
|
|
|
|
|
|
|
|
|
| 10/1/20
to 9/30/21 |
|
$16.73
|
0.09
|
—
|
4.63
|
4.72
|
—
(8) |
(0.27)
|
(0.27)
|
—
|
4.45
|
$21.18
|
28.48 %
|
$
68,805 |
1.97 %
|
2.20 %
|
0.43 %
|
32 %
|
| 10/1/19
to 9/30/20 |
|
15.52
|
(0.06)
|
—
|
1.67
|
1.61
|
—
|
(0.40)
|
(0.40)
|
—
|
1.21
|
16.73
|
10.48
|
57,901
|
1.97
|
2.16
|
(0.38)
|
28
|
| 10/1/18
to 9/30/19 |
|
14.79
|
—
|
—
|
1.10
|
1.10
|
(0.01)
|
(0.36)
|
(0.37)
|
—
|
0.73
|
15.52
|
8.02
|
70,175
|
1.98
|
2.15
|
0.01
|
33
|
| 10/1/17
to 9/30/18 |
|
14.82
|
0.01
|
—
|
0.34
|
0.35
|
—
|
(0.38)
|
(0.38)
|
—
|
(0.03)
|
14.79
|
2.35
|
83,156
|
1.94
|
2.16
|
0.07
|
34
|
| 10/1/16
to 9/30/17 |
|
13.90
|
(0.01)
|
—
|
1.01
|
1.00
|
—
|
(0.08)
|
(0.08)
|
—
|
0.92
|
14.82
|
7.32
|
89,250
|
2.07
|
2.19
|
(0.07)
|
29
|
| Class
P |
|
|
|
|
|
|
|
|
|
|
|
|
|
|
|
|
|
|
| 10/1/20
to 9/30/21 |
|
$17.68
|
0.32
|
—
|
4.88
|
5.20
|
(0.08)
|
(0.27)
|
(0.35)
|
—
|
4.85
|
$22.53
|
29.77 %
|
$
339,111 |
0.94 %
|
1.25 %
|
1.51 %
|
32 %
|
| 10/1/19
to 9/30/20 |
|
16.33
|
0.11
|
—
|
1.77
|
1.88
|
(0.13)
|
(0.40)
|
(0.53)
|
—
|
1.35
|
17.68
|
11.67
|
240,922
|
0.94
|
1.16
|
0.66
|
28
|
| 10/1/18
to 9/30/19 |
|
15.59
|
0.15
|
—
|
1.14
|
1.29
|
(0.19)
|
(0.36)
|
(0.55)
|
—
|
0.74
|
16.33
|
9.14
|
210,425
|
0.95
|
1.17
|
1.03
|
33
|
| 10/1/17
to 9/30/18 |
|
15.57
|
0.17
|
—
|
0.36
|
0.53
|
(0.13)
|
(0.38)
|
(0.51)
|
—
|
0.02
|
15.59
|
3.40
|
243,338
|
0.93
|
1.15
|
1.12
|
34
|
| 10/1/16
to 9/30/17 |
|
14.54
|
0.15
|
—
|
1.04
|
1.19
|
(0.08)
|
(0.08)
|
(0.16)
|
—
|
1.03
|
15.57
|
8.40
|
210,746
|
1.04
|
1.16
|
1.02
|
29
|
| Institutional
Class |
|
|
|
|
|
|
|
|
|
|
|
|
|
|
|
|
|
|
| 10/1/20
to 9/30/21 |
|
$17.33
|
0.33
|
—
|
4.77
|
5.10
|
(0.10)
|
(0.27)
|
(0.37)
|
—
|
4.73
|
$22.06
|
29.76 %
|
$
325,247 |
0.93 %
|
1.21 %
|
1.57 %
|
32 %
|
| 10/1/19
to 9/30/20 |
|
16.03
|
0.11
|
—
|
1.74
|
1.85
|
(0.15)
|
(0.40)
|
(0.55)
|
—
|
1.30
|
17.33
|
11.71
|
204,320
|
0.93
|
1.13
|
0.68
|
28
|
| 10/1/18
to 9/30/19 |
|
15.31
|
0.15
|
—
|
1.11
|
1.26
|
(0.18)
|
(0.36)
|
(0.54)
|
—
|
0.72
|
16.03
|
9.12
|
152,496
|
0.94
|
1.18
|
1.04
|
33
|
| 10/1/17
to 9/30/18 |
|
15.32
|
0.17
|
—
|
0.34
|
0.51
|
(0.14)
|
(0.38)
|
(0.52)
|
—
|
(0.01)
|
15.31
|
3.36
|
164,322
|
0.92
|
1.14
|
1.13
|
34
|
| 10/1/16
to 9/30/17 |
|
14.33
|
0.16
|
—
|
1.02
|
1.18
|
(0.11)
|
(0.08)
|
(0.19)
|
—
|
0.99
|
15.32
|
8.49
|
142,353
|
1.01
|
1.15
|
1.13
|
29
|
The footnote legend is at the end of the financial highlights.
See Notes to
Financial Statements
VIRTUS STRATEGY
TRUST
FINANCIAL HIGHLIGHTS (Continued)
SELECTED PER SHARE DATA AND RATIOS FOR A SHARE OUTSTANDING
THROUGHOUT EACH PERIOD
| |
|
Net
Asset Value,
Beginning of Period |
Net
Investment Income (Loss)(1) |
Capital
Gains Distributions
Received from Underlying Funds(1) |
Net
Realized and
Unrealized Gain (Loss) |
Total
from Investment Operations |
Dividends
from
Net Investment Income |
Distributions
from
Net Realized Gains |
Total
Distributions |
Payment
from Affiliate |
Change
in Net Asset Value |
Net
Asset Value, End of Period |
Total
Return(2)(3) |
Net
Assets, End of Period
(in thousands) |
Ratio
of Net Expenses to
Average Net Assets(4)(5) |
Ratio
of Gross Expenses
to Average Net Assets(4)(5) |
Ratio
of Net Investment Income (Loss)
to Average Net Assets(4) |
Portfolio
Turnover Rate(3) |
| |
|
|
|
|
|
|
|
|
|
|
|
|
|
|
|
|
|
|
| NFJ
Emerging Markets Value Fund |
|
|
|
|
|
|
|
|
|
|
|
|
|
|
|
|
|
|
| Class
A |
|
|
|
|
|
|
|
|
|
|
|
|
|
|
|
|
|
|
| 10/1/20
to 9/30/21 |
|
$18.09
|
0.05
|
—
|
2.17
|
2.22
|
(0.20)
|
—
|
(0.20)
|
—
|
2.02
|
$20.11
|
12.24 %
|
$
15,565 |
1.14 %
|
1.50 %
|
0.26 %
|
56 %
|
| 10/1/19
to 9/30/20 |
|
15.55
|
0.15
|
—
|
2.58
|
2.73
|
(0.19)
|
—
|
(0.19)
|
—
|
2.54
|
18.09
|
17.63
|
14,907
|
1.14
|
1.64
|
0.89
|
105
|
| 10/1/18
to 9/30/19 |
|
16.18
|
0.42
|
—
|
(0.68)
|
(0.26)
|
(0.37)
|
—
|
(0.37)
|
—
|
(0.63)
|
15.55
|
(1.68)
|
14,395
|
1.15
|
1.65
|
2.69
|
101
|
| 10/1/17
to 9/30/18 |
|
17.24
|
0.41
|
—
|
(1.14)
|
(0.73)
|
(0.26)
|
(0.07)
|
(0.33)
|
—
|
(1.06)
|
16.18
|
4.36
|
22,590
|
1.14
|
1.65
|
2.31
|
116
|
| 10/1/16
to 9/30/17 |
|
14.31
|
0.40
|
—
|
2.85
|
3.25
|
(0.32)
|
—
|
(0.32)
|
—
|
2.93
|
17.24
(15) |
23.07
(14) |
11,026
|
1.22
|
3.32
|
2.58
|
120
|
| Class
C |
|
|
|
|
|
|
|
|
|
|
|
|
|
|
|
|
|
|
| 10/1/20
to 9/30/21 |
|
$18.07
|
(0.11)
|
—
|
2.17
|
2.06
|
(0.01)
|
—
|
(0.01)
|
—
|
2.05
|
$20.12
|
11.40 %
|
$
914 |
1.89 %
|
2.25 %
|
(0.51) %
|
56 %
|
| 10/1/19
to 9/30/20 |
|
15.56
|
0.03
|
—
|
2.57
|
2.60
|
(0.09)
|
—
|
(0.09)
|
—
|
2.51
|
18.07
|
16.75
|
1,016
|
1.89
|
2.37
|
0.16
|
105
|
| 10/1/18
to 9/30/19 |
|
16.23
|
0.35
|
—
|
(0.73)
|
(0.38)
|
(0.29)
|
—
|
(0.29)
|
—
|
(0.67)
|
15.56
|
(2.38)
|
1,006
|
1.90
|
2.40
|
2.24
|
101
|
| 10/1/17
to 9/30/18 |
|
17.33
|
0.24
|
—
|
(1.11)
|
(0.87)
|
(0.16)
|
(0.07)
|
(0.23)
|
—
|
(1.10)
|
16.23
|
(5.08)
|
1,196
|
1.90
|
2.38
|
1.35
|
116
|
| 10/1/16
to 9/30/17 |
|
14.29
|
0.34
|
—
|
2.81
|
3.15
|
(0.11)
|
—
|
(0.11)
|
—
|
3.04
|
17.33
(15) |
22.06
(14) |
527
|
1.95
|
4.00
|
2.16
|
120
|
| Class
P |
|
|
|
|
|
|
|
|
|
|
|
|
|
|
|
|
|
|
| 10/1/20
to 9/30/21 |
|
$18.05
|
0.09
|
—
|
2.15
|
2.24
|
(0.30)
|
—
|
(0.30)
|
—
|
1.94
|
$19.99
|
12.40 %
|
$
10,449 |
0.99 %
(9) |
1.47 %
|
0.44 %
|
56 %
|
| 10/1/19
to 9/30/20 |
|
15.53
|
0.22
|
—
|
2.53
|
2.75
|
(0.23)
|
—
|
(0.23)
|
—
|
2.52
|
18.05
|
17.85
|
7,192
|
0.99
|
1.27
|
1.33
|
105
|
| 10/1/18
to 9/30/19 |
|
16.16
|
0.45
|
—
|
(0.69)
|
(0.24)
|
(0.39)
|
—
|
(0.39)
|
—
|
(0.63)
|
15.53
|
(1.53)
|
2,022
|
0.99
|
1.32
|
2.90
|
101
|
| 10/1/17
to 9/30/18 |
|
17.13
|
0.36
|
—
|
(1.08)
|
(0.72)
|
(0.18)
|
(0.07)
|
(0.25)
|
—
|
(0.97)
|
16.16
|
(4.30)
|
3,312
|
0.98
|
1.48
|
2.03
|
116
|
| 10/1/16
to 9/30/17 |
|
14.31
|
0.46
|
—
|
2.78
|
3.24
|
(0.42)
|
—
|
(0.42)
|
—
|
2.82
|
17.13
(15) |
23.22
(14) |
19,899
|
1.05
|
3.00
|
2.99
|
120
|
| Institutional
Class |
|
|
|
|
|
|
|
|
|
|
|
|
|
|
|
|
|
|
| 10/1/20
to 9/30/21 |
|
$18.01
|
0.11
|
—
|
2.15
|
2.26
|
(0.29)
|
—
|
(0.29)
|
—
|
1.97
|
$19.98
|
12.50 %
|
$
122,736 |
0.89 %
|
1.27 %
|
0.50 %
|
56 %
|
| 10/1/19
to 9/30/20 |
|
15.48
|
0.19
|
—
|
2.57
|
2.76
|
(0.23)
|
—
|
(0.23)
|
—
|
2.53
|
18.01
|
17.95
|
115,817
|
0.89
|
1.34
|
1.18
|
105
|
| 10/1/18
to 9/30/19 |
|
16.29
|
0.49
|
—
|
(0.73)
|
(0.24)
|
(0.57)
|
—
|
(0.57)
|
—
|
(0.81)
|
15.48
|
(1.45)
|
90,711
|
0.90
|
1.37
|
3.13
|
101
|
| 10/1/17
to 9/30/18 |
|
17.49
|
0.42
|
—
|
(1.11)
|
(0.69)
|
(0.44)
|
(0.07)
|
(0.51)
|
—
|
(1.20)
|
16.29
|
(4.12)
|
111,161
|
0.90
|
1.39
|
2.41
|
116
|
| 10/1/16
to 9/30/17 |
|
14.46
|
0.44
|
—
|
2.91
|
3.35
|
(0.32)
|
—
|
(0.32)
|
—
|
3.03
|
17.49
(15) |
23.33
(14) |
34,444
|
0.95
|
2.87
|
2.71
|
120
|
| Footnote
Legend: |
|
(1) |
Calculated
using average shares outstanding. |
|
(2) |
Sales
charges, where applicable, are not reflected in the total return calculation. |
|
(3) |
Not
annualized for periods less than one year. |
|
(4) |
Annualized
for periods less than one year. |
|
(5) |
The
Funds will also indirectly bear their prorated share of expenses of any underlying funds in which they invest. Such expenses are not included in the calculation of this ratio. |
|
(6) |
See
Note 4D in Notes to Financial Statements for information on recapture of expenses previously reimbursed and/or waived. |
|
(7) |
Portfolio
turnover rate excludes securities received or delivered from in-kind fund share transactions. |
|
(8) |
Amount
is less than $0.005 per share. |
|
(9) |
Due
to a change in expense cap, the ratio shown is a blended expense ratio. |
|
(10) |
Inception
date. |
|
(11) |
Certain
expenses incurred by the Fund were not annualized. |
|
(12) |
Net
expense ratio includes extraordinary proxy expenses. |
|
(13) |
Payment
from affiliate had no impact on total return. |
|
(14) |
Payments
from Affiliates increased the end of period net asset value and total return by less than $0.01 and 0.01%, respectively. |
See
Notes to Financial Statements
VIRTUS STRATEGY
TRUST
FINANCIAL HIGHLIGHTS (Continued)
SELECTED PER SHARE DATA AND RATIOS FOR A SHARE OUTSTANDING
THROUGHOUT EACH PERIOD
|
(15) |
Payments
from affiliates increased the end of year net asset value (“NAV”) and total return by $0.02 and 0.15%, respectively, for Class A, $0.02 and 0.14%, respectively, for Class C, $0.02 and 0.14%, respectively, for Class P and $0.01 and
0.07%, respectively for Institutional Class. If the Affiliates had not made these payments, the end of year NAV and total return would have been $17.22 and 22.92%, respectively, for Class A, $17.31 and 21.92%, respectively, for Class C, $17.11 and
23.08%, respectively, for Class P and $17.48 and 23.26%, respectively for Institutional Class. |
See Notes to Financial Statements
VIRTUS STRATEGY
TRUST
NOTES TO FINANCIAL STATEMENTS September 30, 2021
Note 1. Organization
Virtus Strategy Trust (the
“Trust”) is organized as a Massachusetts business trust and is registered under the Investment Company Act of 1940, as amended (the “1940 Act”), as an open-end management investment company.
As of the date of this report, the Trust is
comprised of 12 funds (each a “Fund” or collectively the “Funds”), each reported in this annual report. Each Fund’s investment objective is outlined in its respective Fund Summary page.
There is no guarantee that a Fund will achieve its objective(s).
Effective February 1, 2021, the name of the
Trust changed from “Allianz Funds Multi-Strategy Trust” to “Virtus Strategy Trust”.
The AllianzGI Convertible Fund and AllianzGI
High Yield Bond Fund offer Class A shares, Class C shares, Class P shares, Institutional Class shares, and Administrative Class shares. The AllianzGI Core Plus Bond Fund and AllianzGI Preferred Securities and Income Fund offer Class P shares,
Institutional Class shares, and Class R6 shares. The AllianzGI Emerging Markets Consumer Fund offers Class A shares and Institutional Class shares. The AllianzGI Global Allocation Fund and AllianzGI Global Dynamic Allocation Fund offer Class A
shares, Class C shares, Class P shares, Institutional Class shares, Class R6 shares, and Administrative Class shares. The AllianzGI Global Sustainability Fund offers Class A shares, Class P shares, and Institutional Class shares. The AllianzGI
International Small-Cap Fund and AllianzGI Short Duration High Income Fund offer Class A shares, Class C shares, Class P shares, Institutional Class shares, and Class R6 shares. The AllianzGI Water Fund and NFJ Emerging Markets Value Fund offer
Class A shares, Class C shares, Institutional Class shares, and Class P shares.
Class A shares of AllianzGI High Yield Bond
Fund are sold with a front-end sales charge of up to 3.75% with some exceptions. Class A shares of AllianzGI Short Duration High Income Fund are sold with a front-end sales charge of up to 2.25% with some exceptions. Class A shares of all other
Funds are sold with a front-end sales charge of up to 5.50% with some exceptions. Generally, Class A shares are not subject to any charges by the Funds when redeemed; however, a 0.50% - 1.00% contingent deferred sales charge (“CDSC”) may
be imposed on certain redemptions made within a certain period following purchases on which a finder’s fee has been paid. The period for which such CDSC applies for the Funds is 12 months for the AllianzGI Short Duration High Income Fund, and
18 months for all other Funds. The CDSC period begins on the last day of the month preceding the month in which the purchase was made.
On May 21, 2021, all Class R shares for the
AllianzGI Convertible Fund, AllianzGI Global Allocation Fund, AllianzGI Global Dynamic Allocation Fund, AllianzGI High Yield Bond Fund, and AllianzGI International Small-Cap Fund were converted into Class A shares of the respective Fund.
Class C shares are generally sold with a 1%
CDSC, applicable if redeemed within one year of purchase. Class C shares and any reinvested dividends and other distributions paid on such shares, will be automatically converted to Class A shares of the same Fund following a required holding
period, which as of March 1, 2021, was eight years. Effective February 26, 2021, if an investor intends to purchase greater than $999,999 of Class C shares, and the purchase would qualify for Class A shares with no load, then the purchase will
automatically be made into a purchase of Class A shares, thus reducing expenses. Class P shares, Institutional Class shares, Class R6 shares, and Administrative Class shares are sold without a front-end sales charge or CDSC.
Class P shares are offered primarily through
certain asset allocation, wrap fee and other similar programs offered by broker-dealers and other intermediaries (“service agents”) that have established a shareholder servicing relationship with the Trust on behalf of their customers.
Such programs established with broker-dealers or financial intermediaries may purchase shares only if the program for which the shares are being acquired will maintain an omnibus or pooled account for each fund. Class P shares may also be offered
for direct investment by other investors such as pension and profit sharing plans, employee benefit trusts and plan alliances, endowments, foundations and corporations.
Institutional Class shares are offered
primarily to clients of financial intermediaries that (i) charge such clients an ongoing fee for advisory, investment, consulting, or similar services; or (ii) have entered into an agreement with the Funds’ distributor or transfer agent to
offer Institutional Class shares through a no-load network or platform. Such clients may include pension and profit sharing plans, other employee benefit trusts, endowments, foundations and corporations. Institutional Class shares are also offered
to private and institutional clients of, or referred by, the adviser, a subadviser or their affiliates, and to Trustees of the Funds and trustees/directors of affiliated open- and closed-end funds, and directors, officers and employees of Virtus and
its affiliates. If you are eligible to purchase and do purchase Institutional Class shares, you will pay no sales charge at any time. There are no distribution and service fees applicable to Institutional Class shares.
Class R6 shares are offered without a
minimum initial investment to the following investors in plan level or omnibus accounts only (provided that they do not require or receive any compensation, administrative payments, sub-transfer agency payments or service payments with respect to
Class R6 shares): (i) qualified retirement plans, including, but not limited to, 401(k) plans, 457 plans, employer-sponsored 403(b) plans, and defined benefit plans; (ii) banks and trust companies; (iii) insurance companies; (iv) financial
intermediaries utilizing such shares in fee-based investment advisory programs; (v) registered investment companies; and (vi) non-qualified deferred compensation plans. Other institutional investors may be permitted to purchase Class R6 shares
subject to the applicable Fund’s determination of eligibility and may be subject to a $2,500,000 minimum initial investment requirement. In addition, without a minimum initial investment requirement, Class R6 shares are available to any
Trustee of the Virtus Funds and trustees/directors of affiliated open- and closed-end funds, directors, officers and employees of Virtus and its affiliates, and a spouse or domestic partner, child or minor grandchild of any such qualifying
individual (in each case either individually or jointly with other investors), provided in each case that those shares are held directly with the Transfer Agent or in an eligible account. Class R6 shares do not carry sales commissions or pay Rule
12b-1 fees. No compensation, administrative payments, sub-transfer agency payments or service payments are paid to brokers or other entities from Fund assets or the Funds’ distributor’s or an affiliate’s resources on sales of or
investments in Class R6 shares.
Administrative Class shares are offered
primarily through employee benefit plan alliances, broker-dealers, and other intermediaries, and each Fund pays service or distribution fees to such entities for services they provide to Administrative Class shareholders.
VIRTUS STRATEGY
TRUST
NOTES TO FINANCIAL STATEMENTS (Continued)
September 30, 2021
The Funds may impose an annual fee on
accounts having balances of less than $2,500. The small account fee may be waived in certain circumstances, as disclosed in the prospectuses and/or statement of additional information. The fees collected will be used to offset certain expenses of
the Funds. These fees are reflected as “Less low balance account fees” in each Fund’s Statement of Operations for the period, as applicable.
Each class of shares has identical voting,
dividend, liquidation and other rights and the same terms and conditions, except that each class bears any expenses attributable specifically to that class (“class-specific expenses”) and has exclusive voting rights with respect to any
Rule 12b-1 and/or shareholder service plan (“12b-1 Plan”) approved by the Board. Class P shares, Institutional Class shares, Class R6 shares, and Administrative Class shares are not subject to a 12b-1 Plan. Class-specific expenses may
include shareholder servicing fees, sub-transfer agency fees, and fees under a 12b-1 Plan, as well as certain other expenses as designated by the Funds’ Treasurer and approved by the Board. Investment income, common operating expenses and
realized and unrealized gains and losses of each Fund are borne pro-rata by the holders of each class of shares.
Note 2. Significant Accounting Policies
The Trust is an investment company that
follows the accounting and reporting guidance of the Financial Accounting Standards Board (“FASB”) Accounting Standards Codification Topic 946 Financial Services – Investment Companies. The following is a summary of significant
accounting policies consistently followed by the Funds in the preparation of their financial statements and for derivatives, included in Note 3 below. The preparation of financial statements in conformity with U.S. generally accepted accounting
principles (“U.S. GAAP”) requires management to make estimates and assumptions that affect the reported amounts of assets and liabilities, disclosure of contingent assets and liabilities at the date of the financial statements, and the
reported amounts of increases and decreases in net assets from operations during the reporting period. Actual results could differ from those estimates and those differences could be significant.
| A.
|
Security Valuation |
| |
Starting February 1, 2021,
concurrent with the change in adviser to Virtus Investment Advisers, Inc. (the “Adviser”) (as detailed in Note 4A), the Funds adopted valuation policies and procedures used by the other Virtus-sponsored registered Funds. |
| |
Each Fund
utilizes a fair value hierarchy which prioritizes the inputs to valuation techniques used to measure fair value into three broad levels. The Funds’ policy is to recognize transfers into or out of Level 3 at the end of the reporting period.
|
Level 1 – quoted prices in active markets for identical securities (security types generally include listed equities).
Level 2 – prices determined using other significant observable inputs (including quoted prices for similar securities, interest rates, prepayment speeds, credit risk, etc.).
Level 3 – prices determined using significant unobservable inputs (including the Valuation Committee’s own assumptions in determining the fair value of investments).
A description of the valuation
techniques applied to a Fund’s major categories of assets and liabilities measured at fair value on a recurring basis is as follows:
Equity securities are valued at the
official closing price (typically last sale) on the exchange on which the securities are primarily traded or, if no closing price is available, at the last bid price and are categorized as Level 1 in the hierarchy. Restricted equity securities and
private placements that are illiquid, or are internally fair valued by the Valuation Committee, are generally categorized as Level 3 in the hierarchy.
Certain non-U.S. securities may be fair
valued in cases where closing prices are not readily available or are deemed not reflective of readily available market prices. For example, significant events (such as movement in the U.S. securities market, or other regional and local
developments) may occur between the time that non-U.S. markets close (where the security is principally traded) and the time that a Fund calculates its net asset value (“NAV”) at the close of regular trading on the New York Stock
Exchange (“NYSE”) (generally 4 p.m. Eastern time) that may impact the value of securities traded in these non-U.S. markets. In such cases, the Funds fair value non-U.S. securities using an independent pricing service which considers the
correlation of the trading patterns of the non-U.S. security to the intraday trading in the U.S. markets for investments such as ADRs, financial futures, ETFs, and certain indexes, as well as prices for similar securities. Such fair valuations are
categorized as Level 2 in the hierarchy. Because the frequency of significant events is not predictable, fair valuation of certain non-U.S. common stocks may occur on a frequent basis.
Debt securities, including convertible
bonds, and restricted securities, are valued based on evaluated quotations received from independent pricing services or from dealers who make markets in such securities. For most bond types, the pricing service utilizes matrix pricing that
considers one or more of the following factors: yield or price of bonds of comparable quality, coupon, maturity, current cash flows, type, activity of the underlying equities, and current day trade information, as well as dealer supplied prices.
These valuations are generally categorized as Level 2 in the hierarchy. Structured debt instruments, such as mortgage-backed and asset-backed securities may also incorporate collateral analysis and utilize cash flow models for valuation and are
generally categorized as Level 2 in the hierarchy. Pricing services do not provide pricing for all securities and therefore indicative bids from dealers are utilized which are based on pricing models used by market makers in the security and are
generally categorized as Level 2 in the hierarchy. Debt securities that are internally fair valued by the Valuation Committee are generally categorized as Level 3 in the hierarchy.
VIRTUS STRATEGY
TRUST
NOTES TO FINANCIAL STATEMENTS (Continued)
September 30, 2021
Listed derivatives, such as options and
futures, that are actively traded are valued at the last posted settlement price from the exchange where they are principally traded and are categorized as Level 1 in the hierarchy. Over-the-counter (“OTC”) derivative contracts, which
include forward currency contracts, swaps, swaptions, options and equity linked instruments, are valued based on model prices provided by independent pricing services or from dealer quotes. Depending on the derivative type and the specific terms of
the transaction, these models vary and include observable inputs in actively quoted markets including but not limited to: underlying reference entity details, indices, spreads, interest rates, yield curves, dividend and exchange rates. These
instruments are generally categorized as Level 2 in the hierarchy. Centrally cleared swaps listed or traded on a bilateral or trade facility platform, such as a registered exchange, are valued at the last posted settlement price determined by the
respective exchange. These securities are generally categorized as Level 2 within the hierarchy.
Investments in open-end mutual funds are
valued at NAV. Investments in closed-end funds and ETFs are valued as of the close of regular trading on the NYSE each business day. Each is categorized as Level 1 in the hierarchy.
A summary of the inputs used to value a
Fund’s net assets by each major security type is disclosed at the end of the Schedule of Investments for each Fund. The inputs or methodologies used for valuing securities are not necessarily an indication of the risk associated with investing
in those securities.
| B.
|
Security Transactions and
Investment Income |
| |
Security transactions are
recorded on the trade date. Realized gains and losses from the sale of securities are determined on the identified cost basis. Dividend income is recognized on the ex-dividend date or, in the case of certain foreign securities, as soon as a Fund is
notified. Interest income is recorded on the accrual basis. Each Fund amortizes premiums and accretes discounts using the effective interest method. Premiums on callable debt securities are amortized to interest income to the earliest call date
using the effective interest method. Conversion premium is not amortized. Any distributions from underlying funds are recorded in accordance with the character of the distributions as designated by the underlying funds. |
| |
Dividend income from REITs is
recorded using management’s estimate of the percentage of income included in distributions received from such investments based on historical information and other industry sources. The return of capital portion of the estimate is a reduction
to investment income and a reduction in the cost basis of each investment which increases net realized gain (loss) and net change in unrealized appreciation (depreciation). If the return of capital distributions exceed their cost basis, the
distributions are treated as realized gains. The actual amounts of income, return of capital, and capital gains are only determined by each REIT after its fiscal year-end, and may differ from the estimated amounts. |
| C.
|
Income Taxes |
| |
Each Fund is treated as a
separate taxable entity. It is the intention of each Fund to comply with the requirements of Subchapter M of the Internal Revenue Code of 1986, as amended (the “Code”) and to distribute substantially all of its taxable income to its
shareholders. Therefore, no provision for federal income taxes or excise taxes has been made. |
| |
Certain Funds may be subject
to foreign taxes on income, gains on investments or currency repatriation, a portion of which may be recoverable. Each Fund will accrue such taxes and recoveries as applicable based upon current interpretations of the tax rules and regulations that
exist in the markets in which it invests. |
| |
Management of the Funds has
concluded that there are no significant uncertain tax positions that would require recognition in the financial statements. Each Fund’s U.S. federal income tax return is generally subject to examination by the Internal Revenue Service for a
period of three years after it is filed. State, local and/or non-U.S. tax returns and/or other filings may be subject to examination for different periods, depending upon the tax rules of each applicable jurisdiction. |
| D.
|
Distributions to Shareholders
|
| |
Distributions are recorded by
each Fund on the ex-dividend date. Income and capital gain distributions are determined in accordance with income tax regulations which may differ from U.S. GAAP. |
| E.
|
Expenses
|
| |
Expenses incurred together by
a Fund and other affiliated mutual funds are allocated in proportion to the net assets of each such fund, except where allocation of direct expenses to each Fund or an alternative allocation method can be more appropriately used. |
| |
In addition to the net annual
operating expenses that a Fund bears directly, the shareholders of a Fund indirectly bear the pro-rata expenses of any underlying mutual funds in which the Fund invests. |
| F.
|
Convertible Securities
|
| |
Certain
Funds may invest a portion of their assets in convertible securities. Although convertible securities derive part of their value from that of the securities into which they are convertible, they are not considered derivative financial instruments.
However, certain of the Funds’ investments in convertible securities include features which render them sensitive to price changes in their underlying securities. The value of structured/synthetic convertible securities can be affected by
interest rate changes and credit risks of the issuer. Such securities may be structured in ways that limit their potential for capital appreciation, and the entire value of the security may be at risk of loss depending on the performance of the
underlying equity security. Consequently, the Funds are exposed to greater downside risk than traditional convertible securities, but typically still less than that of the underlying stock. |
VIRTUS STRATEGY
TRUST
NOTES TO FINANCIAL STATEMENTS (Continued)
September 30, 2021
| G.
|
Foreign Currency Transactions
|
| |
Non-U.S. investment
securities and other assets and liabilities denominated in foreign currencies are translated into U.S. dollar amounts at the foreign currency exchange rate effective at the end of the reporting period. Cost of investments is translated at the
currency exchange rate effective at the trade date. The gain or loss resulting from a change in currency exchange rates between the trade and settlement date of a portfolio transaction is treated as a gain or loss on foreign currency. Likewise, the
gain or loss resulting from a change in currency exchange rates between the date income is accrued and the date it is paid is treated as a gain or loss on foreign currency. The Funds do not isolate that portion of the results of operations arising
from changes in foreign exchange rates on investments from the fluctuations arising from changes in the market prices of securities held. Such fluctuations are included with the net realized and unrealized gain or loss on investments. |
| H.
|
Payment In-Kind Securities
|
| |
Certain Funds may invest in
payment in-kind securities, which are debt or preferred stock securities that require or permit payment of interest in the form of additional securities. Payment in-kind securities allow the issuer to avoid or delay the need to generate cash to meet
current interest payments and, as a result, may involve greater risk than securities that pay interest currently or in cash. |
| I.
|
Securities Traded on a
To-Be-Announced Basis |
| |
Certain Funds may trade
securities on a to-be-announced (“TBA”) basis. In a TBA transaction, a Fund commits to purchasing or selling securities which have not yet been issued by the issuer and for which specific information, such as the face amount, maturity
date and underlying pool of investments in U.S. government agency mortgage pass-through securities, is not announced. Securities purchased on a TBA basis are not settled until they are delivered to the Fund. Beginning on the date a Fund enters into
a TBA transaction, cash, U.S. government securities or other liquid high-grade debt obligations are segregated in an amount equal in value to the purchase price of the TBA security. These securities are subject to market fluctuations and their
current value is determined in the same manner as for other securities. |
| J.
|
When-issued Purchases and
Forward Commitments (Delayed Delivery) |
| |
Certain Funds may engage in
when-issued or forward commitment transactions. Securities purchased on a when-issued or forward commitment basis are also known as delayed delivery transactions. Delayed delivery transactions involve a commitment by a Fund to purchase or sell a
security at a future date (ordinarily up to 90 days later). When-issued or forward commitments enable the Funds to lock in what is believed to be an attractive price or yield on a particular security for a period of time, regardless of future
changes in interest rates. Each Fund records when-issued and forward commitment securities on the trade date. Each Fund maintains collateral for the securities purchased. Securities purchased on a when-issued or forward commitment basis begin
earning interest on the settlement date. |
| K.
|
Leveraged Loans |
| |
Certain Funds may invest in
direct debt instruments which are interests in amounts owed by a corporate, governmental, or other borrower to lenders or lending syndicates. Leveraged loans are generally non-investment grade and often involve borrowers that are highly leveraged.
The Funds may invest in obligations of borrowers who are in bankruptcy proceedings. Leveraged loans are typically senior in the corporate capital structure of the borrower. A loan is often administered by a bank or other financial institution (the
“lender”) that acts as agent for all holders. The agent administers the terms of the loan, as specified in the leveraged loan. A Fund’s investments in loans may be in the form of participations in loans or assignments of all or a
portion of loans from third parties. When investing in loan participations, a Fund has the right to receive payments of principal, interest and any fees to which it is entitled only from the lender selling the loan participation and only upon
receipt by the lender of payments from the borrower. A Fund generally has no right to enforce compliance with the terms of the leveraged loan with the borrower. As a result, a Fund may be subject to the credit risk of both the borrower and the
lender that is selling the leveraged loan. When a Fund purchases assignments from lenders it acquires direct rights against the borrower on the loan. |
| |
A Fund may invest in multiple
series or tranches of a loan, which may have varying terms and carry different associated risks. Leveraged loans may involve foreign borrowers and investments may be denominated in foreign currencies. Direct indebtedness of emerging countries
involves a risk that the government entities responsible for the repayment of the debt may be unable, or unwilling, to pay the principal and interest when due. |
| |
The leveraged loans have
floating rate loan interests which generally pay interest at rates that are periodically determined by reference to a base lending rate plus a premium. The base lending rates are generally LIBOR, the prime rate offered by one or more U.S. banks or
the certificate of deposit rate. When a leveraged loan is purchased a Fund may pay an assignment fee. On an ongoing basis, a Fund may receive a commitment fee based on the undrawn portion of the underlying line of credit portion of a leveraged loan.
Prepayment penalty fees are received upon the prepayment of a leveraged loan by a borrower. Prepayment penalty, facility, commitment, consent and amendment fees are recorded to income as earned or paid. |
| L.
|
Repurchase Agreements
|
| |
Certain
Funds are parties to Master Repurchase Agreements (“Master Repo Agreements”) with select counterparties. The Master Repo Agreements include provisions for initiation of repurchase transactions, income payments, events of default, and
maintenance of collateral. |
VIRTUS STRATEGY
TRUST
NOTES TO FINANCIAL STATEMENTS (Continued)
September 30, 2021
| |
The Funds enter into
transactions, under the Master Repo Agreements, with their custodian bank or securities brokerage firms whereby they purchase securities under agreements (i.e., repurchase agreements) to resell such securities at an agreed upon price and date. The
Funds, through their custodian, take possession of securities collateralizing the repurchase agreement. Such agreements are carried at the contract amount in the financial statements, which is considered to represent fair value. The collateral that
is pledged (i.e. the securities received by the Funds), which consists primarily of U.S. government obligations and asset-backed securities, is held by the custodian bank for the benefit of the Funds until the maturity of the repurchase agreement.
Provisions of the repurchase agreements and the procedures adopted by the Funds require that the market value of the collateral, including accrued interest thereon, be sufficient in the event of default by the counterparty. If the counterparty
defaults under the Master Repo Agreements and the value of the collateral declines or if the counterparty enters an insolvency proceeding, realization of the collateral by the Funds may be delayed or limited. As of September 30, 2021, the Funds did
not hold any repurchase agreements. |
| M.
|
Warrants
|
| |
The Funds
may receive warrants. Warrants are securities that are usually issued together with a debt security or preferred stock and that give the holder the right to buy a proportionate amount of common stock at a specified price. Warrants may be freely
transferable and are often traded on major exchanges. Warrants normally have a life that is measured in years and entitle the holder to buy common stock of a company at a price that is usually higher than the market price at the time the warrant is
issued. Warrants may entail greater risks than certain other types of investments. Generally, warrants do not carry the right to receive dividends or exercise voting rights with respect to the underlying securities, and they do not represent any
rights in the assets of the issuer. In addition, their value does not necessarily change with the value of the underlying securities, and they cease to have value if they are not exercised on or before their expiration date. If the market price of
the underlying stock does not exceed the exercise price during the life of the warrant, the warrant will expire worthless. Warrants may increase the potential profit or loss to be realized from the investment as compared with investing the same
amount in the underlying securities. Similarly, the percentage increase or decrease in the value of an equity security warrant may be greater than the percentage increase or decrease in the value of the underlying common stock. Warrants may relate
to the purchase of equity or debt securities. Debt obligations with warrants attached to purchase equity securities have many characteristics of convertible securities and their prices may, to some degree, reflect the performance of the underlying
stock. Debt obligations also may be issued with warrants attached to purchase additional debt securities at the same coupon rate. A decline in interest rates would permit a Fund to sell such warrants at a profit. If interest rates rise, these
warrants would generally expire with no value. |
Note 3. Derivative Financial Instruments and
Transactions
($ reported in
thousands)
Disclosures about
derivative instruments and hedging activities are intended to enable investors to understand how and why a Fund uses derivatives, how derivatives are accounted for, and how derivative instruments affect a Fund’s results of operations and
financial position. Summarized below are such disclosures and accounting policies for each specific type of derivative instrument used by certain Funds.
| A.
|
Futures Contracts |
| |
A futures contract is an
agreement between two parties to purchase (long) or sell (short) a security at a set price for delivery on a future date. Upon entering into a futures contract, a Fund is required to pledge to the broker an amount of cash and/or securities equal to
the “initial margin” requirements of the futures exchange on which the contract is traded. Pursuant to the contract, the Fund agrees to receive from or pay to the broker an amount of cash equal to the daily fluctuation in value of the
contract. Such receipts or payments are known as variation margin and are recorded by a Fund for financial statement purposes on a daily basis as unrealized appreciation or depreciation. When the contract expires or is closed, gain or loss equal to
the difference between the value of the contract at the time it was opened and the value at the time it was closed is realized. This is presented in the Statement of Operations as net realized gain (loss) from future contracts. |
| |
During the year ended
September 30, 2021, the AllianzGI Core Plus Bond Fund, AllianzGI Global Allocation Fund, AllianzGI Global Dynamic Allocation Fund and AllianzGI Preferred Securities and Income Fund utilized futures to optimize performance by gaining exposure to
broad markets or to hedge the risk of securities within the portfolios. The potential risks of doing so are that 1) the use of futures may result in larger losses or smaller gains than the use of more traditional investments, 2) the prices of
futures and the price movements of the securities that the future is intended to simulate may not correlate well, 3) the Fund’s success in using futures will be dependent upon the subadviser’s ability to correctly predict such price
movements, 4) liquidity of futures can be adversely affected by market factors, and the prices of such securities may move in unexpected ways, and 5) if the Fund cannot close out a futures position, it may be compelled to continue to make daily cash
payments to the broker to meet margin requirements, thus increasing transaction costs. Futures contracts outstanding at period end, if any, are listed after each Fund’s Schedule of Investments. |
| B.
|
Forward Foreign Currency
Exchange Contracts |
| |
A forward
foreign currency exchange contract is an agreement between two parties to buy and sell a currency at a set exchange rate on a future date. Forward foreign currency exchange contracts, when used by a Fund, help to manage the overall exposure to the
currencies in which some of the investments held by the Fund are denominated. The contract is marked-to-market daily and the change in market value is recorded by the Fund as an unrealized appreciation or depreciation. When the contract is closed,
the Fund records a realized gain or loss equal to the difference between the value at the time it was opened and the value at the time it was closed. The use of forward foreign currency exchange contracts involves the risk that the value of the
contract changes unfavorably due to movements in the value of the referenced foreign currencies. Non-deliverable forward foreign currency exchange contracts are settled with the counterparty in U.S. dollars without the delivery of foreign currency.
|
VIRTUS STRATEGY
TRUST
NOTES TO FINANCIAL STATEMENTS (Continued)
September 30, 2021
| |
During the year ended
September 30, 2021, the AllianzGI Global Sustainability Fund, AllianzGI International Small-Cap Fund and AllianzGI Water Fund entered into forward foreign currency exchange contracts as an economic hedge against either specific transactions or
portfolio instruments or to obtain exposure to, or hedge exposure away from, foreign currencies (foreign currency exchange rate risk). Forward foreign currency contracts outstanding at period end, if any, are listed after each Fund’s Schedule
of Investments. |
| |
Forward foreign currency
contracts outstanding at period end, if any, are listed after each Fund’s Schedule of Investments. |
| C.
|
Swaps
|
| |
Certain Funds enter into swap
agreements, in which the Fund and a counterparty agree either to make periodic net payments on a specified notional amount or a net payment upon termination. Swap agreements are negotiated in the OTC market and may be entered into as a bilateral
contract (“OTC swaps”) or centrally cleared (“centrally cleared swaps”). The value of the swap is reflected on the Statements of Assets and Liabilities as “Swaps at value”. Swaps are marked-to-market daily and
changes in value are recorded as “Net change in unrealized appreciation (depreciation) on swaps” in the Statements of Operations. |
| |
Any upfront premiums paid are
recorded as assets and any upfront fees received are recorded as liabilities and are shown under “Swaps at value” in the Statements of Assets and Liabilities and are amortized over the term of the swap. When a swap is terminated, the
Fund records a realized gain or loss equal to the difference between the proceeds from (or cost of) the closing transaction and the Fund’s basis in the contract, if any. Generally, the basis of the contracts is the unamortized premium received
or paid. Cash settlements between the Fund and the counterparty are recognized as “Net realized gain (loss) on swaps” in the Statements of Operations. Swap contracts outstanding at period end, if any, are listed after each Fund’s
Schedule of Investments. |
| |
In a centrally cleared swap,
immediately following execution of the swap agreement, the swap agreement is submitted to a central counterparty (the “CCP”) and the Fund’s counterparty on the swap agreement becomes the CCP. The Fund is required to interface with
the CCP through a clearing broker. Upon entering into a centrally cleared swap, a Fund is required to deposit initial margin with the clearing broker in the form of cash or securities in an amount that varies depending on the size and risk profile
of the particular swap. |
| |
Securities deposited as
margin are designated on the Schedule of Investments and cash deposited is recorded on the Statements of Assets and Liabilities as “Deposits with prime broker”. |
| |
Swap transactions involve, to
varying degrees, elements of interest rate, credit and market risk in excess of the amounts recognized in the Statements of Assets and Liabilities. Such risks involve the possibility that there will be no liquid market for these agreements, that the
counterparty to the agreements may default on its obligation to perform or disagree as to the meaning of the contractual terms in the agreements, and that there may be unfavorable changes in interest rates and/or market values associated with these
transactions. |
| |
Credit default swaps – A Fund may either buy or sell (write) credit default swaps on single-name issuers (corporate or sovereign), a combination or basket of single-name issuers or traded indexes. Credit default swaps on single-name
issuers are agreements in which the buyer pays fixed periodic payments to the seller in consideration for a guarantee from the protection seller to make specific payment should a negative credit event take place with respect to the referenced entity
(e.g., bankruptcy, failure to pay, obligation accelerators, repudiation, moratorium or restructuring). Credit default swaps on a combination or basket of single-name issuers are agreements in which the buyer pays fixed periodic payments to the
seller in consideration for a guarantee from the protection seller to make specific payment should a negative credit event take place with respect to any of the referenced entities (e.g., bankruptcy, failure to pay, obligation accelerators,
repudiation, moratorium or restructuring). Credit default swaps on traded indexes are agreements in which the buyer pays fixed periodic payments to the seller in consideration for a guarantee from the seller to make a specific payment should a
write-down, principal or interest shortfall or default of all or individual underlying securities included in the index occurs. As a buyer, if an underlying credit event occurs, the Fund will either receive from the seller an amount equal to the
notional amount of the swap and deliver the referenced security or underlying securities comprising the index or receive a net settlement of cash equal to the notional amount of the swap less the recovery value of the security or underlying
securities comprising the index. As a seller (writer), if an underlying credit event occurs, the Fund will either pay the buyer an amount equal to the notional amount of the swap and take delivery of the referenced security or underlying securities
comprising the index or pay a net settlement of cash equal to the notional amount of the swap less the recovery value of the security or underlying securities comprising the index. The Funds may enter into credit default swaps to manage their
exposure to the market or certain sectors of the market, to reduce their risk exposure to defaults of corporate and/or sovereign issuers or to create exposure to corporate and/or sovereign issuers to which they are not otherwise exposed (credit
risk). |
| |
During the year ended
September 30, 2021, the AllianzGI Core Plus Bond Fund, AllianzGI Global Allocation Fund, AllianzGI Global Dynamic Allocation Fund and AllianzGI Preferred Securities and Income Fund utilized both single name credit default swaps and credit index
swaps to gain exposure to short individual securities or to gain exposure to a credit or asset-backed index. |
| |
Total
return swaps – Total return swaps are agreements in which there is an exchange of cash flows whereby one party commits to make payments based on the total return (coupons plus capital gains/losses) of an
underlying instrument in exchange for fixed or floating rate interest payments. To the extent the total return of the instrument or index underlying the transaction exceeds or falls short of the offsetting interest rate obligation, the Fund will
receive a payment from or make a payment to the counterparty. Certain Funds may enter into total return swaps to obtain exposure to a security or market without owning such security or investing directly in that market or to transfer the risk/return
of one market (e.g., fixed income) to another market (e.g., equity) (equity risk and/or interest rate risk). |
VIRTUS STRATEGY
TRUST
NOTES TO FINANCIAL STATEMENTS (Continued)
September 30, 2021
| |
Certain Funds may enter into
equity basket swaps to obtain exposure to a portfolio of long and short securities. Under the terms of the agreement, the swap is designed to function as a portfolio of direct investments in long and short equity or fixed income positions. This
means that the Fund has the ability to trade in and out of long and short positions within the swap and will receive all of the economic benefits and risks equivalent to direct investments in these positions such as: capital appreciation
(depreciation), corporate actions, and dividends and interest received and paid, all of which are reflected in the swap value. The swap value also includes interest charges and credits related to the notional values of the long and short positions
and cash balances within the swap. These interest charges and credits are based on defined market rates plus or minus a specified spread and are referred to herein as “financing costs”. Positions within the swap are reset periodically,
and financing costs are reset monthly. |
| |
During a reset, any
unrealized gains (losses) on positions and accrued financing costs become available for cash settlement between the Fund and the swap counterparty. Cash settlement in and out of the swap may occur at a reset date or any other date, at the discretion
of the Fund and the counterparty, over the life of the agreement, and is generally determined based on limits and thresholds established as part of the ISDA Master Agreement (defined below in “Derivative Risks”) between the Fund and the
counterparty. |
| |
The value of the swap is
derived from a combination of (i) the net value of the underlying positions, which are valued daily using the last sale or closing prices on the principal exchange on which the securities are traded; (ii) financing costs; (iii) the value of
dividends or accrued interest; (iv) cash balances within the swap; and (v) other factors, as applicable. The swap involves additional risks than if the Fund has invested in the underlying positions directly, including: the risk that changes in the
swap may not correlate perfectly with the underlying long and short securities; credit risk related to the counterparty’s failure to perform under contract terms; and liquidity risk related to the lack of a liquid market for the swap contract,
which may limit the ability of the Fund to close out its position(s). |
| |
During the year ended
September 30, 2021, AllianzGI Global Dynamic Allocation Fund utilized total return swaps to gain exposure to broad markets or to hedge the risk of individual securities within the portfolios, obtain long or short exposure to the underlying reference
instrument, obtain leverage and gain exposure to restricted markets in order to avoid the operational burden of ownership filing requirements. At September 30, 2021, the AllianzGI Global Dynamic Allocation Fund did not hold Swap Baskets. |
| |
Interest rate swaps – Interest rate swaps are agreements in which one party pays a stream of interest payments, either fixed or floating, for another party’s stream of interest payments, either fixed or floating, on the same
notional amount for a specified period of time. Certain Funds may enter into interest rate swaps to gain or reduce exposure to interest rates or to manage duration, the yield curve or interest rate risk by economically hedging the value of the fixed
rate bonds which may decrease when interest rates rise (interest rate risk). |
| |
During the year ended
September 30, 2021, the Funds did not utilize interest rate swaps. |
| |
Inflation swaps – Inflation swaps are contracts in which one party agrees to pay the cumulative percentage increase in a price index (e.g., the Consumer Price Index with respect to CPI swaps) over the term of the swap (with some
lag on the inflation index), while the other pays a compounded fixed rate. One factor that may lead to changes in the values of inflation swaps is a change in real interest rates, which are tied to the relationship between nominal interest rates and
the rate of inflation. If nominal interest rates increase at a faster rate than inflation, real interest rates may rise, which may lead to a decrease in value of an inflation swap. Certain Funds may enter into inflation swaps to hedge the inflation
risk associated with non-inflation indexed investments, thereby creating “synthetic” inflation-indexed investments. |
| |
During the year ended
September 30, 2021, the Funds did not utilize inflation swaps. |
| |
Variance swaps –Variance swaps are contracts in which two parties agree to exchange cash payments based on the difference between the stated level of variance and the actual variance realized on an underlying asset or index.
Certain Funds may enter into variance swaps in an attempt to hedge equity market risk or adjust exposure to the equity markets. |
| |
During the year ended
September 30, 2021, the AllianzGI Global Dynamic Allocation Fund utilized variance swaps to capitalize on volatility in the equity markets. |
| |
The following is a summary of
derivative instruments categorized by primary risk exposure, presented in the financial statements as of September 30, 2021: |
| |
The effect
of derivatives on the Statements of Assets and Liabilities at September 30, 2021: |
VIRTUS STRATEGY
TRUST
NOTES TO FINANCIAL STATEMENTS (Continued)
September 30, 2021
| Primary
Risk |
|
|
AllianzGI
Core Plus Bond Fund |
AllianzGI
Global Allocation Fund |
| Asset
Derivatives |
| Credit
contracts |
Swaps
at value |
$
1 |
$
36 |
| Equity
contracts |
Variation
margin payable on futures contracts(1) |
—
|
15
|
| Currency
contracts |
Variation
margin payable on futures contracts(1) |
—
|
198
|
| Interest
rate contracts |
Variation
margin payable on futures contracts(1) |
48
|
419
|
| Total
|
|
$
49 |
$
668 |
| Liability
Derivatives |
| Credit
contracts |
Swaps,
at value |
$(584)
|
$
(565) |
| Equity
contracts |
Variation
margin payable on futures contracts(1) |
—
|
(1,128)
|
| Interest
rate contracts |
Variation
margin payable on futures contracts(1) |
(38)
|
(194)
|
| Total
|
|
$(622)
|
$(1,887)
|
| Primary
Risk |
|
|
AllianzGI
Global Dynamic Allocation Fund |
AllianzGI
Preferred Securities and Income Fund |
| Asset
Derivatives |
| Equity
contracts |
Swaps
at value |
$
35 |
$
— |
| Interest
rate contracts |
Variation
margin payable on futures contracts(1) |
67
|
—
|
| Total
|
|
$
102 |
$
— |
| Liability
Derivatives |
| Credit
contracts |
Swaps
at value |
$
(80) |
$(208)
|
| Equity
contracts |
Variation
margin payable on futures contracts(1) |
(218)
|
—
|
| Equity
contracts |
Swaps
at value |
(76)
|
—
|
| Interest
rate contracts |
Variation
margin payable on futures contracts(1) |
(126)
|
(2)
|
| Total
|
|
$(500)
|
$(210)
|
(1) Includes cumulative appreciation (depreciation) on futures contracts as reported in the Schedules of Investments. Current
day’s variation margin is reported within the Statements of Assets and Liabilities.
The effect of derivatives on the Statements
of Operations for the year ended September 30, 2021:
| Primary
Risk |
|
AllianzGI
Core Plus Bond Fund |
|
AllianzGI
Emerging Markets Consumer Fund |
|
AllianzGI
Global Allocation Fund |
| Net
Realized Gain (Loss) From |
| Credit
contracts |
Swaps
|
$
(323) |
|
$—
|
|
$
43 |
| Equity
contracts |
Futures
|
—
|
|
—
|
|
10,429
|
| Equity
contracts |
Swaps
|
—
|
|
—
|
|
—
|
| Currency
contracts |
Forward
foreign currency transactions |
—
|
|
—
(1) |
|
—
(1) |
| Currency
contracts |
Futures
|
—
|
|
—
|
|
(260)
|
| Interest
rate contracts |
Futures
|
(119)
|
|
—
|
|
(1,234)
|
| Interest
rate contracts |
Swaps
|
—
|
|
—
|
|
—
|
| Total
|
|
$
(442) |
|
$—
(1) |
|
$
8,978 |
| Net
Change in Unrealized Appreciation/Depreciation on |
| Credit
contracts |
Swaps
|
$
331 |
|
$—
|
|
$
4 |
| Equity
contracts |
Futures
|
—
|
|
—
|
|
(901)
|
| Currency
contracts |
Futures
|
—
|
|
—
|
|
170
|
| Interest
rate contracts |
Futures
|
58
|
|
—
|
|
134
|
| Total
|
|
$
389 |
|
—
|
|
$
(593) |
|
(1)Amount is less than $500. |
VIRTUS STRATEGY
TRUST
NOTES TO FINANCIAL STATEMENTS (Continued)
September 30, 2021
| Primary
Risk |
|
AllianzGI
Global Dynamic Allocation Fund |
|
AllianzGI
Global Sustainability Fund |
|
AllianzGI
International Small-Cap Fund |
| Net
Realized Gain (Loss) From |
| Credit
contracts |
Swaps
|
$
45 |
|
$—
|
|
$
— |
| Equity
contracts |
Futures
|
3,545
|
|
—
|
|
—
|
| Equity
contracts |
Swaps
|
535
|
|
—
|
|
—
|
| Currency
contracts |
Forward
foreign currency transactions |
(2)
|
|
1
|
|
(3)
|
| Currency
contracts |
Futures
|
(47)
|
|
—
|
|
—
|
| Interest
rate contracts |
Futures
|
(379)
|
|
—
|
|
—
|
| Interest
rate contracts |
Swaps
|
—
|
|
—
|
|
—
|
| Total
|
|
$3,697
|
|
$
1 |
|
$
(3) |
| Net
Change in Unrealized Appreciation/Depreciation on |
| Credit
contracts |
Swaps
|
$
1 |
|
$—
|
|
$
— |
| Equity
contracts |
Futures
|
(76)
|
|
—
|
|
—
|
| Currency
contracts |
Futures
|
1
|
|
—
|
|
—
|
| Currency
contracts |
Forward
foreign currency transactions |
—
|
|
—
|
|
—
(1) |
| Interest
rate contracts |
Futures
|
(77)
|
|
—
|
|
—
|
| Interest
rate contracts |
Swaps
|
(51)
|
|
—
|
|
—
|
| Total
|
|
$
(202) |
|
$—
|
|
$
— (1) |
| Primary
Risk |
|
AllianzGI
Preferred Securities and Income Fund |
|
AllianzGI
Water Fund |
| Net
Realized Gain (Loss) From |
| Credit
contracts |
Swaps
|
$
(136) |
|
$
— |
| Currency
contracts |
Forward
foreign currency transactions |
—
|
|
(28)
|
| Interest
rate contracts |
Futures
|
(4)
|
|
—
|
| Total
|
|
$
(140) |
|
$
(28) |
| Net
Change in Unrealized Appreciation/Depreciation on |
| Credit
contracts |
Swaps
|
$
130 |
|
—
|
| Interest
rate contracts |
Futures
|
(2)
|
|
—
|
| Total
|
|
$
128 |
|
$
— |
The quarterly average values (unless
otherwise specified) of the derivatives held by the Funds in the tables shown below indicate the volume of derivative activity for each applicable Fund for the period ended September 30, 2021.
| |
AllianzGI
Core Plus Bond Fund |
|
AllianzGI
Emerging Markets Consumer Fund |
|
AllianzGI
Global Allocation Fund |
|
Futures Contracts - Long
Positions(1)
|
$
(43) |
|
$—
|
|
$
(204) |
|
Futures Contracts - Short
Positions(1)
|
52
|
|
—
|
|
338
|
| Forward
Foreign Currency Exchange Purchase Contracts(2) |
—
|
|
—
(3) |
|
—
(3) |
| Forward
Foreign Currency Exchange Sale Contracts(2) |
—
|
|
—
(3) |
|
—
(3) |
|
Credit Default Swap Agreements - Buy
Protection(2)
|
(9,056)
|
|
—
|
|
(4,213)
|
|
Credit Default Swap Agreements - Sell
Protection(2)
|
1,928
|
|
—
|
|
2,760
|
VIRTUS STRATEGY
TRUST
NOTES TO FINANCIAL STATEMENTS (Continued)
September 30, 2021
| |
AllianzGI
Global Dynamic Allocation Fund |
|
AllianzGI
Global Sustainability Fund |
|
AllianzGI
International Small-Cap Fund |
|
Futures Contracts - Long
Positions(1)
|
$
(66) |
|
$—
|
|
$
— |
|
Futures Contracts - Short
Positions(1)
|
(10)
|
|
—
|
|
—
|
|
Forward Foreign Currency Exchange Purchase
Contracts(2)
|
—
(3) |
|
—
(3) |
|
31
|
|
Forward Foreign Currency Exchange Sale
Contracts(2)
|
—
(3) |
|
—
(3) |
|
(10)
|
|
Credit Default Swap Agreements - Buy
Protection(2)
|
(2,305)
|
|
—
|
|
—
|
|
Variance Swap
Agreements(2)
|
15
|
|
—
|
|
—
|
| |
AllianzGI
Preferred Securities and Income Fund |
|
AllianzGI
Water Fund |
|
Futures Contracts - Long
Positions(1)
|
$
(1) |
|
$—
|
|
Forward Foreign Currency Exchange Purchase
Contracts(2)
|
—
|
|
—
(3) |
|
Forward Foreign Currency Exchange Sale
Contracts(2)
|
—
|
|
—
(3) |
|
Credit Default Swap Agreements - Buy
Protection(2)
|
(961)
|
|
—
|
|
Credit Default Swap Agreements - Sell
Protection(2)
|
262
|
|
—
|
| (1) Average unrealized for the period. |
| (2) Notional amount. |
|
(3) Fund had derivative activity during the period but did not have open positions at any month-end
in the period. |
| D.
|
Derivative Risks |
| |
A derivative contract may
suffer a mark-to-market loss if the value of the contract decreases due to an unfavorable change in the market rates or values of the underlying instrument. Losses can also occur if the counterparty does not perform under the contract. |
| |
A Fund’s risk of loss
from counterparty credit risk on derivatives bought or sold OTC, rather than traded on a securities exchange, is generally limited to the aggregate unrealized gain netted against any collateral held by such Fund. For OTC purchased options, each Fund
bears the risk of loss of the amount of the premiums paid plus the positive change in market values net of any collateral held by such Fund should the counterparty fail to perform under the contracts. Options written by a Fund do not typically give
rise to counterparty credit risk, as options written generally obligate the Fund, and not the counterparty to perform. |
| |
With
exchange traded purchased options and futures and centrally cleared swaps generally speaking, there is less counterparty credit risk to the Fund since the exchange or clearinghouse, as counterparty to such instruments, guarantees against a possible
default. The clearinghouse stands between the buyer and the seller of the contract; therefore, credit risk is limited to failure of the clearinghouse. While offset rights may exist under applicable law, a Fund does not have a contractual right of
offset against a clearing broker or clearinghouse in the event of a default (including the bankruptcy or insolvency) of the clearing broker or clearinghouse. Additionally, credit risk exists in exchange traded futures and centrally cleared swaps
with respect to initial and variation margin that is held in a clearing broker’s customer accounts. While clearing brokers are required to segregate customer margin from their own assets, in the event that a clearing broker becomes insolvent
or goes into bankruptcy and at that time there is a shortfall in the aggregate amount of margin held by the clearing broker for all its clients, typically the shortfall would be allocated on a pro rata basis across all the clearing broker’s
customers, potentially resulting in losses to the Fund. |
VIRTUS STRATEGY
TRUST
NOTES TO FINANCIAL STATEMENTS (Continued)
September 30, 2021
| |
In order to better define its
contractual rights and to secure rights that will help a Fund mitigate its counterparty risk, each Fund may enter into an International Swaps and Derivatives Association, Inc. Master Agreement (“ISDA Master Agreement”) or similar
agreement with its derivative contract counterparties. An ISDA Master Agreement is a bilateral agreement between a Fund and a counterparty that governs certain OTC derivatives and typically contains, among other things, collateral posting terms and
netting provisions in the event of a default and/or termination event. Under an ISDA Master Agreement, a Fund may, under certain circumstances, offset with the counterparty certain derivative financial instruments’ payables and/or receivables
with collateral held and/or posted and create one single net payment. The provisions of the ISDA Master Agreement typically permit a single net payment in the event of default including the bankruptcy or insolvency of the counterparty. However,
bankruptcy or insolvency laws of a particular jurisdiction may impose restrictions on or prohibitions against the right of offset in bankruptcy, insolvency or other events. In addition, certain ISDA Master Agreements allow counterparties to OTC
derivatives to terminate derivative contracts prior to maturity in the event a Fund’s net assets decline by a stated percentage or the Fund fails to meet the terms of its ISDA Master Agreements, which would cause the Fund to accelerate payment
of any net liability owed to the counterparty. |
| E.
|
Collateral Requirements and
Master Netting Agreements (“MNA”) |
| |
For derivatives traded under
an ISDA Master Agreement, the collateral requirements are typically calculated by netting the mark-to-market amount for each transaction under such agreement and comparing that amount to the value of any collateral currently pledged by the Funds and
the counterparty. |
| |
Cash collateral that has been
pledged to cover obligations of a Fund and cash collateral received from the counterparty, if any, is reported separately on the Statements of Assets and Liabilities as cash pledged as collateral and cash received as collateral, respectively.
Non-cash collateral pledged by a Fund, if any, is noted in the Schedules of Investments. Typically, the Funds and counterparties are not permitted to sell, re-pledge or use the collateral they receive. To the extent amounts due to a Fund from its
counterparties are not fully collateralized, contractually or otherwise, the Fund bears the risk of loss from counterparty non-performance. The Funds attempt to mitigate counterparty risk by only entering into agreements with counterparties that
they believe have the financial resources to honor their obligations and by monitoring the financial stability of those counterparties. |
| |
For financial reporting
purposes, the Funds do not offset derivative assets and derivative liabilities that are subject to netting arrangements in the Statements of Assets and Liabilities. |
| |
The
following tables present the Funds’ derivative assets and liabilities by counterparty net of amounts available for offset under a MNA and net of the related collateral received/pledged by the Funds as of September 30, 2021: |
| At
September 30, 2021, the Fund’s derivative assets and liabilities (by type) are as follows: |
|
|
|
|
| |
AllianzGI
Core Plus Bond Fund |
|
AllianzGI
Global Allocation Fund |
| |
Assets
|
|
Liabilities
|
|
Assets
|
|
Liabilities
|
| Futures
contracts |
$—
|
|
$
1 |
|
$—
|
|
$
351 |
| Swaps
|
—
|
|
583
|
|
—
|
|
529
|
Total
derivative assets and
liabilities in the Statements of
Assets and Liabilities |
$—
|
|
$
584 |
|
$—
|
|
$
880 |
Derivatives
not subject to a MNA
or similar agreement |
—
|
|
(584)
|
|
—
|
|
(880)
|
Total
assets and liabilities
subject to a MNA |
$—
|
|
$
— |
|
$—
|
|
$
— |
VIRTUS STRATEGY
TRUST
NOTES TO FINANCIAL STATEMENTS (Continued)
September 30, 2021
| At
September 30, 2021, the Fund’s derivative assets and liabilities (by type) are as follows: |
|
|
|
|
| |
AllianzGI
Global Dynamic Allocation Fund |
|
AllianzGI
Preferred Securities and Income Fund |
| |
Assets
|
|
Liabilities
|
|
Assets
|
|
Liabilities
|
| Futures
contracts |
$—
|
|
$
89 |
|
$—
(1) |
|
$
— |
| Swaps
|
—
|
|
121
|
|
—
|
|
208
|
Total
derivative assets and
liabilities in the Statements of
Assets and Liabilities |
$—
|
|
$
210 |
|
$
—(1) |
|
$
208 |
Derivatives
not subject to a MNA
or similar agreement |
—
|
|
(251)
|
|
—
|
|
(208)
|
Total
assets and liabilities
subject to a MNA |
$—
|
|
$
(41) |
|
$
— |
|
$
— |
|
(1) |
Amount
is less than $500. |
The following tables present the
Funds’ derivative assets and liabilities by counterparty net of amounts available for offset under a MNA and net of the related collateral received/pledged by the Funds as of September 30, 2021.
| AllianzGI
Global Dynamic Allocation Fund |
| Counterparty
|
|
Derivative
Assets
Subject to
a MNA by
Counterparty |
|
Derivatives
Available
for Offset |
|
Non-Cash
Collateral
Received |
|
Cash
Collateral
Received |
|
Net
Amount of
Derivative
Assets |
| Citibank
N.A. |
|
$
6 |
|
$
(6) |
|
$—
|
|
$—
|
|
$—
|
|
UBS Securities
LLC
|
|
29
|
|
(29)
|
|
—
|
|
—
|
|
—
|
|
Total
|
|
$35
|
|
$
(35) |
|
$—
|
|
$—
|
|
$—
|
| Counterparty
|
|
Derivatives
Liabilities
Subject to
a MNA by
Counterparty |
|
Derivatives
Available
for Offset |
|
Non-cash
Collateral
Pledged |
|
Cash
Collateral
Pledged |
|
Net
Amount of
Derivative
Liabilities |
| Citibank
N.A. |
|
$47
|
|
$
(6) |
|
$—
|
|
$—
|
|
$41
|
|
UBS Securities
LLC
|
|
29
|
|
(29)
|
|
—
|
|
—
|
|
—
|
|
Total
|
|
$76
|
|
$(35)
|
|
$—
|
|
$—
|
|
$41
|
(1) Amount is less than $500.
Note 4. Investment Advisory Fees and Related Party
Transactions
($ reported in
thousands)
| A.
|
Investment Adviser |
| |
Effective February 1, 2021,
the Adviser, an indirect, wholly-owned subsidiary of Virtus Investment Partners, Inc. (“Virtus”), is the investment adviser to the Funds. The Adviser manages the Funds’ investment programs and general operations of the Funds,
including oversight of the Funds’ subadvisers. Prior to February 1, 2021, Allianz Global Investors U.S. LLC (“AllianzGI U.S.”) served as the investment adviser to the Funds. |
| |
As
compensation for its services to the Funds, the Adviser is entitled to a fee, which is calculated daily and paid monthly based upon the following annual rates as a percentage of the average daily net assets of each Fund: |
VIRTUS STRATEGY
TRUST
NOTES TO FINANCIAL STATEMENTS (Continued)
September 30, 2021
| Fund
|
|
Advisory
Fee |
|
AllianzGI Convertible
Fund
|
|
0.57%
|
|
AllianzGI Core Plus Bond
Fund
|
|
0.30
|
|
AllianzGI Emerging Markets Consumer
Fund
|
|
0.85
|
|
AllianzGI Global Allocation
Fund
|
|
0.70
|
|
AllianzGI Global Dynamic Allocation
Fund
|
|
0.70
|
|
AllianzGI Global Sustainability
Fund
|
|
0.80
|
|
AllianzGI High Yield Bond
Fund
|
|
0.48
|
|
AllianzGI International Small-Cap
Fund
|
|
1.00
|
|
AllianzGI Preferred Securities and Income
Fund
|
|
0.45
|
|
AllianzGI Short Duration High Income
Fund
|
|
0.48
|
|
AllianzGI Water
Fund
|
|
0.95
|
|
NFJ Emerging Markets Value
Fund
|
|
0.85
|
Prior to February
1, 2021, the Funds paid monthly advisory fees to AllianzGI U.S., in its former capacity as investment adviser to the funds, at the same annual rates.
During the year ended September 30, 2021,
the AllianzGI Global Allocation Fund invested a portion of its assets in AllianzGI Global Sustainability Fund, AllianzGI Best Styles Global Managed Volatility Fund, AllianzGI Green Bond Fund, AllianzGI Performance Fee Managed Futures Strategy Fund
and AllianzGI Global Dynamic Allocation Fund invested a portion of its assets in AllianzGI International Growth Fund, each an affiliated mutual fund. In order to avoid any duplication of advisory fees, the Adviser voluntarily waived its advisory
fees in an amount equal to that which would otherwise be paid by each Fund on the assets invested in the AllianzGI Global Sustainability Fund and AllianzGI International Growth Fund. For the period ended September 30, 2021, the waiver amounted to
$809 and $10 for AllianzGI Global Allocation Fund and AllianzGI Global Dynamic Allocation Fund, respectively. This waiver was in addition to the expense limitation and/or fee waiver covered elsewhere in these financial statements and is included in
the Statements of Operations in “Less expenses reimbursed and/or waived by investment adviser and/or distributor.”
| B.
|
Subadvisers
|
| |
The
subadvisers manage the investments of each Fund for which they are paid a fee by the Adviser. A list of the subadvisers and the Funds they serve as of the end of the period is as follows: |
| Fund
|
|
Subadviser
|
|
AllianzGI Convertible Fund
|
|
AllianzGI
U.S. |
|
AllianzGI Core Plus Bond Fund
|
|
AllianzGI
U.S. |
|
AllianzGI Emerging Markets Consumer Fund
|
|
AllianzGI
U.S. |
|
AllianzGI Global Allocation Fund
|
|
AllianzGI
U.S. |
|
AllianzGI Global Dynamic Allocation Fund
|
|
AllianzGI
U.S. |
|
AllianzGI Global Sustainability Fund
|
|
AllianzGI
U.S. |
|
AllianzGI High Yield Bond Fund
|
|
AllianzGI
U.S. |
|
AllianzGI International Small-Cap Fund
|
|
AllianzGI
U.S. |
|
AllianzGI Preferred Securities and Income Fund
|
|
AllianzGI
U.S. |
|
AllianzGI Short Duration High Income Fund
|
|
AllianzGI
U.S. |
|
AllianzGI Water Fund
|
|
AllianzGI
U.S. |
|
NFJ Emerging Markets Value Fund
|
|
NFJ
(1) |
|
(1) |
NFJ
Investment Group, LLC (“NFJ”), which is an indirect, wholly-owned subsidiary of Virtus. |
| C.
|
Expense Limitations |
| |
Effective
February 1, 2021, the Adviser has contractually agreed to limit each Fund’s annual total operating expenses, subject to the exceptions listed below, so that such expenses do not exceed, on an annualized basis, the following respective
percentages of average daily net assets through February 1, 2023. Following the contractual period, the Adviser may discontinue these expense limitation arrangements at any time. The waivers and reimbursements are accrued daily and received monthly.
|
VIRTUS STRATEGY
TRUST
NOTES TO FINANCIAL STATEMENTS (Continued)
September 30, 2021
| Fund
|
|
Class
A |
|
Class
C |
|
Class
P |
|
Institutional
Class |
|
Class
R6 |
|
Administrative
Class |
|
AllianzGI Convertible
Fund
|
|
0.96 %
|
|
1.73 %
|
|
0.71
% |
|
0.71
% |
|
N/A
|
|
0.93
% |
|
AllianzGI Core Plus Bond
Fund
|
|
N/A
|
|
N/A
|
|
0.35
|
|
0.30
|
|
0.25 %
|
|
N/A
|
|
AllianzGI Emerging Markets Consumer
Fund
|
|
1.40
|
|
N/A
|
|
N/A
|
|
1.05
|
|
N/A
|
|
N/A
|
|
AllianzGI Global Allocation
Fund
|
|
0.52
|
|
1.27
|
|
0.32
|
|
0.29
|
|
0.22
|
|
0.47
|
|
AllianzGI Global Dynamic Allocation
Fund
|
|
0.82
|
|
1.58
|
|
0.68
|
|
0.54
|
|
0.54
|
|
0.79
|
|
AllianzGI Global Sustainability
Fund
|
|
0.94
|
|
N/A
|
|
0.79
|
|
0.69
|
|
N/A
|
|
N/A
|
|
AllianzGI High Yield Bond
Fund
|
|
1.12
|
|
1.81
|
|
0.80
|
|
0.83
|
|
N/A
|
|
1.00
|
|
AllianzGI International Small-Cap
Fund
|
|
1.25
|
|
2.00
|
|
1.10
|
|
1.04
|
|
1.00
|
|
N/A
|
|
AllianzGI Preferred Securities and Income
Fund
|
|
N/A
|
|
N/A
|
|
0.60
|
|
0.55
|
|
0.50
|
|
N/A
|
|
AllianzGI Short Duration High Income
Fund
|
|
0.86
|
|
1.11
|
|
0.65
|
|
0.60
|
|
0.55
|
|
N/A
|
|
AllianzGI Water
Fund
|
|
1.22
|
|
1.97
|
|
0.94
|
|
0.93
|
|
N/A
|
|
N/A
|
|
NFJ Emerging Markets Value
Fund
|
|
1.14
|
|
1.89
|
|
0.99
|
|
0.89
|
|
N/A
|
|
N/A
|
The
exclusions include front-end or contingent deferred loads, taxes, leverage and borrowing expenses (such as commitment, amendment and renewal expenses on credit or redemption facilities), interest, brokerage commissions, expenses incurred in
connection with any merger or reorganization, unusual or infrequently occurring expenses (such as litigation), acquired fund fees and expenses, and dividend expenses, if any.
Prior to February 1, 2021, the Funds were
contractually limited to:
| |
|
|
|
|
| Fund
|
|
Management
Fee Waiver |
|
Class
A |
|
Class
C |
|
Class
P |
|
Institutional
Class |
|
Class
R6 |
|
Administrative
Class |
|
AllianzGI Convertible
Fund
|
|
N/A
|
|
0.96%
|
|
1.73%
|
|
0.74%
|
|
0.71%
|
|
N/A
|
|
0.93%
|
|
AllianzGI Core Plus Bond
Fund
|
|
N/A
|
|
N/A
|
|
N/A
|
|
0.35
|
|
0.30
|
|
0.25%
|
|
N/A
|
|
AllianzGI Emerging Markets Consumer
Fund
|
|
N/A
|
|
1.39
|
|
N/A
|
|
N/A
|
|
1.05
|
|
N/A
|
|
N/A
|
|
AllianzGI Global Allocation
Fund
|
|
0.55%
|
|
1.01
|
|
1.76
|
|
0.81
|
|
0.74
|
|
0.71
|
|
0.96
|
|
AllianzGI Global Dynamic Allocation
Fund
|
|
0.55
|
|
1.01
|
|
1.78
|
|
0.84
|
|
0.74
|
|
0.74
|
|
0.99
|
|
AllianzGI Global Sustainability
Fund
|
|
N/A
|
|
0.94
|
|
N/A
|
|
0.79
|
|
0.69
|
|
N/A
|
|
N/A
|
|
AllianzGI High Yield Bond
Fund
|
|
N/A
|
|
N/A
|
|
N/A
|
|
N/A
|
|
N/A
|
|
N/A
|
|
N/A
|
|
AllianzGI International Small-Cap
Fund
|
|
N/A
|
|
1.25
|
|
2.00
|
|
1.10
|
|
1.04
|
|
1.00
|
|
N/A
|
|
AllianzGI Preferred Securities and Income
Fund
|
|
N/A
|
|
N/A
|
|
N/A
|
|
0.60
|
|
0.55
|
|
0.50
|
|
N/A
|
|
AllianzGI Short Duration High Income
Fund
|
|
N/A
|
|
0.86
|
|
1.11
|
|
0.65
|
|
0.60
|
|
0.55
|
|
N/A
|
|
AllianzGI Water
Fund
|
|
N/A
|
|
1.22
|
|
1.97
|
|
0.94
|
|
0.93
|
|
N/A
|
|
N/A
|
|
NFJ Emerging Markets Value
Fund
|
|
N/A
|
|
1.14
|
|
1.89
|
|
0.98
|
|
0.89
|
|
N/A
|
|
N/A
|
| D.
|
Expense Recapture |
| |
Under
certain conditions, the Adviser may recapture operating expenses reimbursed or fees waived under these arrangements within three years after the date on which such amounts were incurred or waived. A Fund must pay its ordinary operating expenses
before the Adviser is entitled to any reimbursement and must remain in compliance with any applicable expense limitations or, if none, the expense limitation in effect at the time of the waiver or reimbursement. All or a portion of the following
Adviser reimbursed expenses may be recaptured by the fiscal year ending September 30: |
| |
|
Expiration
|
|
|
| Fund
|
|
2022
|
|
2023
|
|
2024
|
|
Total
|
| AllianzGI
Convertible Fund |
|
|
|
|
|
|
|
|
|
Class A
|
|
$
— |
|
$
— |
|
$
302 |
|
$
302 |
|
Class
C
|
|
—
|
|
—
|
|
72
|
|
72
|
|
Class
P
|
|
—
|
|
—
|
|
882
|
|
882
|
|
Institutional
Class
|
|
—
|
|
—
|
|
1,161
|
|
1,161
|
|
Administrative
Class
|
|
—
|
|
—
|
|
14
|
|
14
|
| AllianzGI
Core Plus Bond Fund |
|
|
|
|
|
|
|
|
|
Class
P
|
|
—
(1) |
|
—
(1) |
|
—
(1) |
|
—
(1) |
|
Institutional
Class
|
|
2
|
|
—
(1) |
|
1
|
|
3
|
|
Class
R6
|
|
291
|
|
287
|
|
247
|
|
825
|
VIRTUS STRATEGY
TRUST
NOTES TO FINANCIAL STATEMENTS (Continued)
September 30, 2021
| |
|
Expiration
|
|
|
| Fund
|
|
2022
|
|
2023
|
|
2024
|
|
Total
|
| AllianzGI
Emerging Markets Consumer Fund |
|
|
|
|
|
|
|
|
|
Class A
|
|
$
— |
|
$
— (1) |
|
$
1 |
|
$
1 |
|
Institutional
Class
|
|
105
|
|
167
|
|
197
|
|
469
|
| AllianzGI
Global Allocation Fund |
|
|
|
|
|
|
|
|
|
Class A
|
|
—
(1) |
|
87
|
|
193
|
|
280
|
|
Class
C
|
|
3
|
|
6
|
|
11
|
|
20
|
|
Class
P
|
|
—
|
|
8
|
|
24
|
|
32
|
|
Institutional
Class
|
|
—
|
|
11
|
|
29
|
|
40
|
|
Class
R6
|
|
2
|
|
407
|
|
840
|
|
1,249
|
|
Administrative
Class
|
|
—
|
|
—
|
|
1
|
|
1
|
| AllianzGI
Global Dynamic Allocation Fund |
|
|
|
|
|
|
|
|
|
Class A
|
|
6
|
|
9
|
|
23
|
|
38
|
|
Class
C
|
|
2
|
|
4
|
|
6
|
|
12
|
|
Class
P
|
|
32
|
|
5
|
|
12
|
|
49
|
|
Institutional
Class
|
|
36
|
|
72
|
|
141
|
|
249
|
|
Class
R6
|
|
453
|
|
592
|
|
339
|
|
1,384
|
|
Administrative
Class
|
|
—
(1) |
|
—
(1) |
|
—
(1) |
|
—
(1) |
| AllianzGI
Global Sustainability Fund |
|
|
|
|
|
|
|
|
|
Class A
|
|
6
|
|
8
|
|
19
|
|
33
|
|
Class
P
|
|
106
|
|
78
|
|
69
|
|
253
|
|
Institutional
Class
|
|
74
|
|
355
|
|
528
|
|
957
|
| AllianzGI
High Yield Bond Fund |
|
|
|
|
|
|
|
|
|
Class A
|
|
—
|
|
—
|
|
1
|
|
1
|
|
Class
C
|
|
—
|
|
—
|
|
1
|
|
1
|
|
Class
P
|
|
—
|
|
—
|
|
6
|
|
6
|
|
Institutional
|
|
—
|
|
—
|
|
1
|
|
1
|
|
Administrative
Class
|
|
—
|
|
—
|
|
1
|
|
1
|
| AllianzGI
International Small-Cap Fund |
|
|
|
|
|
|
|
|
|
Class A
|
|
38
|
|
21
|
|
23
|
|
82
|
|
Class
C
|
|
7
|
|
4
|
|
3
|
|
14
|
|
Class
P
|
|
113
|
|
57
|
|
54
|
|
224
|
|
Institutional
Class
|
|
237
|
|
157
|
|
178
|
|
572
|
|
Class
R6
|
|
129
|
|
128
|
|
148
|
|
405
|
| AllianzGI
Preferred Securities and Income Fund |
|
|
|
|
|
|
|
|
|
Class
P
|
|
—
(1) |
|
—
(1) |
|
—
(1) |
|
—
(1) |
|
Institutional
Class
|
|
31
|
|
41
|
|
52
|
|
124
|
|
Class
R6
|
|
192
|
|
138
|
|
106
|
|
436
|
| AllianzGI
Short Duration High Income Fund |
|
|
|
|
|
|
|
|
|
Class A
|
|
—
|
|
—
|
|
105
|
|
105
|
|
Class
C
|
|
—
|
|
17
|
|
80
|
|
97
|
|
Class
P
|
|
—
|
|
154
|
|
284
|
|
438
|
|
Institutional
Class
|
|
—
|
|
88
|
|
289
|
|
377
|
|
Class
R6
|
|
—
|
|
6
|
|
21
|
|
27
|
| AllianzGI
Water Fund |
|
|
|
|
|
|
|
|
|
Class A
|
|
164
|
|
323
|
|
571
|
|
1,058
|
|
Class
C
|
|
69
|
|
123
|
|
157
|
|
349
|
|
Class
P
|
|
303
|
|
463
|
|
921
|
|
1,687
|
|
Institutional
Class
|
|
231
|
|
333
|
|
756
|
|
1,320
|
| NFJ
Emerging Markets Value Fund |
|
|
|
|
|
|
|
|
|
Class A
|
|
76
|
|
71
|
|
62
|
|
209
|
|
Class
C
|
|
5
|
|
5
|
|
4
|
|
14
|
|
Class
P
|
|
6
|
|
10
|
|
47
|
|
63
|
|
Institutional
Class
|
|
402
|
|
437
|
|
491
|
|
1,330
|
|
(1) |
Amount
is less than $500. |
During the period ended September 30, 2021,
the Adviser recaptured expenses previously waived for the following Funds:
VIRTUS STRATEGY
TRUST
NOTES TO FINANCIAL STATEMENTS (Continued)
September 30, 2021
| Fund
|
|
Class
A |
|
Class
C |
|
Class
R6 |
|
Total
|
|
AllianzGI Convertible
Fund
|
|
$22
|
|
$12
|
|
$
— |
|
$
34 |
|
AllianzGI Core Plus Bond
Fund
|
|
—
|
|
—
|
|
23
|
|
23
|
|
AllianzGI Emerging Markets Consumer
Fund
|
|
1
|
|
—
|
|
—
|
|
1
|
|
AllianzGI Global Dynamic Allocation
Fund
|
|
1
|
|
—
(1) |
|
48
|
|
49
|
|
AllianzGI Global Sustainability
Fund
|
|
1
|
|
—
|
|
—
|
|
1
|
|
AllianzGI High Yield Bond
Fund
|
|
18
|
|
2
|
|
—
|
|
20
|
|
AllianzGI International Small-Cap
Fund
|
|
—
|
|
—
(1) |
|
15
|
|
15
|
|
AllianzGI Preferred Securities and Income
Fund
|
|
—
|
|
—
|
|
15
|
|
15
|
|
AllianzGI Short Duration High Income
Fund
|
|
5
|
|
—
|
|
—
|
|
5
|
|
NFJ Emerging Markets Value
Fund
|
|
2
|
|
—
|
|
—
|
|
2
|
|
(1) |
Amount
is less than $500. |
| E.
|
Distributor
|
| |
Effective February 1, 2021,
VP Distributors, LLC (“VP Distributors”), an indirect, wholly-owned subsidiary of Virtus, serves as the distributor of each Fund’s shares. VP Distributors has advised the Funds that for the 8 months ended September 30, 2021, it
retained net commissions of $302 for Class A shares and CDSC of $8 and 15 for Class A shares and Class C shares, respectively. Prior to February 1, 2021, Allianz Global Investors Distributors LLC, the former Distributor, served as the principal
underwriter of each class of the Trust’s shares. |
| |
In addition, each Fund pays VP
Distributors 12b-1 fees under a 12b-1 Plan as a percentage of the average daily net assets of each respective class at the annual rates of 0.25% for Class A shares, and 1.00% for Class C shares (0.90% for AllianzGl High Yield Bond Fund and 0.50% for
AllianzGI Short Duration High Income Fund). Administrative Class shares pay a 0.25% Administrative Distribution fee. Class P shares, Institutional Class shares, Class R6 shares, and Administrative Class shares are not subject to a 12b-1 Plan. Prior
to February 1, 2021, each Fund paid Allianz Global Investors Distributors LLC 12b-1 fees under a 12b-1 Plan as a percentage of the average daily net assets of each respective class at the same annual rates disclosed above. |
| |
Under certain circumstances,
shares of certain Virtus Mutual Funds may be exchanged for shares of the same class of certain other Virtus Mutual Funds on the basis of the relative NAV per share at the time of the exchange. On exchanges with share classes that carry a CDSC, the
CDSC schedule of the original shares purchased continues to apply. |
| F.
|
Administrator and Transfer
Agent |
| |
Effective February 1, 2021,
Virtus Fund Services, LLC, an indirect, wholly-owned subsidiary of Virtus, serves as the administrator and transfer agent to the Funds. Prior to February 1, 2021, in its capacity as investment adviser to the Funds during the period, in addition to
its investment advisory services, AllianzGI U.S. provided administrative services to the Funds. Prior to February 1, 2021, State Street Bank served as transfer agent to the Funds. |
| |
For the fiscal year
(“period”) ended September 30, 2021, the Funds incurred administration fees totaling $3,402 which are included in the Statements of Operations within the line item “Administration and accounting fees.” The fees are calculated
daily and paid monthly. |
| |
For the period ended
September 30, 2021, the Funds incurred transfer agent fees totaling $1,517 which are included in the Statements of Operations within the line item “Transfer agent fees and expenses.” The fees are calculated daily and paid monthly.
|
| G.
|
Payments from Affiliates
|
| |
During the period ended
September 30, 2021, AllianzGI U.S. reimbursed AllianzGI Global Allocation Fund, AllianzGI Global Dynamic Allocation Fund, and AllianzGI Preferred Securities and Income Fund for losses. |
| H.
|
Investments with Affiliates
|
| |
The Funds are permitted to
purchase assets from or sell assets to certain related affiliates under specified conditions outlined in procedures adopted by the Board. The procedures have been designed to ensure that any purchase or sale of assets by the Fund from or to another
fund or portfolio that are, or could be, considered an affiliate by virtue of having a common investment adviser (or affiliated investment advisers), common Trustees and/or common officers comply with Rule 17a-7 under the 1940 Act. Further, as
defined under the procedures, each transaction is effected at the current market price. During the period ended September 30, 2021, the Funds (except AllianzGI Short Duration Income Fund) did not engage in any transactions pursuant to Rule 17a-7
under the 1940 Act. |
| |
During the year ended
September 30, 2021, AllianzGI Short Duration High Income Fund engaged in Rule 17a-7 securities purchase transactions of $8,755. There were no Rule 17a-7 securities sales or realized gain loss on securities. |
| |
Outside of Rule 17a-7
transactions, other investments with affiliated issuers are separately reported in this footnote. An affiliated issuer includes any company in which the Fund held 5% or more of a company’s outstanding voting shares at any point during the
period, as well as other circumstances where an investment adviser or subadviser to the Fund is deemed to exercise, directly or indirectly, a certain level of control over the company. |
| |
A summary
of the Funds’ total long-term and short-term purchases and sales of the respective shares of the affiliated investments during the period ended September 30, 2021, is as follows: |
VIRTUS STRATEGY
TRUST
NOTES TO FINANCIAL STATEMENTS (Continued)
September 30, 2021
| |
Value,
beginning
of period |
|
Purchases
(1) |
|
Sales
proceeds |
|
Net
realized
gain
(loss)
on
affiliated
securities |
|
Net
change in
unrealized
appreciation
(depreciation)
on affiliated
securities |
|
Value,
end of
period |
|
Shares
|
|
Dividend
income |
|
Distributions
of realized
gains |
| AllianzGI
Global Allocation Fund |
| Exchange-Traded
Fund—0.9% |
|
PIMCO 1-5 Year U.S. TIPS Index
ETF
|
$
2,479 |
|
$
— |
|
$
— |
|
$
— |
|
$
44 |
|
$
2,523 |
|
46,000
|
|
$
96 |
|
$
— |
| Affiliated
Mutual Fund—32.3% |
|
AllianzGI Global Sustainability Fund Institutional
Shares(2)
|
105,061
|
|
3,235
|
|
35,388
|
|
6,727
|
|
12,919
|
|
92,554
|
|
3,521,823
|
|
824
|
|
2,411
|
|
AllianzGI Best Styles Global Managed Volatility
Fund
|
26,045
|
|
2,596
|
|
26,829
|
|
(425)
|
|
(1,387)
|
|
—
|
|
—
|
|
952
|
|
1,644
|
|
AllianzGI Green Bond
Fund
|
24,369
|
|
29
|
|
24,876
|
|
1,114
|
|
(636)
|
|
—
|
|
—
|
|
29
|
|
—
|
|
AllianzGI Performance Fee Managed Futures Strategy
Fund
|
24,606
|
|
2,983
|
|
27,920
|
|
(4,010)
|
|
4,341
|
|
—
|
|
—
|
|
565
|
|
—
|
| Total
|
$182,560
|
|
$8,843
|
|
$115,013
|
|
$
3,406 |
|
$15,281
|
|
$95,077
|
|
|
|
$2,466
|
|
$4,055
|
| (1) |
Includes reinvested
dividends from income and capital gain distributions. |
|
(2) |
Shares
of this fund are publicly offered, and its prospectus and annual report are publicly available. |
| |
Value,
beginning
of period |
|
Purchases
|
|
Sales
proceeds |
|
Net
realized
gain
(loss)
on
affiliated
securities |
|
Net
change in
unrealized
appreciation
(depreciation)
on affiliated
securities |
|
Value,
end of
period |
|
Shares
|
|
Dividend
income |
|
Distributions
of realized
gains |
| AllianzGI
Global Dynamic Allocation Fund |
| Corporate
Bonds and Notes—0.2% |
|
AllianzGI International Growth Fund(1)
|
$4,191
|
|
$4,257
|
|
$4,550
|
|
$(2,547)
|
|
$
(1,351) |
|
$—
|
|
—
|
|
$121
|
|
$4,137
|
| Total
|
$4,191
|
|
$4,257
|
|
$4,550
|
|
$(2,547)
|
|
$
(1,351) |
|
$—
|
|
|
|
$121
|
|
$4,137
|
|
(1) |
Shares
of this fund are publicly offered, and its prospectus and annual report are publicly available. |
VIRTUS STRATEGY
TRUST
NOTES TO FINANCIAL STATEMENTS (Continued)
September 30, 2021
| |
Value,
beginning
of period |
|
Purchases
|
|
Sales
proceeds |
|
Net
realized
gain
(loss)
on
affiliated
securities |
|
Net
change in
unrealized
appreciation
(depreciation)
on affiliated
securities |
|
Value,
end of
period |
|
Shares
|
|
Dividend
income |
|
Distributions
of realized
gains |
| AllianzGI
High Yield Bond Fund |
| Common
Stocks—0.0% |
| LiveStyle,
Inc.(1),(2),(3),(4)(5) |
$
— |
|
$—
|
|
$
— |
|
$
— |
|
$
— |
|
$
— |
|
67,983
|
|
$—
|
|
$—
|
| Preferred
Stock—2.7% |
| LiveStyle,
Inc.(1),(2),(3),(4) |
4,400
|
|
—
|
|
(3,864)
|
|
76
|
|
1,282
|
|
1,894
|
|
18,941
|
|
—
|
|
—
|
| Warrant—0.0%
|
|
LiveStyle, Inc. Series
C(1),(2),(3)(4)
|
—
|
|
—
|
|
—
|
|
—
|
|
—
|
|
—
|
|
14,500
|
|
—
|
|
—
|
| Total
|
$4,400
|
|
$—
|
|
$(3,864)
|
|
$76
|
|
$1,282
|
|
$1,894
|
|
|
|
$—
|
|
$—
|
|
(1) |
Shares
of this fund are publicly offered, and its prospectus and annual report are publicly available. |
|
(2) |
A
member of the Fund’s portfolio management team is a member of the board of directors of LiveStyle, Inc. The Fund’s aggregate value of investments in LiveStyle, Inc. represents 2.71% of net assets. See Note 4H in the Notes to Financial
Statements. |
|
(3) |
The
value of this security was determined using significant unobservable inputs and is reported as a Level 3 security in the Fair Value Hierarchy table located after the Schedule of Investments. |
|
(4) |
Non-income
producing. |
|
(5) |
All
or a portion of the security is restricted. |
| I.
|
Trustee Compensation |
| |
The Trust provides a deferred
compensation plan for its Trustees who receive compensation from the Trust. Under the deferred compensation plan, Trustees may elect to defer all or a portion of their compensation. Amounts deferred are retained by the Trust, and then, to the extent
permitted by the 1940 Act, in turn, may be invested in the shares of affiliated or unaffiliated mutual funds selected by the participating Trustees. Investments in such instruments are included in “Other assets” in the Statements of
Assets and Liabilities at September 30, 2021. |
| |
In calendar year 2018 and
certain other periods prior to January 1, 2020, the Funds maintained a different deferred compensation plan pursuant to which each Trustee who was not affiliated with AllianzGI U.S. had the opportunity to elect not to receive all or a portion of his
or her fees from the respective Fund on a current basis, but instead to receive in a subsequent period chosen by the Trustee an amount equal to the value of such compensation if such compensation had been invested in one or more series of Virtus
Investment Trust (then known as Allianz Funds) and Virtus Strategy Trust (then known as Allianz Funds Multi-Strategy Trust) selected by the such Trustee from and after the normal payment dates for such compensation. The deferred compensation program
was closed to new deferrals effective January 1, 2020, and all Trustee fees earned with respect to service in calendar year 2020 were paid in cash, on a current basis. The Trustees do not currently receive any pension or retirement benefits from the
Funds. |
| |
In
addition to the Trustee fees deferred in the current period, the Funds still have obligations with respect to Trustee fees deferred in 2018 and in other periods prior to January 1, 2020, and will continue to have such obligations until all deferred
Trustee fees are paid out pursuant to the terms of the applicable deferred compensation plan. |
Note 5. Purchases and Sales of Securities
($ reported in thousands)
Purchases and sales of securities (excluding
U.S. Government and agency securities, forward currency contracts, written options, and short-term securities) during the period ended September 30, 2021, were as follows:
| |
Purchases
|
|
Sales
|
|
AllianzGI Convertible
Fund
|
$3,852,181
|
|
$3,470,155
|
|
AllianzGI Core Plus Bond
Fund
|
92,399
|
|
91,056
|
|
AllianzGI Emerging Markets Consumer
Fund
|
10,064
|
|
44,182
|
|
AllianzGI Global Allocation
Fund
|
169,438
|
|
193,932
|
|
AllianzGI Global Dynamic Allocation
Fund
|
74,784
|
|
71,413
|
|
AllianzGI Global Sustainability
Fund
|
43,626
|
|
104,058
|
|
AllianzGI High Yield Bond
Fund
|
110,817
|
|
133,560
|
|
AllianzGI International Small-Cap
Fund
|
41,490
|
|
59,950
|
|
AllianzGI Preferred Securities and Income
Fund
|
28,690
|
|
33,977
|
VIRTUS STRATEGY
TRUST
NOTES TO FINANCIAL STATEMENTS (Continued)
September 30, 2021
| |
Purchases
|
|
Sales
|
|
AllianzGI Short Duration High Income
Fund
|
$
509,301 |
|
$
605,878 |
|
AllianzGI Water
Fund
|
398,858
|
|
271,986
|
|
NFJ Emerging Markets Value
Fund
|
84,710
|
|
86,408
|
Purchases and
sales of long-term U.S. Government and agency securities during the period ended September 30, 2021, were as follows:
| |
Purchases
|
|
Sales
|
|
AllianzGI Core Plus Bond
Fund
|
$105,404
|
|
$
99,341 |
|
AllianzGI Global Allocation
Fund
|
283,008
|
|
250,258
|
|
AllianzGI Global Dynamic Allocation
Fund
|
16,912
|
|
17,168
|
|
AllianzGI Preferred Securities and Income
Fund
|
346
|
|
144
|
Note 6. Capital Share
Transactions
(reported in
thousands)
Transactions in shares of
capital stock, during the periods ended as indicated below, were as follows:
| |
AllianzGI
Convertible Fund |
|
AllianzGI
Core Plus Bond Fund |
| |
Year
Ended
September 30, 2021 |
|
Year
Ended
September 30, 2020 |
|
Year
Ended
September 30, 2021 |
|
Year
Ended
September 30, 2020 |
| |
SHARES
|
|
AMOUNT
|
|
SHARES
|
|
AMOUNT
|
|
SHARES
|
|
AMOUNT
|
|
SHARES
|
|
AMOUNT
|
| Class
A |
|
|
|
|
|
|
|
|
|
|
|
|
|
|
|
| Shares
sold |
4,895
|
|
$
218,499 |
|
5,360
|
|
$
176,137 |
|
—
|
|
$
— |
|
—
|
|
$
— |
| Reinvestment
of distributions |
437
|
|
19,176
|
|
120
|
|
3,677
|
|
—
|
|
—
|
|
—
|
|
—
|
| Shares
repurchased |
(3,238)
|
|
(145,505)
|
|
(1,289)
|
|
(41,935)
|
|
—
|
|
—
|
|
—
|
|
—
|
| Net
Increase / (Decrease) |
2,094
|
|
$
92,170 |
|
4,191
|
|
$
137,879 |
|
—
|
|
$
— |
|
—
|
|
$
— |
| Class
C |
|
|
|
|
|
|
|
|
|
|
|
|
|
|
|
| Shares
sold |
864
|
|
$
39,144 |
|
1,497
|
|
$
49,314 |
|
—
|
|
$
— |
|
—
|
|
$
— |
| Reinvestment
of distributions |
155
|
|
6,908
|
|
63
|
|
1,943
|
|
—
|
|
—
|
|
—
|
|
—
|
| Shares
repurchased |
(831)
|
|
(38,310)
|
|
(744)
|
|
(24,394)
|
|
—
|
|
—
|
|
—
|
|
—
|
| Net
Increase / (Decrease) |
188
|
|
$
7,742 |
|
816
|
|
$
26,863 |
|
—
|
|
$
— |
|
—
|
|
$
— |
| Class
R* |
|
|
|
|
|
|
|
|
|
|
|
|
|
|
|
| Shares
sold |
23
|
|
$
1,046 |
|
2
|
|
$
62 |
|
—
|
|
$
— |
|
—
|
|
$
— |
| Reinvestment
of distributions |
—
(1) |
|
22
|
|
—
(1) |
|
7
|
|
—
|
|
—
|
|
—
|
|
—
|
| Shares
repurchased |
(30)
|
|
(1,386)
|
|
—
(1) |
|
(2)
|
|
—
|
|
—
|
|
—
|
|
—
|
| Net
Increase / (Decrease) |
(7)
|
|
$
(318) |
|
2
|
|
$
67 |
|
—
|
|
$
— |
|
—
|
|
$
— |
| Class
P |
|
|
|
|
|
|
|
|
|
|
|
|
|
|
|
| Shares
sold |
9,111
|
|
$
394,111 |
|
13,169
|
|
$
406,955 |
|
—
|
|
$
— |
|
—
|
|
$
— |
| Reinvestment
of distributions |
970
|
|
41,125
|
|
335
|
|
9,976
|
|
—
(1) |
|
1
|
|
—
(1) |
|
1
|
| Shares
repurchased |
(6,374)
|
|
(276,789)
|
|
(4,393)
|
|
(132,223)
|
|
—
|
|
—
|
|
—
|
|
—
|
| Net
Increase / (Decrease) |
3,707
|
|
$
158,447 |
|
9,111
|
|
$
284,708 |
|
—
(1) |
|
$
1 |
|
—
(1) |
|
$
1 |
| Institutional
Class |
|
|
|
|
|
|
|
|
|
|
|
|
|
|
|
| Shares
sold |
19,695
|
|
$
860,125 |
|
22,968
|
|
$
718,717 |
|
106
|
|
$
1,645 |
|
2
|
|
$
26 |
| Reinvestment
of distributions |
2,171
|
|
93,445
|
|
771
|
|
23,162
|
|
—
(1) |
|
7
|
|
—
(1) |
|
1
|
| Shares
repurchased |
(12,761)
|
|
(560,179)
|
|
(9,115)
|
|
(290,448)
|
|
(1)
|
|
(21)
|
|
—
|
|
—
|
| Net
Increase / (Decrease) |
9,105
|
|
$
393,391 |
|
14,624
|
|
$
451,431 |
|
105
|
|
$
1,631 |
|
2
|
|
$
27 |
| Class
R6 |
|
|
|
|
|
|
|
|
|
|
|
|
|
|
|
| Shares
sold |
—
|
|
$
— |
|
—
|
|
$
— |
|
816
|
|
$
12,727 |
|
135
|
|
$
2,173 |
| Reinvestment
of distributions |
—
|
|
—
|
|
—
|
|
—
|
|
322
|
|
5,032
|
|
235
|
|
3,643
|
| Shares
repurchased |
—
|
|
—
|
|
—
|
|
—
|
|
(783)
|
|
(12,030)
|
|
(1,014)
|
|
(16,281)
|
| Net
Increase / (Decrease) |
—
|
|
$
— |
|
—
|
|
$
— |
|
355
|
|
$
5,729 |
|
(644)
|
|
$
(10,465) |
VIRTUS STRATEGY
TRUST
NOTES TO FINANCIAL STATEMENTS (Continued)
September 30, 2021
| |
AllianzGI
Convertible Fund |
|
AllianzGI
Core Plus Bond Fund |
| |
Year
Ended
September 30, 2021 |
|
Year
Ended
September 30, 2020 |
|
Year
Ended
September 30, 2021 |
|
Year
Ended
September 30, 2020 |
| |
SHARES
|
|
AMOUNT
|
|
SHARES
|
|
AMOUNT
|
|
SHARES
|
|
AMOUNT
|
|
SHARES
|
|
AMOUNT
|
| Administrative
Class |
|
|
|
|
|
|
|
|
|
|
|
|
|
|
|
| Shares
sold |
340
|
|
$
14,345 |
|
346
|
|
$
12,318 |
|
—
|
|
$
— |
|
—
|
|
$
— |
| Reinvestment
of distributions |
33
|
|
1,436
|
|
2
|
|
55
|
|
—
|
|
—
|
|
—
|
|
—
|
| Shares
repurchased |
(154)
|
|
(6,829)
|
|
(18)
|
|
(551)
|
|
—
|
|
—
|
|
—
|
|
—
|
| Net
Increase / (Decrease) |
219
|
|
$
8,952 |
|
330
|
|
$
11,822 |
|
—
|
|
$
— |
|
—
|
|
$
— |
| |
AllianzGI
Emerging Markets Consumer Fund |
|
AllianzGI
Global Allocation Fund |
| |
Year
Ended
September 30, 2021 |
|
Year
Ended
September 30, 2020 |
|
Year
Ended
September 30, 2021 |
|
Year
Ended
September 30, 2020 |
| |
SHARES
|
|
AMOUNT
|
|
SHARES
|
|
AMOUNT
|
|
SHARES
|
|
AMOUNT
|
|
SHARES
|
|
AMOUNT
|
| Class
A |
|
|
|
|
|
|
|
|
|
|
|
|
|
|
|
| Shares
sold |
2
|
|
$
30 |
|
4
|
|
$
60 |
|
587
|
|
$
6,730 |
|
340
|
|
$
3,634 |
| Reinvestment
of distributions |
—
(1) |
|
2
|
|
—
(1) |
|
1
|
|
234
|
|
2,657
|
|
343
|
|
3,622
|
| Shares
repurchased |
(—)
(1) |
|
(2)
|
|
(5)
|
|
(69)
|
|
(856)
|
|
(9,958)
|
|
(954)
|
|
(10,096)
|
| Net
Increase / (Decrease) |
2
|
|
$
30 |
|
(1)
|
|
$
(8) |
|
(35)
|
|
$
(571) |
|
(271)
|
|
$
(2,840) |
| Class
C |
|
|
|
|
|
|
|
|
|
|
|
|
|
|
|
| Shares
sold |
—
|
|
$
— |
|
—
|
|
$
— |
|
30
|
|
$
357 |
|
97
|
|
$
1,083 |
| Reinvestment
of distributions |
—
|
|
—
|
|
—
|
|
—
|
|
14
|
|
165
|
|
34
|
|
370
|
| Shares
repurchased |
—
|
|
—
|
|
—
|
|
—
|
|
(148)
|
|
(1,796)
|
|
(384)
|
|
(4,209)
|
| Net
Increase / (Decrease) |
—
|
|
$
— |
|
—
|
|
$
— |
|
(104)
|
|
$
(1,274) |
|
(253)
|
|
$
(2,756) |
| Class
R* |
|
|
|
|
|
|
|
|
|
|
|
|
|
|
|
| Reinvestment
of distributions |
—
|
|
$
— |
|
—
|
|
$
— |
|
—
(1) |
|
$
1 |
|
—
(1) |
|
$
2 |
| Shares
repurchased |
—
|
|
—
|
|
—
|
|
—
|
|
(2)
|
|
(22)
|
|
—
|
|
—
|
| Net
Increase / (Decrease) |
—
|
|
$
— |
|
—
|
|
$
— |
|
(2)
|
|
$
(21) |
|
—
(1) |
|
$
2 |
| Class
P |
|
|
|
|
|
|
|
|
|
|
|
|
|
|
|
| Shares
sold |
—
|
|
$
— |
|
—
|
|
$
— |
|
239
|
|
$
2,742 |
|
355
|
|
$
3,697 |
| Reinvestment
of distributions |
—
|
|
—
|
|
—
|
|
—
|
|
17
|
|
188
|
|
25
|
|
263
|
| Shares
repurchased |
—
|
|
—
|
|
—
|
|
—
|
|
(192)
|
|
(2,186)
|
|
(454)
|
|
(4,755)
|
| Net
Increase / (Decrease) |
—
|
|
$
— |
|
—
|
|
$
— |
|
64
|
|
$
744 |
|
(74)
|
|
$
(795) |
| Institutional
Class |
|
|
|
|
|
|
|
|
|
|
|
|
|
|
|
| Shares
sold |
67
|
|
$
1,219 |
|
42
|
|
$
611 |
|
222
|
|
$
2,548 |
|
441
|
|
$
4,729 |
| Reinvestment
of distributions |
25
|
|
422
|
|
27
|
|
388
|
|
62
|
|
697
|
|
51
|
|
539
|
| Shares
repurchased |
(2,095)
|
|
(35,782)
|
|
(738)
|
|
(9,372)
|
|
(243)
|
|
(2,814)
|
|
(170)
|
|
(1,748)
|
| Net
Increase / (Decrease) |
(2,003)
|
|
$
(34,141) |
|
(669)
|
|
$
(8,373) |
|
41
|
|
$
431 |
|
322
|
|
$
3,520 |
| Class
R6 |
|
|
|
|
|
|
|
|
|
|
|
|
|
|
|
| Shares
sold |
—
|
|
$
— |
|
—
|
|
$
— |
|
4,901
|
|
$
55,745 |
|
3,423
|
|
$
35,014 |
| Reinvestment
of distributions |
—
|
|
—
|
|
—
|
|
—
|
|
1,466
|
|
16,125
|
|
2,366
|
|
24,244
|
| Shares
repurchased |
—
|
|
—
|
|
—
|
|
—
|
|
(5,443)
|
|
(61,888)
|
|
(11,129)
|
|
(116,406)
|
| Net
Increase / (Decrease) |
—
|
|
$
— |
|
—
|
|
$
— |
|
924
|
|
$
9,982 |
|
(5,340)
|
|
$
(57,148) |
| Administrative
Class |
|
|
|
|
|
|
|
|
|
|
|
|
|
|
|
| Shares
sold |
—
|
|
$
— |
|
—
|
|
$
— |
|
1
|
|
$
12 |
|
—
(1) |
|
$
2 |
| Reinvestment
of distributions |
—
|
|
—
|
|
—
|
|
—
|
|
—
(1) |
|
3
|
|
—
(1) |
|
2
|
| Shares
repurchased |
—
|
|
—
|
|
—
|
|
—
|
|
(—)
(1) |
|
(2)
|
|
—
(1) |
|
—
(2) |
| Net
Increase / (Decrease) |
—
|
|
$
— |
|
—
|
|
$
— |
|
1
|
|
$
13 |
|
—
(1) |
|
$
4 |
VIRTUS STRATEGY
TRUST
NOTES TO FINANCIAL STATEMENTS (Continued)
September 30, 2021
| |
AllianzGI
Global Dynamic Allocation Fund |
|
AllianzGI
Global Sustainability Fund |
| |
Year
Ended
September 30, 2021 |
|
Year
Ended
September 30, 2020 |
|
Year
Ended
September 30, 2021 |
|
Year
Ended
September 30, 2020 |
| |
SHARES
|
|
AMOUNT
|
|
SHARES
|
|
AMOUNT
|
|
SHARES
|
|
AMOUNT
|
|
SHARES
|
|
AMOUNT
|
| Class
A |
|
|
|
|
|
|
|
|
|
|
|
|
|
|
|
| Shares
sold |
140
|
|
$
2,397 |
|
22
|
|
$
418 |
|
106
|
|
$
2,495 |
|
62
|
|
$
1,167 |
| Reinvestment
of distributions |
27
|
|
409
|
|
10
|
|
177
|
|
4
|
|
80
|
|
1
|
|
27
|
| Shares
repurchased |
(37)
|
|
(647)
|
|
(47)
|
|
(815)
|
|
(14)
|
|
(341)
|
|
(31)
|
|
(594)
|
| Net
Increase / (Decrease) |
130
|
|
$
2,159 |
|
(15)
|
|
$
(220) |
|
96
|
|
$
2,234 |
|
32
|
|
$
600 |
| Class
C |
|
|
|
|
|
|
|
|
|
|
|
|
|
|
|
| Shares
sold |
29
|
|
$
500 |
|
7
|
|
$
130 |
|
—
|
|
$
— |
|
—
|
|
$
— |
| Reinvestment
of distributions |
9
|
|
143
|
|
4
|
|
64
|
|
—
|
|
—
|
|
—
|
|
—
|
| Shares
repurchased |
(12)
|
|
(203)
|
|
(13)
|
|
(236)
|
|
—
|
|
—
|
|
—
|
|
—
|
| Net
Increase / (Decrease) |
26
|
|
$
440 |
|
(2)
|
|
$
(42) |
|
—
|
|
$
— |
|
—
|
|
$
— |
| Class
R* |
|
|
|
|
|
|
|
|
|
|
|
|
|
|
|
| Shares
sold |
—
(1) |
|
$
—(2) |
|
—
(1) |
|
$
9 |
|
—
|
|
$
— |
|
—
|
|
$
— |
| Reinvestment
of distributions |
—
(1) |
|
7
|
|
1
|
|
11
|
|
—
|
|
—
|
|
—
|
|
—
|
| Shares
repurchased |
(2)
|
|
(75)
|
|
(5)
|
|
(89)
|
|
—
|
|
—
|
|
—
|
|
—
|
| Net
Increase / (Decrease) |
(2)
|
|
$
(68) |
|
(4)
|
|
$
(69) |
|
—
|
|
$
— |
|
—
|
|
$
— |
| Class
P |
|
|
|
|
|
|
|
|
|
|
|
|
|
|
|
| Shares
sold |
902
|
|
$
16,799 |
|
—
(1) |
|
$
—(2) |
|
433
|
|
$
9,715 |
|
739
|
|
$
14,120 |
| Reinvestment
of distributions |
1
|
|
19
|
|
—
(1) |
|
5
|
|
45
|
|
1,008
|
|
25
|
|
491
|
| Shares
repurchased |
(4)
|
|
(78)
|
|
(597)
|
|
(11,737)
|
|
(1,607)
|
|
(36,816)
|
|
(600)
|
|
(11,854)
|
| Net
Increase / (Decrease) |
899
|
|
$
16,740 |
|
(597)
|
|
$
(11,732) |
|
(1,129)
|
|
$
(26,093) |
|
164
|
|
$
2,757 |
| Institutional
Class |
|
|
|
|
|
|
|
|
|
|
|
|
|
|
|
| Shares
sold |
69
|
|
$
1,217 |
|
172
|
|
$
3,130 |
|
395
|
|
$
9,491 |
|
8,161
|
|
$
155,934 |
| Reinvestment
of distributions |
212
|
|
3,318
|
|
54
|
|
1,011
|
|
177
|
|
4,085
|
|
128
|
|
2,565
|
| Shares
repurchased |
(172)
|
|
(3,013)
|
|
(59)
|
|
(1,075)
|
|
(2,304)
|
|
(55,986)
|
|
(2,297)
|
|
(47,936)
|
| Net
Increase / (Decrease) |
109
|
|
$
1,522 |
|
167
|
|
$
3,066 |
|
(1,732)
|
|
$
(42,410) |
|
5,992
|
|
$
110,563 |
| Class
R6 |
|
|
|
|
|
|
|
|
|
|
|
|
|
|
|
| Shares
sold |
76
|
|
$
1,274 |
|
560
|
|
$
10,326 |
|
—
|
|
$
— |
|
—
|
|
$
— |
| Reinvestment
of distributions |
545
|
|
8,451
|
|
650
|
|
11,996
|
|
—
|
|
—
|
|
—
|
|
—
|
| Shares
repurchased |
(1,010)
|
|
(18,029)
|
|
(6,193)
|
|
(116,363)
|
|
—
|
|
—
|
|
—
|
|
—
|
| Net
Increase / (Decrease) |
(389)
|
|
$
(8,304) |
|
(4,983)
|
|
$
(94,041) |
|
—
|
|
$
— |
|
—
|
|
$
— |
| Administrative
Class |
|
|
|
|
|
|
|
|
|
|
|
|
|
|
|
| Reinvestment
of distributions |
—
(1) |
|
$
7 |
|
—
(1) |
|
$
2 |
|
—
|
|
$
— |
|
—
|
|
$
— |
| Net
Increase / (Decrease) |
—
(1) |
|
$
7 |
|
—
(1) |
|
$
2 |
|
—
|
|
$
— |
|
—
|
|
$
— |
| |
AllianzGI
High Yield Bond Fund |
|
AllianzGI
International Small-Cap Fund |
| |
Year
Ended
September 30, 2021 |
|
Year
Ended
September 30, 2020 |
|
Year
Ended
September 30, 2021 |
|
Year
Ended
September 30, 2020 |
| |
SHARES
|
|
AMOUNT
|
|
SHARES
|
|
AMOUNT
|
|
SHARES
|
|
AMOUNT
|
|
SHARES
|
|
AMOUNT
|
| Class
A |
|
|
|
|
|
|
|
|
|
|
|
|
|
|
|
| Shares
sold |
458
|
|
$
4,003 |
|
427
|
|
$
3,690 |
|
41
|
|
$
1,673 |
|
14
|
|
$
463 |
| Reinvestment
of distributions |
107
|
|
943
|
|
127
|
|
1,077
|
|
1
|
|
43
|
|
2
|
|
66
|
| Shares
repurchased |
(664)
|
|
(5,803)
|
|
(1,165)
|
|
(10,073)
|
|
(31)
|
|
(1,258)
|
|
(61)
|
|
(1,973)
|
| Net
Increase / (Decrease) |
(99)
|
|
$
(857) |
|
(611)
|
|
$
(5,306) |
|
11
|
|
$
458 |
|
(45)
|
|
$
(1,444) |
VIRTUS STRATEGY
TRUST
NOTES TO FINANCIAL STATEMENTS (Continued)
September 30, 2021
| |
AllianzGI
High Yield Bond Fund |
|
AllianzGI
International Small-Cap Fund |
| |
Year
Ended
September 30, 2021 |
|
Year
Ended
September 30, 2020 |
|
Year
Ended
September 30, 2021 |
|
Year
Ended
September 30, 2020 |
| |
SHARES
|
|
AMOUNT
|
|
SHARES
|
|
AMOUNT
|
|
SHARES
|
|
AMOUNT
|
|
SHARES
|
|
AMOUNT
|
| Class
C |
|
|
|
|
|
|
|
|
|
|
|
|
|
|
|
| Shares
sold |
12
|
|
$
100 |
|
72
|
|
$
609 |
|
—
(1) |
|
$
5 |
|
—
(1) |
|
$
7 |
| Reinvestment
of distributions |
14
|
|
123
|
|
20
|
|
167
|
|
—
(1) |
|
5
|
|
—
(1) |
|
1
|
| Shares
repurchased |
(237)
|
|
(2,084)
|
|
(177)
|
|
(1,534)
|
|
(13)
|
|
(505)
|
|
(10)
|
|
(304)
|
| Net
Increase / (Decrease) |
(211)
|
|
$
(1,861) |
|
(85)
|
|
$
(758) |
|
(13)
|
|
$
(495) |
|
(10)
|
|
$
(296) |
| Class
R* |
|
|
|
|
|
|
|
|
|
|
|
|
|
|
|
| Shares
sold |
21
|
|
$
385 |
|
99
|
|
$
793 |
|
5
|
|
$
182 |
|
6
|
|
$
181 |
| Reinvestment
of distributions |
1
|
|
9
|
|
3
|
|
26
|
|
—
(1) |
|
12
|
|
1
|
|
20
|
| Shares
repurchased |
(86)
|
|
(921)
|
|
(115)
|
|
(932)
|
|
(32)
|
|
(1,226)
|
|
(15)
|
|
(407)
|
| Net
Increase / (Decrease) |
(64)
|
|
$
(527) |
|
(13)
|
|
$
(113) |
|
(27)
|
|
$
(1,032) |
|
(8)
|
|
$
(206) |
| Class
P |
|
|
|
|
|
|
|
|
|
|
|
|
|
|
|
| Shares
sold |
154
|
|
$
1,291 |
|
350
|
|
$
2,858 |
|
11
|
|
$
449 |
|
19
|
|
$
581 |
| Reinvestment
of distributions |
39
|
|
323
|
|
73
|
|
595
|
|
3
|
|
125
|
|
6
|
|
221
|
| Shares
repurchased |
(965)
|
|
(8,040)
|
|
(583)
|
|
(4,727)
|
|
(67)
|
|
(2,752)
|
|
(330)
|
|
(10,375)
|
| Net
Increase / (Decrease) |
(772)
|
|
$
(6,426) |
|
(160)
|
|
$
(1,274) |
|
(53)
|
|
$
(2,178) |
|
(305)
|
|
$
(9,573) |
| Institutional
Class |
|
|
|
|
|
|
|
|
|
|
|
|
|
|
|
| Shares
sold |
755
|
|
$
6,287 |
|
3,085
|
|
$
25,394 |
|
131
|
|
$
5,782 |
|
78
|
|
$
2,458 |
| Reinvestment
of distributions |
288
|
|
2,421
|
|
487
|
|
3,938
|
|
12
|
|
470
|
|
16
|
|
569
|
| Shares
repurchased |
(2,526)
|
|
(21,164)
|
|
(6,152)
|
|
(50,574)
|
|
(369)
|
|
(16,219)
|
|
(413)
|
|
(14,070)
|
| Net
Increase / (Decrease) |
(1,483)
|
|
$
(12,456) |
|
(2,580)
|
|
$
(21,242) |
|
(226)
|
|
$
(9,967) |
|
(319)
|
|
$
(11,043) |
| Class
R6 |
|
|
|
|
|
|
|
|
|
|
|
|
|
|
|
| Shares
sold |
—
|
|
$
— |
|
—
|
|
$
— |
|
188
|
|
$
7,870 |
|
361
|
|
$
11,900 |
| Reinvestment
of distributions |
—
|
|
—
|
|
—
|
|
—
|
|
11
|
|
431
|
|
20
|
|
690
|
| Shares
repurchased |
—
|
|
—
|
|
—
|
|
—
|
|
(307)
|
|
(12,744)
|
|
(397)
|
|
(12,984)
|
| Net
Increase / (Decrease) |
—
|
|
$
— |
|
—
|
|
$
— |
|
(108)
|
|
$
(4,443) |
|
(16)
|
|
$
(394) |
| Administrative
Class |
|
|
|
|
|
|
|
|
|
|
|
|
|
|
|
| Shares
sold |
9
|
|
$
79 |
|
1
|
|
$
4 |
|
—
|
|
$
— |
|
—
|
|
$
— |
| Reinvestment
of distributions |
1
|
|
5
|
|
—
(1) |
|
1
|
|
—
|
|
—
|
|
—
|
|
—
|
| Shares
repurchased |
(—)
(1) |
|
(1)
|
|
—
(1) |
|
(2)
|
|
—
|
|
—
|
|
—
|
|
—
|
| Net
Increase / (Decrease) |
10
|
|
$
83 |
|
1
|
|
$
3 |
|
—
|
|
$
— |
|
—
|
|
$
— |
| |
AllianzGI
Preferred Securities and Income Fund |
|
AllianzGI
Short Duration High Income Fund |
| |
Year
Ended
September 30, 2021 |
|
Year
Ended
September 30, 2020 |
|
Year
Ended
September 30, 2021 |
|
Year
Ended
September 30, 2020 |
| |
SHARES
|
|
AMOUNT
|
|
SHARES
|
|
AMOUNT
|
|
SHARES
|
|
AMOUNT
|
|
SHARES
|
|
AMOUNT
|
| Class
A |
|
|
|
|
|
|
|
|
|
|
|
|
|
|
|
| Shares
sold |
—
|
|
$
— |
|
—
|
|
$
— |
|
3,905
|
|
$
57,197 |
|
5,584
|
|
$
79,620 |
| Reinvestment
of distributions |
—
|
|
—
|
|
—
|
|
—
|
|
515
|
|
7,488
|
|
396
|
|
5,521
|
| Shares
repurchased |
—
|
|
—
|
|
—
|
|
—
|
|
(4,217)
|
|
(61,645)
|
|
(5,521)
|
|
(75,975)
|
| Net
Increase / (Decrease) |
—
|
|
$
— |
|
—
|
|
$
— |
|
203
|
|
$
3,040 |
|
459
|
|
$
9,166 |
| Class
C |
|
|
|
|
|
|
|
|
|
|
|
|
|
|
|
| Shares
sold |
—
|
|
$
— |
|
—
|
|
$
— |
|
833
|
|
$
12,143 |
|
1,834
|
|
$
26,112 |
| Reinvestment
of distributions |
—
|
|
—
|
|
—
|
|
—
|
|
289
|
|
4,205
|
|
292
|
|
4,077
|
| Shares
repurchased |
—
|
|
—
|
|
—
|
|
—
|
|
(2,354)
|
|
(34,436)
|
|
(3,641)
|
|
(50,733)
|
| Net
Increase / (Decrease) |
—
|
|
$
— |
|
—
|
|
$
— |
|
(1,232)
|
|
$
(18,088) |
|
(1,515)
|
|
$
(20,544) |
VIRTUS STRATEGY
TRUST
NOTES TO FINANCIAL STATEMENTS (Continued)
September 30, 2021
| |
AllianzGI
Preferred Securities and Income Fund |
|
AllianzGI
Short Duration High Income Fund |
| |
Year
Ended
September 30, 2021 |
|
Year
Ended
September 30, 2020 |
|
Year
Ended
September 30, 2021 |
|
Year
Ended
September 30, 2020 |
| |
SHARES
|
|
AMOUNT
|
|
SHARES
|
|
AMOUNT
|
|
SHARES
|
|
AMOUNT
|
|
SHARES
|
|
AMOUNT
|
| Class
P |
|
|
|
|
|
|
|
|
|
|
|
|
|
|
|
| Shares
sold |
—
|
|
$
— |
|
—
|
|
$
— |
|
3,929
|
|
$
57,210 |
|
69,045
|
|
$
992,957 |
| Reinvestment
of distributions |
—
(1) |
|
1
|
|
—
(1) |
|
1
|
|
789
|
|
11,420
|
|
1,519
|
|
21,456
|
| Shares
repurchased |
—
|
|
—
|
|
—
|
|
—
|
|
(6,711)
|
|
(96,847)
|
|
(86,028)
|
|
(1,196,630)
|
| Net
Increase / (Decrease) |
—
(1) |
|
$
1 |
|
—
(1) |
|
$
1 |
|
(1,993)
|
|
$
(28,217) |
|
(15,464)
|
|
$
(182,217) |
| Institutional
Class |
|
|
|
|
|
|
|
|
|
|
|
|
|
|
|
| Shares
sold |
134
|
|
$
2,161 |
|
851
|
|
$
12,388 |
|
6,818
|
|
$
99,100 |
|
14,160
|
|
$
199,833 |
| Reinvestment
of distributions |
23
|
|
363
|
|
20
|
|
290
|
|
1,199
|
|
17,303
|
|
1,287
|
|
17,827
|
| Shares
repurchased |
(255)
|
|
(4,016)
|
|
(545)
|
|
(8,319)
|
|
(11,210)
|
|
(162,053)
|
|
(21,664)
|
|
(294,426)
|
| Net
Increase / (Decrease) |
(98)
|
|
$
(1,492) |
|
326
|
|
$
4,359 |
|
(3,193)
|
|
$
(45,650) |
|
(6,217)
|
|
$
(76,766) |
| Class
R6 |
|
|
|
|
|
|
|
|
|
|
|
|
|
|
|
| Shares
sold |
157
|
|
$
2,500 |
|
409
|
|
$
6,297 |
|
1,142
|
|
$
16,434 |
|
2,854
|
|
$
38,291 |
| Reinvestment
of distributions |
54
|
|
854
|
|
75
|
|
1,119
|
|
111
|
|
1,606
|
|
154
|
|
2,118
|
| Shares
repurchased |
(426)
|
|
(6,599)
|
|
(209)
|
|
(3,158)
|
|
(2,224)
|
|
(32,132)
|
|
(3,281)
|
|
(44,779)
|
| Net
Increase / (Decrease) |
(215)
|
|
$
(3,245) |
|
275
|
|
$
4,258 |
|
(971)
|
|
$
(14,092) |
|
(273)
|
|
$
(4,370) |
| |
AllianzGI
Water Fund |
|
NFJ
Emerging Markets Value Fund |
| |
Year
Ended
September 30, 2021 |
|
Year
Ended
September 30, 2020 |
|
Year
Ended
September 30, 2021 |
|
Year
Ended
September 30, 2020 |
| |
SHARES
|
|
AMOUNT
|
|
SHARES
|
|
AMOUNT
|
|
SHARES
|
|
AMOUNT
|
|
SHARES
|
|
AMOUNT
|
| Class
A |
|
|
|
|
|
|
|
|
|
|
|
|
|
|
|
| Shares
sold |
3,288
|
|
$
70,114 |
|
3,111
|
|
$
52,001 |
|
149
|
|
$
3,152 |
|
320
|
|
$
5,098 |
| Reinvestment
of distributions |
148
|
|
2,885
|
|
277
|
|
4,678
|
|
8
|
|
156
|
|
10
|
|
163
|
| Shares
repurchased |
(2,044)
|
|
(42,810)
|
|
(2,903)
|
|
(46,930)
|
|
(207)
|
|
(4,316)
|
|
(431)
|
|
(6,651)
|
| Net
Increase / (Decrease) |
1,392
|
|
$
30,189 |
|
485
|
|
$
9,749 |
|
(50)
|
|
$
(1,008) |
|
(101)
|
|
$
(1,390) |
| Class
C |
|
|
|
|
|
|
|
|
|
|
|
|
|
|
|
| Shares
sold |
625
|
|
$
12,587 |
|
423
|
|
$
6,789 |
|
5
|
|
$
98 |
|
2
|
|
$
30 |
| Reinvestment
of distributions |
48
|
|
889
|
|
90
|
|
1,443
|
|
—
(1) |
|
1
|
|
—
(1) |
|
6
|
| Shares
repurchased |
(885)
|
|
(17,878)
|
|
(1,574)
|
|
(24,807)
|
|
(16)
|
|
(321)
|
|
(11)
|
|
(179)
|
| Net
Increase / (Decrease) |
(212)
|
|
$
(4,402) |
|
(1,061)
|
|
$
(16,575) |
|
(11)
|
|
$
(222) |
|
(9)
|
|
$
(143) |
| Class
P |
|
|
|
|
|
|
|
|
|
|
|
|
|
|
|
| Shares
sold |
3,860
|
|
$
82,828 |
|
3,910
|
|
$
63,391 |
|
250
|
|
$
5,327 |
|
364
|
|
$
5,921 |
| Reinvestment
of distributions |
170
|
|
3,301
|
|
258
|
|
4,359
|
|
6
|
|
129
|
|
4
|
|
66
|
| Shares
repurchased |
(2,607)
|
|
(55,162)
|
|
(3,425)
|
|
(54,724)
|
|
(132)
|
|
(2,754)
|
|
(100)
|
|
(1,631)
|
| Net
Increase / (Decrease) |
1,423
|
|
$
30,967 |
|
743
|
|
$
13,026 |
|
124
|
|
$
2,702 |
|
268
|
|
$
4,356 |
| Institutional
Class |
|
|
|
|
|
|
|
|
|
|
|
|
|
|
|
| Shares
sold |
5,872
|
|
$
122,088 |
|
5,087
|
|
$
81,466 |
|
897
|
|
$
18,893 |
|
2,327
|
|
$
36,701 |
| Reinvestment
of distributions |
236
|
|
4,506
|
|
328
|
|
5,435
|
|
88
|
|
1,795
|
|
83
|
|
1,388
|
| Shares
repurchased |
(3,158)
|
|
(65,115)
|
|
(3,134)
|
|
(49,299)
|
|
(1,274)
|
|
(26,547)
|
|
(1,837)
|
|
(29,433)
|
| Net
Increase / (Decrease) |
2,950
|
|
$
61,479 |
|
2,281
|
|
$
37,602 |
|
(289)
|
|
$
(5,859) |
|
573
|
|
$
8,656 |
| *
|
All
Class R shares were converted into Class A shares. These transaction are included as subscriptions of Class A shares and redemptions of Class R shares in the tables above. |
|
(1) |
Amount
is less than 500 shares. |
|
(2) |
Amount
is less than $500. |
VIRTUS STRATEGY
TRUST
NOTES TO FINANCIAL STATEMENTS (Continued)
September 30, 2021
Note 7. 10% Shareholders
As of September 30, 2021, certain Funds had
individual shareholder account(s) and/or omnibus shareholder account(s) (comprised of a group of individual shareholders), which individually amounted to more than 10% of the total shares outstanding of such Fund as detailed below:
| |
%
of Shares
Outstanding |
|
Number
of
Accounts |
|
AllianzGI Convertible
Fund
|
16%
|
|
1
|
|
AllianzGI Core Plus Bond
Fund
|
92
|
|
1
* |
|
AllianzGI Emerging Markets Consumer
Fund
|
97
|
|
2
|
|
AllianzGI Global Allocation
Fund
|
40
|
|
2
|
|
AllianzGI Global Dynamic Allocation
Fund
|
80
|
|
3
|
|
AllianzGI Global Sustainability
Fund
|
85
|
|
2
* |
|
AllianzGI High Yield Bond
Fund
|
64
|
|
4
* |
|
AllianzGI International Small-Cap
Fund
|
70
|
|
2
|
|
AllianzGI Preferred Securities and Income
Fund
|
81
|
|
3
* |
|
AllianzGI Short Duration High Income
Fund
|
11
|
|
1
|
|
NFJ Emerging Markets Value
Fund
|
71
|
|
1
|
|
* |
Includes
affiliated shareholder account(s). |
Note 8. Credit and Market Risk and Asset
Concentration
Local, regional or
global events such as war, acts of terrorism, the spread of infectious illness or other public health issue, recessions, or other events could have a significant impact on a Fund and its investments, including hampering the ability of each
Fund’s portfolio manager(s) to invest each Fund’s assets as intended.
In July 2017, the head of the United Kingdom
Financial Conduct Authority announced the intention to phase out the use of LIBOR by the end of 2021. However, subsequent announcements by the FCA, the LIBOR administrator and other regulators indicate that it is possible that certain LIBORs may
continue beyond 2021 and certain of the most widely used LIBORs may continue until mid-2023. The Funds may be exposed to financial instruments tied to LIBOR to determine payment obligations, financing terms, hedging strategies or investment value.
The expected discontinuation of LIBOR could have a significant impact on the financial markets and may present a material risk for certain market participants, including the Funds. Abandonment of or modifications to LIBOR could lead to significant
short- and long-term uncertainty and market instability. The risks associated with this discontinuation and transition may be exacerbated if the work necessary to effect an orderly transition to an alternative reference rate is not completed in a
timely manner. It remains uncertain how such changes would be implemented and the effects such changes would have on the Funds, issuers of instruments in which the Funds invest, and the financial markets generally.
In countries with limited or developing
markets, investments may present greater risks than in more developed markets and the prices of such investments may be volatile. The consequences of political, social or economic changes in these markets may have disruptive effects on the market
prices of these investments and the income they generate, as well as a Fund’s ability to repatriate such amounts.
High-yield/high-risk securities typically
entail greater price volatility and/or principal and interest rate risk. There is a greater chance that an issuer will not be able to make principal and interest payments on time. Analysis of the creditworthiness of issuers of high-yield/high-risk
securities may be complex, and as a result, it may be more difficult for the Adviser and/or subadviser to accurately predict risk.
Many municipalities insure repayment for
their obligations. Although bond insurance reduces the risk of loss due to default by an issuer, such bonds remain subject to the risk that the market may fluctuate for other reasons, and there is no assurance that the insurance company will meet
its obligations. Insured securities have been identified in the Schedule of Investments. A real or perceived decline in creditworthiness of a bond insurer can have an adverse impact on the value of insured bonds held in the Funds.
Certain Funds may invest a high percentage
of their assets in specific sectors of the market in the pursuit of their investment objectives. Fluctuations in these sectors of concentration may have a greater impact on a Fund, positive or negative, than if the Fund did not concentrate its
investments in such sectors.
At
September 30, 2021, the following Funds held securities issued by various companies in specific sectors as detailed below:
| Fund
|
|
Sector
|
|
Percentage
of
Total Investments |
|
AllianzGI Preferred Securities and Income
Fund
|
|
Financials
|
|
42%
|
|
AllianzGI Water
Fund
|
|
Machinery
|
|
36%
|
|
NFJ Emerging Markets Value
Fund
|
|
Information
Technology |
|
32%
|
VIRTUS STRATEGY
TRUST
NOTES TO FINANCIAL STATEMENTS (Continued)
September 30, 2021
Note 9. Indemnifications
Under the Trust’s organizational
documents and in separate agreements between each Trustee and the Trust, its Trustees and officers are indemnified against certain liabilities arising out of the performance of their duties to the Trust and its funds. In addition, in the normal
course of business, the Trust and the Funds enter into contracts that provide a variety of indemnifications to other parties. The Trust’s and/or the Funds’ maximum exposure under these arrangements is unknown, as this would involve
future claims that may be made against the Trust or the Funds and that have not occurred. However, neither the Trust nor the Funds have had prior claims or losses pursuant to these arrangements, and they expect the risk of loss to be remote.
Note 10. Restricted Securities
($ reported in thousands)
Restricted securities are not registered
under the Securities Act of 1933, as amended (the “1933 Act”). Generally, 144A securities are excluded from this category. Each Fund will bear any costs, including those involved in registration under the 1933 Act, in connection with the
disposition of such securities. The following Fund held securities that were considered to be restricted at September 30, 2021:
| Fund
|
|
Investment
|
|
Date
of
Acquisition |
|
Cost
|
|
Value
|
|
Percentage
of
Net Assets |
|
AllianzGI High Yield Bond
Fund
|
|
Affinion
Group Holdings |
|
11/04/2015
|
|
$
770 |
|
$
— |
|
0.0%
|
| |
|
LiveStyle,
Inc., Series B |
|
9/28/2016
|
|
1,857
|
|
1,894
|
|
2.7
|
| |
|
LiveStyle,
Inc. |
|
12/01/2016
|
|
—
(a) |
|
—
(a) |
|
0.0
|
|
AllianzGI Short Duration High Income
Fund
|
|
Cloud
Peak Energy, Inc. |
|
8/14/2020
|
|
—
|
|
—
|
|
0.0
|
(a)Amount is less than $500.
Note 11. Redemption Facility and Interfund
Lending
($ reported in thousands)
On June 11, 2021, the Trust terminated a
committed line of credit agreement (the “State Street Agreement”) with State Street Bank and Trust Company. The State Street Agreement permitted the Trust, as borrowers (collectively, the “Borrowers” and each series thereof,
a “Borrower Fund”), to borrow up to $200,000 in aggregate, subject to (i) a requirement that each Borrower Fund’s asset coverage with respect to senior securities representing indebtedness be 300% or higher, and (ii) certain other
limitations and conditions. For the period from October 24, 2019 through October 1, 2020, pursuant to the terms of the State Street Agreement then in effect, each Borrower Fund paid interest on any amounts borrowed under the facility at a rate per
annum equal to 1.25% plus the higher of the then-current federal funds overnight rate or the one-month LIBOR rate, subject to upward adjustment for outstanding past due payments. The State Street Agreement was extended by an additional 364-day
period by an amendment effective October 2, 2020 with an expiration date of October 1, 2021 (the “Amendment”). The Amendment included a change to the investment adviser from AllianzGI U.S. to Virtus Investment Advisers, Inc. to become
effective upon the effective date on which the transactions resulting in the investment adviser change shall become effective, which was later determined to be February 1, 2021. In addition, effective October 2, 2020, each Borrower Fund must pay
interest on any amounts borrowed under the facility at a rate per annum equal to the sum of (a) 0.10% plus (b) the “applicable margin” of 1.25% plus (c) the higher of the then-current federal funds overnight rate or an overnight bank
lending rate. Amounts borrowed may be repaid and reborrowed on a revolving basis during the term of the facility. The Funds did not utilize the line of credit during the period July 1, 2020 through June 11, 2021. As discussed in Note 8 above, the
Funds may face certain risks and uncertainties insofar as they were exposed to LIBOR.
Pursuant to an exemptive order issued by the
SEC (the “Order”), the Funds are authorized to enter into a master interfund lending agreement (the “Interfund Program”) with each other and certain funds advised by the Adviser (and prior to February 1, 2021, by AllianzGI
U.S.) (each a “Participating Fund”). The Interfund Program allows each Participating Fund, whose policies permit it to do so, to lend money directly to and borrow money directly from other Funds for temporary purposes. During the period
ended September 30, 2021, the Funds did not participate as a borrower or lender in the Interfund Program.
On June 14, 2021, the Funds and certain
other affiliated funds entered into an $250,000 unsecured line of credit (“Credit Agreement”). This Credit Agreement, as amended, is with a commercial bank that allows the Funds to borrow cash from the bank to manage large unexpected
redemptions and trade fails, up to a limit of one-third or one-fifth, as applicable, of each Fund’s total net assets in accordance with the terms of the agreement. This Credit Agreement has a term of 364 days and has been renewed for a period
up to March 10, 2022. Interest is charged at the higher of the LIBOR or the Federal Funds rate plus an additional percentage rate on the amount borrowed. Commitment fees are charged on the undrawn balance. Total commitment fees paid for the period
June 14, 2021 through September 30, 2021, are included in the “Interest expense and/or commitment fees” line on the Statements of Operations. The Funds and other affiliated funds that are parties are individually, and not jointly, liable
for their particular advances, if any, under the Credit Agreement. The lending bank has the ability to require repayment of outstanding borrowings under this Credit Agreement upon certain circumstances such as an event of default.
The following Funds had an outstanding loan
during the period. The borrowings were valued at cost, which approximates fair value.
VIRTUS STRATEGY
TRUST
NOTES TO FINANCIAL STATEMENTS (Continued)
September 30, 2021
| Fund
|
|
Interest
Incurred
on Borrowing |
|
Average
Dollar
Amount of Borrowing |
|
Weighted
Average
Interest Rate on
Borrowing |
|
Days
Loan
was Open |
|
AllainzGI Global Dynamic Allocation
Fund
|
|
$
1 |
|
$9,600
|
|
1.35%
|
|
2
|
|
AllainzGI International Small-Cap
Fund
|
|
—
(1) |
|
4,000
|
|
1.34
|
|
2
|
|
(1) |
Amount
is less than $500. |
Note 12. Federal Income Tax Information
($ reported in thousands)
At September 30, 2021, the approximate
aggregate cost basis and the unrealized appreciation (depreciation) of investments and other financial instruments for federal income tax purposes were as follows:
| Fund
|
|
Federal
Tax Cost |
|
Unrealized
Appreciation |
|
Unrealized
(Depreciation) |
|
Net
Unrealized
Appreciation
(Depreciation) |
|
AllianzGI Convertible
Fund
|
|
$
2,659,688 |
|
$
422,446 |
|
$
(45,237) |
|
$
377,209 |
|
AllianzGI Core Plus Bond
Fund
|
|
58,295
|
|
798
|
|
(413)
|
|
385
|
|
AllianzGI Emerging Markets Consumer
Fund
|
|
3,303
|
|
1,177
|
|
(524)
|
|
653
|
|
AllianzGI Global Allocation
Fund
|
|
245,986
|
|
32,233
|
|
(4,021)
|
|
28,212
|
|
AllianzGI Global Dynamic Allocation
Fund
|
|
50,280
|
|
6,090
|
|
(1,796)
|
|
4,294
|
|
AllianzGI Global Sustainability
Fund
|
|
88,860
|
|
38,224
|
|
(1,603)
|
|
36,621
|
|
AllianzGI High Yield Bond
Fund
|
|
72,682
|
|
3,836
|
|
(4,812)
|
|
(976)
|
|
AllianzGI International Small-Cap
Fund
|
|
59,031
|
|
21,407
|
|
(3,750)
|
|
17,657
|
|
AllianzGI Preferred Securities and Income
Fund
|
|
22,167
|
|
1,037
|
|
(24)
|
|
1,013
|
|
AllianzGI Short Duration High Income
Fund
|
|
767,936
|
|
13,427
|
|
(33,244)
|
|
(19,817)
|
|
AllianzGI Water
Fund
|
|
696,408
|
|
329,860
|
|
(17,196)
|
|
312,664
|
|
NFJ Emerging Markets Value
Fund
|
|
128,230
|
|
36,140
|
|
(14,169)
|
|
21,971
|
Certain Funds
have capital loss carryforwards available to offset future realized capital gains, if any, to the extent permitted by the Code. Net capital losses are carried forward without expiration and generally retain their short-term and/or long-term tax
character, as applicable. The Funds’ capital loss carryovers are as follows:
| Fund
|
|
Short-Term
|
|
Long-Term
|
|
AllianzGI High Yield Bond
Fund
|
|
$
6,364 |
|
$
28,730 |
|
AllianzGI Short Duration High Income
Fund
|
|
34,064
|
|
100,108
|
|
NFJ Emerging Markets Value
Fund
|
|
7,819
|
|
—
|
The components of
distributable earnings on a tax basis and certain tax attributes for the Funds consist of the following:
| |
Undistributed
Ordinary
Income |
|
Undistributed
Long-Term
Capital Gains |
|
Post-October
Capital Loss
Deferred |
|
Capital
Loss
Deferred |
|
AllianzGI Convertible Fund
|
$274,974
|
|
$212,816
|
|
$
— |
|
$
— |
|
AllianzGI Core Plus Bond Fund
|
289
|
|
—
|
|
—
|
|
—
|
|
AllianzGI Emerging Markets Consumer Fund
|
138
|
|
3,773
|
|
—
|
|
—
|
|
AllianzGI Global Allocation Fund
|
8,310
|
|
10,369
|
|
—
|
|
—
|
|
AllianzGI Global Dynamic Allocation Fund
|
5,498
|
|
2,284
|
|
—
|
|
—
|
|
AllianzGI Global Sustainability Fund
|
4,434
|
|
18,069
|
|
—
|
|
—
|
|
AllianzGI High Yield Bond Fund
|
142
|
|
—
|
|
2,777
|
|
35,094
|
|
AllianzGI International Small-Cap Fund
|
2,037
|
|
9,748
|
|
—
|
|
—
|
|
AllianzGI Preferred Securities and Income Fund
|
933
|
|
488
|
|
—
|
|
—
|
|
AllianzGI Short Duration High Income Fund
|
2,635
|
|
—
|
|
5,967
|
|
134,172
|
|
AllianzGI Water Fund
|
16,910
|
|
66,006
|
|
—
|
|
—
|
|
NFJ Emerging Markets Value Fund
|
71
|
|
—
|
|
—
|
|
7,819
|
The differences
between the book and tax basis of distributable earnings relate principally to the timing of recognition of income and gains for federal income tax purposes. Short-term gain distributions, if any, are reported as ordinary income for federal tax
purposes. Distributions are determined on a tax basis and may differ from net investment income and realized capital gains for financial reporting purposes.
VIRTUS STRATEGY
TRUST
NOTES TO FINANCIAL STATEMENTS (Continued)
September 30, 2021
The tax character of dividends and
distributions paid during the fiscal periods ended September 30, 2021 and 2020 was as follows:
| |
Ordinary
Income |
|
Long-Term
Capital Gains |
|
Total
|
|
AllianzGI Convertible
Fund
|
|
|
|
|
|
|
9/30/21
|
$
130,806 |
|
$
42,625 |
|
$173,431
|
|
9/30/20
|
19,171
|
|
21,397
|
|
40,568
|
|
AllianzGI Core Plus Bond
Fund
|
|
|
|
|
|
|
9/30/21
|
4,686
|
|
354
|
|
5,040
|
|
9/30/20
|
3,560
|
|
85
|
|
3,645
|
|
AllianzGI Emerging Markets Consumer
Fund
|
|
|
|
|
|
|
9/30/21
|
527
|
|
—
|
|
527
|
|
9/30/20
|
438
|
|
—
|
|
438
|
|
AllianzGI Global Allocation
Fund
|
|
|
|
|
|
|
9/30/21
|
14,303
|
|
6,289
|
|
20,592
|
|
9/30/20
|
9,517
|
|
20,724
|
|
30,241
|
|
AllianzGI Global Dynamic Allocation
Fund
|
|
|
|
|
|
|
9/30/21
|
8,312
|
|
4,043
|
|
12,355
|
|
9/30/20
|
5,941
|
|
7,327
|
|
13,268
|
|
AllianzGI Global Sustainability
Fund
|
|
|
|
|
|
|
9/30/21
|
4,631
|
|
560
|
|
5,191
|
|
9/30/20
|
440
|
|
2,643
|
|
3,083
|
|
AllianzGI High Yield Bond
Fund
|
|
|
|
|
|
|
9/30/21
|
3,906
|
|
—
|
|
3,906
|
|
9/30/20
|
5,956
|
|
—
|
|
5,956
|
|
AllianzGI International Small-Cap
Fund
|
|
|
|
|
|
|
9/30/21
|
843
|
|
276
|
|
1,119
|
|
9/30/20
|
1,632
|
|
—
|
|
1,632
|
|
AllianzGI Preferred Securities and Income
Fund
|
|
|
|
|
|
|
9/30/21
|
1,123
|
|
97
|
|
1,220
|
|
9/30/20
|
1,209
|
|
202
|
|
1,411
|
|
AllianzGI Short Duration High Income
Fund
|
|
|
|
|
|
|
9/30/21
|
46,999
|
|
—
|
|
46,999
|
|
9/30/20
|
56,024
|
|
—
|
|
56,024
|
|
AllianzGI Water
Fund
|
|
|
|
|
|
|
9/30/21
|
5,137
|
|
8,856
|
|
13,993
|
|
9/30/20
|
4,315
|
|
15,290
|
|
19,605
|
|
NFJ Emerging Markets Value
Fund
|
|
|
|
|
|
|
9/30/21
|
2,083
|
|
—
|
|
2,083
|
|
9/30/20
|
1,625
|
|
—
|
|
1,625
|
Certain capital
accounts in the financial statements are periodically adjusted for permanent differences in order to reflect their tax character. Permanent reclassifications can arise from differing treatment of certain income and gain transactions and
nondeductible current year net operating losses. These adjustments have no impact on net assets or net asset value per share of the Funds. Temporary differences that arise from recognizing certain items of income, expense, gain or loss in different
periods for financial statement and tax purposes will likely reverse at some time in the future.
Note 13. In-Kind Transactions
During the period ended September 30, 2021,
AllianzGI Global Allocation Fund accepted assets from affiliated entities in connection with in-kind transactions. For financial reporting and tax purposes, the cost of contributed securities is equal to the market value of the securities on the
date of contribution. The Fund sold 1,948,556 shares in-kind with a value of $25,803,891. The number of shares sold and value are included in the “shares issued” and “Net proceeds from the sale of common stock” on the
Statements of Changes in Net Assets.
Note 14. Regulatory Matters and Litigation
From time to time, the Trust, the Funds, the
Adviser and/or the subadvisers and/or their affiliates may be involved in litigation and arbitration as well as examinations and investigations by various regulatory bodies, including the SEC, involving compliance with, among other things,
securities laws, client investment guidelines, laws governing the activities of broker-dealers and other laws and regulations affecting their activities. At this time, the Adviser believes that the outcomes of such matters are not likely, either
individually or in aggregate, to be material to these financial statements.
VIRTUS STRATEGY
TRUST
NOTES TO FINANCIAL STATEMENTS (Continued)
September 30, 2021
Note 15. Recent Accounting Pronouncement
In March 2020, the FASB issued Accounting
Standards Update No. 2020-04 (“ASU 2020-04”), Reference Rate Reform (Topic 848) – Facilitation of the Effects of Reference Rate Reform on Financial Reporting. The amendments in ASU 2020-04 provides optional temporary financial
reporting relief from the effect of certain types of contract modifications due to the planned discontinuation of the LIBOR and other interbank-offered reference rates as of the end of 2021. ASU 2020-04 is effective for certain reference
rate-related contract modifications that occur during the period March 12, 2020 through December 31, 2022. Management is currently evaluating the impact, if any, of applying ASU 2020-04.
Note 16. Subsequent Events
Management has evaluated the impact of all
subsequent events on the Funds through the date the financial statements were available for issuance, and has determined that the following are the only subsequent events requiring recognition or disclosure in these financial statements.
On November 2, 2021, the Board of Trustees
of Virtus Strategy Trust voted to approve a Plan of Liquidation of the Virtus AllianzGI Emerging Markets Consumer Fund (the “Fund”), pursuant to which the Fund will be liquidated on or about December 7, 2021. Effective November 12, 2021,
the AllianzGI Emerging Markets Consumer Fund will be closed to new investors and additional investor deposits. The Fund’s investments may be sold in advance of November 12, 2021.
Report of Independent Registered Public Accounting Firm
To the Board of Trustees of Virtus Strategy
Trust and Shareholders of Virtus AllianzGI Convertible Fund, Virtus AllianzGI Core Plus Bond Fund, Virtus AllianzGI Emerging Markets Consumer Fund, Virtus AllianzGI Global Allocation Fund, Virtus AllianzGI Global
Dynamic Allocation Fund, Virtus
AllianzGI Global Sustainability Fund, Virtus AllianzGI High Yield Bond Fund, Virtus AllianzGI
International Small-Cap Fund, Virtus AllianzGI Preferred Securities and Income Fund, Virtus AllianzGI Short Duration High Income Fund, Virtus AllianzGI
Water Fund and Virtus NFJ Emerging Markets Value Fund
Opinions on the Financial Statements
We have audited the accompanying statements
of assets and liabilities, including the schedules of investments, of Virtus AllianzGI Convertible Fund, Virtus AllianzGI Core Plus Bond Fund, Virtus AllianzGI Emerging Markets Consumer Fund, Virtus AllianzGI Global Allocation Fund, Virtus AllianzGI
Global Dynamic Allocation Fund, Virtus AllianzGI Global Sustainability Fund, Virtus AllianzGI High Yield Bond Fund, Virtus AllianzGI International Small-Cap Fund, Virtus AllianzGI Preferred Securities and Income Fund, Virtus
AllianzGI Short
Duration High Income Fund, Virtus AllianzGI Water Fund and Virtus NFJ Emerging Markets Value Fund (twelve of the Funds constituting Virtus Strategy Trust, hereafter collectively referred to as the “Funds”) as of September 30, 2021, the
related
statements of operations for the year ended September 30, 2021, the statements of changes in net assets for each of the two years in the period ended September 30, 2021, including the related notes, and the financial highlights for each
of the periods indicated therein (collectively referred to as the “financial statements”). In our opinion, the financial statements present fairly, in all
material respects, the financial position of each of the Funds as of September
30, 2021, the results of each of their operations for the year then ended, the changes in each of their net assets for each of the two years in the period ended September 30, 2021 and the financial highlights for each of the periods indicated
therein in conformity with accounting principles generally accepted in the United States of America.
Basis for Opinions
These financial statements are the
responsibility of the Funds’ management. Our responsibility is to express an opinion on the Funds’ financial statements based on our audits. We are a public accounting firm registered with the Public Company Accounting Oversight Board
(United States) (“PCAOB”) and are required to be independent with respect to the Funds in accordance with the U.S. federal securities laws and the applicable rules and regulations of the Securities and Exchange Commission and the
PCAOB.
We conducted our audits of
these financial statements in accordance with the standards of the PCAOB. Those standards require that we plan and perform the audit to obtain reasonable assurance about whether the financial statements are free of material
misstatement, whether
due to error or fraud.
Our audits
included performing procedures to assess the risks of material misstatement of the financial statements, whether due to error or fraud, and performing procedures that respond to those risks. Such procedures included examining, on a test basis,
evidence regarding the amounts and disclosures in the financial statements. Our audits also included evaluating the accounting principles used and significant estimates made by management, as well as evaluating the overall presentation of the
financial statements. Our
procedures included confirmation of securities owned as of September 30, 2021 by correspondence with the custodian, transfer agents and brokers; when replies were not received from brokers, we performed other auditing
procedures. We believe that our audits provide a reasonable basis for our opinions.
/s/ PricewaterhouseCoopers LLP
Philadelphia, Pennsylvania
November 26, 2021
We have served as the Virtus Mutual
Funds’ auditor since at least 1977. We have not been able to determine the specific year we began serving as auditor.
VIRTUS STRATEGY
TRUST
TAX INFORMATION NOTICE (Unaudited)
September 30, 2021
The
following information is being provided in order to meet reporting requirements set forth by the Code and/or to meet state specific requirements. In early 2022, the Funds will notify applicable shareholders of amounts for use in preparing 2021 U.S.
federal income tax forms. Shareholders should consult their tax advisors.
With respect to distributions paid during the fiscal year ended
September 30 2021, the Funds designate the following amounts (or, if subsequently determined to be different, the maximum amount allowable):
| |
Qualified
Dividend
Income %
(non-corporate
shareholder) |
|
Dividend
Received
Deduction %
(corporate
shareholders) |
|
Long-Term
Capital Gain
Distributions ($) |
|
AllianzGI Convertible
Fund
|
5.75
% |
|
5.29
% |
|
$
255,441 |
|
AllianzGI Core Plus Bond
Fund
|
1.12
|
|
1.12
|
|
354
|
|
AllianzGI Emerging Markets Consumer
Fund
|
100.00
|
|
6.07
|
|
7,433
|
|
AllianzGI Global Allocation
Fund
|
22.11
|
|
2.21
|
|
16,658
|
|
AllianzGI Global Dynamic Allocation
Fund
|
6.30
|
|
1.95
|
|
6,327
|
|
AllianzGI Global Sustainability
Fund
|
47.91
|
|
20.14
|
|
18,629
|
|
AllianzGI International Small-Cap
Fund
|
65.80
|
|
—
|
|
10,024
|
|
AllianzGI Preferred Securities and Income
Fund
|
27.93
|
|
26.52
|
|
585
|
|
AllianzGI Water
Fund
|
95.19
|
|
23.24
|
|
74,862
|
|
NFJ Emerging Markets Value
Fund
|
100.00
|
|
11.60
|
|
—
|
For the fiscal year ended September
30, 2021, certain Funds are disclosing the following information pursuant to notice requirements of Section 853(a) and 855(d) of the Code, and the Treasury Regulations thereunder ($ reported in thousands).
| |
Foreign
Source
Income
Recognized |
|
Foreign
Taxes
Paid on
Foreign
Source
Income |
|
AllianzGI International Small-Cap
Fund
|
$
1,678 |
|
$
177 |
|
NFJ Emerging Markets Value
Fund
|
2,376
|
|
304
|
STATEMENT REGARDING LIQUIDITY
RISK MANAGEMENT PROGRAM (UNAUDITED)
Pursuant to Rule 22e-4 under the 1940 Act,
the Funds have adopted a liquidity risk management program (the “Program”) to govern the Funds’ approach to managing liquidity risk, which is the risk that a Fund would not be able to meet redemption requests without significant
dilution of remaining investors’ interests in the Fund. The Program is overseen by the Adviser as the Funds’ Liquidity Risk Management Program Administrator (the “Program Administrator”), and the Program’s principal
objectives include assessing, managing and periodically reviewing each Fund’s liquidity risk, based on factors specific to the circumstances of the Funds. Assessment and management of a Fund’s liquidity risk under the Program take into
consideration certain factors, such as the Fund’s investment strategy and the liquidity of its portfolio investments during normal and reasonably foreseeable stressed conditions, its short- and long-term cash-flow projections during both
normal and reasonably foreseeable stressed conditions, and its cash and cash-equivalent holdings and access to other funding sources. As required by the rule, the Program includes policies and procedures for classification of Fund portfolio holdings
in four liquidity categories, maintaining certain levels of highly liquid investments, and limiting holdings of illiquid investments.
At a meeting of the Board held on May 17-19,
2021, the Board received a report from the Program Administrator addressing the operation and management of the Program for calendar year 2020 (the “Review Period”). The Program Administrator’s report noted that for the Review
Period, the Program Administrator believed that the Program was implemented and operated effectively in all material respects and that existing procedures, controls and safeguards were appropriately designed to enable the Program Administrator to
administer the Program in compliance with Rule 22e-4. The Program Administrator’s report noted that during the Review Period, there were no events that created liquidity related concerns for the Funds. The Program Administrator’s report
further noted that while changes to the Program had been made during the Review Period and reported to the Board, no material changes were made to the Program as a result of the Program Administrator’s annual review.
There can be no assurance that the Program
will achieve its objectives in the future. Please refer to a Fund’s prospectus for more information regarding the Fund’s exposure to liquidity risk and other principal risks to which an investment in that Fund may be subject.
FUND MANAGEMENT TABLES
(Unaudited)
Information pertaining to the Trustees and
officers of the Trust as of the date of issuance of this report, is set forth below. The statement of additional information (SAI) includes additional information about the Trustees and is available without charge, upon request, by calling (800)
243-4361.
Independent Trustees
Name,
Year of Birth,
Length of Time Served
and Number of
Portfolios in Fund
Complex Overseen by
Trustee |
Principal
Occupation(s) During Past 5 Years |
Other
Directorships Held by Trustee During Past 5 Years |
Burke,
Donald C.
YOB: 1960
Served Since: 2021
99 Portfolios |
Retired.
|
Trustee
(since 2021), The Merger Fund®, The Merger Fund® VL, and Virtus Event Opportunities Trust (2
portfolios); Trustee (since 2021), Virtus Investment Trust (13 portfolios) and Virtus Strategy Trust (12 portfolios); Director (2020 to 2021), Duff & Phelps Select MLP and Midstream Energy Fund Inc.; Director (since 2020), Virtus Total Return
Fund Inc.; Trustee (since 2020), Virtus Global Multi-Sector Income Fund; Trustee (since 2016), Virtus Mutual Fund Family (55 portfolios), Virtus Variable Insurance Trust (8 portfolios) and Virtus Alternative Solutions Trust (2 portfolios); Director
(since 2014), closed-end funds managed by Duff & Phelps Investment Management Co. (3 funds); Director, Avista Corp. (energy company) (since 2011); Trustee, Goldman Sachs Fund Complex (2010 to 2014); and Director, BlackRock Luxembourg and Cayman
Funds (2006 to 2010). |
Cogan,
Sarah E.
YOB: 1956
Served Since:
2019
103 Portfolios |
Retired
Partner, Simpson Thacher & Bartlett LLP (“STB”) (law firm) (since 2018); Director, Girl Scouts of Greater New York (since 2016); Trustee, Natural Resources Defense Council, Inc. (since 2013); and formerly, Partner, STB (1989 to
2018). |
Trustee
(since 2021), The Merger Fund®, The Merger Fund® VL, and Virtus Event Opportunities Trust (2
portfolios); Advisory Board Member (since 2021), Virtus Alternative Solutions Trust (2 portfolios), Virtus Mutual Fund Family (55 portfolios), and Virtus Variable Insurance Trust (8 portfolios); Advisory Board Member (February 2021 to June 2021),
Duff & Phelps Select MLP and Midstream Energy Fund Inc.; Trustee (since 2021), Virtus Global Multi-Sector Income Fund and Virtus Total Return Fund Inc.; Trustee (since 2019), Virtus Investment Trust (13 portfolios) and Virtus Strategy Trust (12
portfolios); Trustee (since 2019), Virtus AllianzGI Closed-End Funds (7 portfolios); Trustee (since 2019), PIMCO California Municipal Income Fund, PIMCO California Municipal Income Fund II, PIMCO California Municipal Income Fund III, PIMCO Municipal
Income Fund, PIMCO Municipal Income Fund II, PIMCO Municipal Income Fund III, PIMCO New York Municipal Income Fund, PIMCO New York Municipal Income Fund II, PIMCO New York Municipal Income Fund III, PIMCO Energy and Tactical Credit Opportunities
Fund, PCM Fund, Inc, PIMCO Corporate & Income Strategy Fund, PIMCO Corporate & Income Opportunity Fund, PIMCO Dynamic Credit and Mortgage Income Fund, PIMCO Dynamic Income Fund, PIMCO Global StocksPLUS® & Income Fund, PIMCO High
Income Fund, PIMCO Income Opportunity Fund, PIMCO Income Strategy Fund, PIMCO Income Strategy Fund II, PIMCO Strategic Income Fund, Inc., PIMCO Flexible Credit Income Fund and PIMCO Flexible Municipal Income Fund; and Trustee (since 2019), PIMCO
Managed Accounts Trust (5 portfolios). |
FUND MANAGEMENT TABLES
(Unaudited) (Continued)
Name,
Year of Birth,
Length of Time Served
and Number of
Portfolios in Fund
Complex Overseen by
Trustee |
Principal
Occupation(s) During Past 5 Years |
Other
Directorships Held by Trustee During Past 5 Years |
DeCotis,
Deborah A.
YOB: 1952
Served Since: 2011
103 Portfolios |
Advisory
Director, Morgan Stanley & Co., Inc. (since 1996); Member, Circle Financial Group (since 2009); Member, Council on Foreign Relations (since 2013); Trustee, Smith College (since 2017); and Director, Watford Re (since 2017). Formerly, Co-Chair
Special Projects Committee, Memorial Sloan Kettering (2005 to 2015); Trustee, Stanford University (2010 to 2015); and Principal, LaLoop LLC, a retail accessories company (1999 to 2014). |
Trustee
(since 2021), The Merger Fund®, The Merger Fund® VL, and Virtus Event Opportunities Trust (2
portfolios); Advisory Board Member (since 2021), Virtus Alternative Solutions Trust (2 portfolios), Virtus Mutual Fund Family (55 portfolios), and Virtus Variable Insurance Trust (8 portfolios); Advisory Board Member (February 2021 to June 2021),
Duff & Phelps Select MLP and Midstream Energy Fund Inc.; Trustee (since 2021), Virtus Global Multi-Sector Income Fund and Virtus Total Return Fund Inc.; Trustee (since 2020), PIMCO Dynamic Income Opportunities Fund; Trustee (since 2019), PIMCO
Energy and Tactical Credit Opportunities Fund and Virtus AllianzGI Artificial Intelligence & Technology Opportunities Fund; Trustee (since 2018), PIMCO Flexible Municipal Income Fund Trustee (since 2017), PIMCO Flexible Credit Income Fund and
Virtus AllianzGI Convertible & Income 2024 Target Term Fund; Trustee (since 2015), Virtus AllianzGI Diversified Income & Convertible Fund; Trustee (since 2014), Virtus Investment Trust (13 portfolios); Trustee (since 2013), PIMCO Dynamic
Credit and Mortgage Income Fund; Trustee (since 2012), PIMCO Dynamic Income Fund; Trustee (since 2011), Virtus Strategy Trust (12 portfolios); Trustee (since 2011), PIMCO California Municipal Income Fund II, PIMCO California Municipal Income Fund
III, PIMCO Municipal Income Fund, PIMCO Municipal Income Fund II, PIMCO Municipal Income Fund III, PIMCO New York Municipal Income Fund, PIMCO New York Municipal Income Fund II, PIMCO New York Municipal Income Fund III, PCM Fund, Inc., PIMCO
Corporate & Income Strategy Fund, PIMCO Corporate & Income Opportunity Fund, PIMCO Global StocksPLUS® & Income Fund, PIMCO High Income Fund, PIMCO Income Opportunity Fund, PIMCO Income Strategy Fund, PIMCO Income Strategy Fund II,
PIMCO Strategic Income Fund, Inc., PIMCO Managed Accounts Trust (5 portfolios); and Trustee (since 2011), Virtus AllianzGI Convertible & Income Fund, Virtus AllianzGI Convertible & Income Fund II, Virtus AllianzGI Equity & Convertible
Income Fund, and Virtus Dividend, Interest & Premium Strategy Fund. |
Drummond,
F. Ford
YOB: 1962
Served Since: 2014
103 Portfolios |
Owner/Operator
(since 1998), Drummond Ranch; formerly Board Member (2006 to 2020) and Chairman (2016 to 2018), Oklahoma Water Resources Board; Director (1998 to 2008), The Cleveland Bank; and General Counsel (1998 to 2008), BMIHealth Plans (benefits
administration). |
Trustee
(since 2021), The Merger Fund®; Trustee (since 2021), The Merger Fund® VL; Trustee (since
2021), Virtus Event Opportunities Trust (2 portfolios); Advisory Board Member (since 2021), Virtus Alternative Solutions Trust (2 portfolios), Virtus Mutual Fund Family (55 portfolios), and Virtus Variable Insurance Trust (8 portfolios); Advisory
Board Member (February 2021 to June 2021), Duff & Phelps Select MLP and Midstream Energy Fund Inc.; Trustee (since 2021), Virtus Global Multi-Sector Income Fund and Virtus Total Return Fund Inc.; Trustee (since 2019), Virtus AllianzGI Artificial
Intelligence & Technology Opportunities Fund; Trustee (since 2017), Virtus AllianzGI Convertible & Income 2024 Target Term Fund; Trustee (since 2015), Virtus AllianzGI Convertible & Income Fund, Virtus AllianzGI Convertible & Income
Fund II, Virtus AllianzGI Diversified Income & Convertible Fund, Virtus Dividend, Interest & Premium Strategy Fund and Virtus AllianzGI Equity & Convertible Income Fund; Trustee (since 2014), Virtus Strategy Trust (12 portfolios);
Director (since 2011), Bancfirst Corporation; and Trustee (since 2006), Virtus Investment Trust (13 portfolios). |
Harris,
Sidney E.
YOB: 1949
Served Since: 2021
96 Portfolios |
Private
Investor (since 2021); Professor and Dean Emeritus (2015 to 2021), Professor (1997 to 2014), Dean (1997 to 2004), J. Mack Robinson College of Business, Georgia State University. |
Trustee
(since 2021), The Merger Fund®, The Merger Fund® VL, and Virtus Event Opportunities Trust (2
portfolios); Trustee (since 2021), Virtus Investment Trust (13 portfolios) and Virtus Strategy Trust (12 portfolios); Director (2020 to 2021), Duff & Phelps Select MLP and Midstream Energy Fund Inc.; and Director (since 2020), Virtus Total
Return Fund Inc.; Trustee (since 2020), Virtus Global Multi-Sector Income Fund; Trustee (since 2019), Mutual Fund Directors Forum; Trustee (since 2017), Virtus Mutual Fund Family (55 portfolios), Virtus Variable Insurance Trust (8 portfolios) and
Virtus Alternative Solutions Trust (2 portfolios); Trustee (2013 to 2020) and Honorary Trustee (since 2020), KIPP Metro Atlanta; Director (1999 to 2019), Total System Services, Inc.; Trustee (2004 to 2017), RidgeWorth Funds; Chairman (2012 to 2017),
International University of the Grand Bassam Foundation; Trustee (since 2012), International University of the Grand Bassam Foundation; and Trustee (2011 to 2015), Genspring Family Offices, LLC. |
FUND MANAGEMENT TABLES
(Unaudited) (Continued)
Name,
Year of Birth,
Length of Time Served
and Number of
Portfolios in Fund
Complex Overseen by
Trustee |
Principal
Occupation(s) During Past 5 Years |
Other
Directorships Held by Trustee During Past 5 Years |
Mallin,
John R.
YOB: 1950
Served Since: 2021
96 Portfolios |
Partner/Attorney
(since 2003), McCarter & English LLP (law firm) Real Property Practice Group; and Member (since 2014), Counselors of Real Estate. |
Trustee
(since 2021), The Merger Fund®, The Merger Fund® VL, and Virtus Event Opportunities Trust (2
portfolios); Trustee (since 2021), Virtus Investment Trust (13 portfolios) and Virtus Strategy Trust (12 portfolios); Director (2020 to 2021), Duff & Phelps Select MLP and Midstream Energy Fund Inc.; and Director (since 2020), Virtus Total
Return Fund Inc.; Trustee (since 2020), Virtus Global Multi-Sector Income Fund; Trustee (since 2016), Virtus Mutual Fund Family (55 portfolios) and Virtus Alternative Solutions Trust (2 portfolios); Director (since 2019), 1892 Club, Inc.
(non-profit); Director (2013 to 2020), Horizons, Inc. (non-profit); and Trustee (since 1999), Virtus Variable Insurance Trust (8 portfolios). |
McDaniel,
Connie D.
YOB: 1958
Served Since: 2021
96 Portfolios |
Retired
(since 2013). Vice President, Chief of Internal Audit, Corporate Audit Department (2009 to 2013); Vice President Global Finance Transformation (2007 to 2009); Vice President and Controller (1999 to 2007), The Coca-Cola Company. |
Trustee
(since 2021), The Merger Fund®, The Merger Fund® VL, and Virtus Event Opportunities Trust (2
portfolios); Trustee (since 2021), Virtus Investment Trust (13 portfolios) and Virtus Strategy Trust (12 portfolios); Director (2020 to 2021), Duff & Phelps Select MLP and Midstream Energy Fund Inc.; and Director (since 2020), Virtus Total
Return Fund Inc.; Trustee (since 2020), Virtus Global Multi-Sector Income Fund; Director (since 2019), Global Payments Inc.; Trustee (since 2017), Virtus Mutual Fund Family (55 portfolios), Virtus Variable Insurance Trust (8 portfolios), and Virtus
Alternative Solutions Trust (2 portfolios); Director (since 2021), North Florida Land Trust; Director (2014 to 2019), Total System Services, Inc.; Member (since 2011) and Chair (2014 to 2016), Georgia State University, Robinson College of Business
Board of Advisors; and Trustee (2005 to 2017), RidgeWorth Funds. |
McLoughlin,
Philip
YOB: 1946
Served Since: 2021
106 Portfolios |
Retired.
|
Trustee
(since 2021), The Merger Fund®, The Merger Fund® VL, and Virtus Event Opportunities Trust (2
portfolios); Trustee (since 2021), Virtus Investment Trust (13 portfolios) and Virtus Strategy Trust (12 portfolios); Trustee (since 2021), Virtus AllianzGI Artificial Intelligence & Technology Opportunities Fund, Virtus AllianzGI Convertible
& Income Fund II, Virtus AllianzGI Diversified Income & Convertible, Virtus AllianzGI Equity & Convertible Income Fund and Virtus Dividend, Interest & Premium Strategy Fund; Advisory Board Member (since 2021), Virtus AllianzGI
Convertible & Income 2024 Target Term Fund and Virtus AllianzGI Convertible & Income Fund; Director and Chairman (since 2016), Virtus Total Return Fund Inc.; Director and Chairman (2016 to 2019), the former Virtus Total Return Fund Inc.;
Director and Chairman (2014 to 2021), Duff & Phelps Select MLP and Midstream Energy Fund Inc.; Trustee and Chairman (since 2013), Virtus Alternative Solutions Trust (2 portfolios); Trustee and Chairman (since 2011), Virtus Global Multi-Sector
Income Fund; Chairman and Trustee (since 2003), Virtus Variable Insurance Trust (8 portfolios); Director (since 1995), closed-end funds managed by Duff & Phelps Investment Management Co. (3 funds); Director (1991 to 2019) and Chairman (2010 to
2019), Lazard World Trust Fund (closed-end investment firm in Luxembourg); and Trustee (since 1989) and Chairman (since 2002), Virtus Mutual Fund Family (55 portfolios). |
McNamara,
Geraldine M.
YOB: 1951
Served Since: 2021
99 Portfolios |
Retired.
|
Trustee
(since 2021), The Merger Fund®, The Merger Fund® VL, and Virtus Event Opportunities Trust (2
portfolios); Trustee (since 2021), Virtus Investment Trust (13 portfolios) and Virtus Strategy Trust (12 portfolios); Director (2020 to 2021), Duff & Phelps Select MLP and Midstream Energy Fund Inc. and Virtus Total Return Fund Inc.; Trustee
(since 2020), Virtus Global Multi-Sector Income Fund; Trustee (since 2016), Virtus Alternative Solutions Trust (2 portfolios); Trustee (since 2015), Virtus Variable Insurance Trust (8 portfolios); Director (since 2003), closed-end funds managed by
Duff & Phelps Investment Management Co. (3 funds); and Trustee (since 2001), Virtus Mutual Fund Family (55 portfolios). |
FUND MANAGEMENT TABLES
(Unaudited) (Continued)
Name,
Year of Birth,
Length of Time Served
and Number of
Portfolios in Fund
Complex Overseen by
Trustee |
Principal
Occupation(s) During Past 5 Years |
Other
Directorships Held by Trustee During Past 5 Years |
Walton,
R. Keith
YOB: 1964
Served Since: 2021
96 Portfolios |
Managing
Director (2020 to 2021), Lafayette Square Holding Company LLC; Venture and Operating Partner (since 2020), Plexo Capital, LLC; Venture Partner (since 2019) and Senior Adviser (2018 to 2019), Plexo, LLC; Senior Adviser (2018 to 2019), Vatic Labs,
LLC; Executive Vice President, Strategy (2017 to 2019), Zero Mass Water, LLC; Vice President, Strategy (2013 to 2017), Arizona State University; Partner (since 2006), Global Infrastructure Partners. |
Trustee
(since 2021), The Merger Fund®, The Merger Fund® VL, and Virtus Event Opportunities Trust (2
portfolios); Trustee (since 2021), Virtus Investment Trust (13 portfolios) and Virtus Strategy Trust (12 portfolios); Trustee (since 2020) Virtus Alternative Solutions Trust (2 portfolios), Virtus Variable Insurance Trust (8 portfolios) and Virtus
Mutual Fund Family (55 portfolios); Director (since 2017), certain funds advised by Bessemer Investment Management LLC; Director (2016 to 2021), Duff & Phelps Select MLP and Midstream Energy Fund Inc.; Trustee (since 2016), Virtus Global
Multi-Sector Income Fund; Director (2006 to 2019), Systematica Investments Limited Funds; Director (2006 to 2017), BlueCrest Capital Management Funds; Trustee (2014 to 2017), AZ Service; Director (since 2004), Virtus Total Return Fund Inc.; and
Director (2004 to 2019), the former Virtus Total Return Fund Inc. |
Zino,
Brian T.
YOB: 1952
Served Since: 2021
103 Portfolios |
Retired.
Various roles (1982 to 2009), J. & W. Seligman & Co. Incorporated, including President (1994 to 2009). |
Trustee
(since 2021), The Merger Fund®, The Merger Fund® VL, and Virtus Event Opportunities Trust (2
portfolios); Advisory Board Member (since 2021), Virtus AllianzGI Closed-End Funds (7 portfolios); Trustee (since 2021), Virtus Investment Trust (13 portfolios) and Virtus Strategy Trust (12 portfolios); Trustee (since 2020), Virtus Alternative
Solutions Trust (2 portfolios), Virtus Variable Insurance Trust (8 portfolios) and Virtus Mutual Fund Family (55 portfolios); Director (2016 to 2021), Duff & Phelps Select MLP and Midstream Energy Fund Inc.; Trustee (since 2016), Virtus Global
Multi-Sector Income Fund; Director (since 2014), Virtus Total Return Fund Inc.; Director (2014 to 2019), the former Virtus Total Return Fund Inc.; Trustee (since 2011), Bentley University; Director (1986 to 2009) and President (1994 to 2009),
J&W Seligman Co. Inc.; Director (1998 to 2009), Chairman (2002 to 2004) and Vice Chairman (2000 to 2002), ICI Mutual Insurance Company; Member, Board of Governors of ICI (1998 to 2008). |
Interested Trustee
Name,
Year of Birth,
Length of Time Served and
Number of Funds Overseen |
Principal
Occupation(s) During Past
5 Years |
Principal
Occupation(s) During Past 5 Years and
Other Directorships Held by Trustee |
Aylward,
George R.*
Trustee and President
YOB: 1964
Served Since: 2021
108 Portfolios |
Director,
President and Chief Executive Officer (since 2008), Virtus Investment Partners, Inc. and/or certain of its subsidiaries, and various senior officer positions with Virtus affiliates (since 2005). |
Trustee
and President (since 2021), The Merger Fund®, The Merger Fund® VL, and Virtus Event
Opportunities Trust (2 portfolios); Trustee and President (since 2021), Virtus Investment Trust (13 portfolios) and Virtus Strategy Trust (12 portfolios); Trustee, President and Chief Executive Officer (since 2021), Virtus AllianzGI Closed-End Funds
(7 portfolios); and Chairman and Trustee (since 2015), Virtus ETF Trust II (5 portfolios); Director, President and Chief Executive Officer (2014 to 2021), Duff & Phelps Select MLP and Midstream Energy Fund Inc.; Trustee and President (since
2013), Virtus Alternative Solutions Trust (2 portfolios); Director (since 2013), Virtus Global Funds, PLC (5 portfolios); Trustee (since 2012) and President (since 2010), Virtus Variable Insurance Trust (8 portfolios); Trustee, President and Chief
Executive Officer (since 2011), Virtus Global Multi-Sector Income Fund; Trustee and President (since 2006) and Executive Vice President (2004 to 2006), Virtus Mutual Fund Family (55 portfolios); Director, President and Chief Executive Officer (since
2006), Virtus Total Return Fund Inc.; and Director, President and Chief Executive Officer (2006 to 2019), the former Virtus Total Return Fund Inc. |
*Mr. Aylward is an “interested
person,” as defined in the 1940 Act, by reason of his position as President and Chief Executive Officer of Virtus Investment Partners, Inc. (“Virtus”), the ultimate parent company of the Adviser, and various positions with its
affiliates, including the Adviser.
FUND MANAGEMENT TABLES
(Unaudited) (Continued)
Advisory Board Member
Name,
Year of Birth,
Length of Time
Served, and Number
of Portfolios in Fund
Complex Overseen |
Principal
Occupation(s) During Past 5 Years |
Other
Held by
Trustee During Past 5 Years |
Moyer,
William R.
YOB: 1944
Served Since: 2020
96 Portfolios |
Private
investor (since 2004); and Financial and Operations Principal (2006 to 2017), Newcastle Distributors LLC (broker dealer). |
Advisory
Board Member (since 2021), The Merger Fund®, The Merger Fund® VL, and Virtus Event
Opportunities Trust (2 portfolios); Advisory Board Member (since 2021), Virtus Investment Trust (13 portfolios) and Virtus Strategy Trust (12 portfolios); Advisory Board Member (since 2020), Virtus Variable Insurance Trust (8 portfolios) and Virtus
Mutual Fund Family (55 portfolios); Advisory Board Member (since 2020) and Director (2016 to 2019), Virtus Total Return Fund Inc.; Director (2016 to 2019), the former Virtus Total Return Fund Inc.; Advisory Board Member (2020 to 2021) and Director
(2014 to 2019), Duff & Phelps Select MLP and Midstream Energy Fund Inc.; Advisory Board Member (since 2020) and Trustee (2011 to 2019), Virtus Global Multi-Sector Income Fund; Advisory Board Member (since 2020) and Trustee (2013 to 2016), Virtus
Alternative Solutions Trust (2 portfolios). |
Officers of the Trust Who Are Not Trustees
Name,
Address and
Year of Birth |
|
Principal
Occupation(s) During Past 5 Years |
Batchelar,
Peter J.
YOB: 1970 |
Senior
Vice President (since 2021). |
Senior
Vice President, Product Development (since 2017), Vice President, Product Development (2008 to 2016), and various officer positions (since 2008), Virtus Investment Partners, Inc. and/or certain of its subsidiaries; Senior Vice President (since
2021), The Merger Fund®, The Merger Fund® VL and Virtus Event Opportunities Trust; Senior Vice
President (since 2021), Virtus Investment Trust and Virtus Strategy Trust; Senior Vice President (since 2021), AllianzGI Closed-End Funds; Senior Vice President (since 2017) and Vice President (2008 to 2016), Virtus Mutual Fund Family; Senior Vice
President (since 2017) and Vice President (2010 to 2016), Virtus Variable Insurance Trust; Senior Vice President (since 2017) and Vice President (2013 to 2016), Virtus Alternative Solutions Trust; Senior Vice President (2017 to 2021) and Vice
President (2016 to 2017), Duff & Phelps Select MLP and Midstream Energy Fund Inc.; Senior Vice President (since 2017) and Vice President (2016 to 2017), Virtus Total Return Fund Inc. and Virtus Global Multi-Sector Income Fund; and Senior Vice
President (2017 to 2019) and Vice President (2016 to 2017), the former Virtus Total Return Fund Inc. |
Bradley,
W. Patrick
YOB: 1972 |
Executive
Vice President, Chief Financial Officer and Treasurer (since 2021). |
Executive
Vice President, Fund Services (since 2016), Senior Vice President, Fund Services (2010 to 2016), and various officer positions (since 2006), Virtus Investment Partners, Inc. and/or certain of its subsidiaries; Executive Vice President, Chief
Financial Officer and Treasurer (since 2021), The Merger Fund®, The Merger Fund® VL and Virtus
Event Opportunities Trust; Executive Vice President, Chief Financial Officer and Treasurer (since 2021), Virtus Investment Trust and Virtus Strategy Trust; Executive Vice President, Chief Financial Officer and Treasurer (since 2021), Virtus
AllianzGI Closed-End Funds; Director (since 2019), Virtus Global Funds ICAV; Executive Vice President (since 2016), Senior Vice President (2013 to 2016), Vice President (2011 to 2013), Chief Financial Officer and Treasurer (since 2004), Virtus
Variable Insurance Trust; Executive Vice President (since 2016), Senior Vice President (2013 to 2016), Vice President (2011 to 2013), Chief Financial Officer and Treasurer (since 2006), Virtus Mutual Fund Family; Executive Vice President (since
2016), Senior Vice President (2013 to 2016), Vice President (2012 to 2013) and Chief Financial Officer and Treasurer (since 2010), Virtus Total Return Fund Inc.; Executive Vice President (2016 to 2019), Senior Vice President (2013 to 2016), Vice
President (2012 to 2013), Chief Financial Officer and Treasurer (since 2010), the former Virtus Total Return Fund Inc.; Executive Vice President (since 2016), Senior Vice President (2013 to 2016), Vice President (2011 to 2013), Chief Financial
Officer and Treasurer (since 2011), Virtus Global Multi-Sector Income Fund; Executive Vice President ( 2016 to 2021), Senior Vice President (2014 to 2016), Chief Financial Officer and Treasurer (2014 to 2021), Duff & Phelps Select MLP and
Midstream Energy Fund Inc.; Executive Vice President (since 2016), Senior Vice President (2013 to 2016), and Chief Financial Officer and Treasurer (since 2013), Virtus Alternative Solutions Trust; Director (since 2013), Virtus Global Funds, PLC; and
Vice President and Assistant Treasurer (since 2011), Duff & Phelps Utility and Infrastructure Fund Inc. |
FUND MANAGEMENT TABLES
(Unaudited) (Continued)
Name,
Address and
Year of Birth |
|
Principal
Occupation(s) During Past 5 Years |
Carr,
Kevin J.
YOB: 1954 |
Senior
Vice President, Interim Chief Legal Officer and Assistant Secretary (since 2021). |
Vice
President and Senior Counsel (2017 to Present), Senior Vice President (2009 to 2017), Vice President, Counsel and Secretary (2008 to 2009), and various officer positions (since 2005), Virtus Investment Partners, Inc. and/or certain of its
subsidiaries; Senior Vice President, Interim Chief Legal Officer and Assistant Secretary (since 2021), The Merger Fund®, The Merger Fund® VL and Virtus Event Opportunities Trust; Senior Vice President, Interim Chief Legal Officer and Assistant Secretary (since 2021), Virtus Investment Trust and Virtus Strategy
Trust; Assistant Secretary, (since 2021), Virtus AllianzGI Closed-End Funds; Senior Vice President (since 2013), Vice President (2005 to 2013), Chief Legal Officer, Counsel and Secretary (since 2005), Virtus Mutual Fund Family; Interim Chief Legal
Officer (since 2021), Senior Vice President (2013 to 2014), Vice President (2012 to 2013), Secretary and Chief Legal Officer (2005 to 2013), Assistant Secretary (2013 to 2014 and since 2017), Virtus Total Return Fund Inc.; Senior Vice President
(2013 to 2014), Vice President (2012 to 2013), Secretary and Chief Legal Officer (2005 to 2013) and Assistant Secretary (2013 to 2014 and 2017 to 2019), the former Virtus Total Return Fund Inc.; Interim Chief Legal Officer (since 2021), Senior Vice
President (since 2017), Assistant Secretary (since 2013), Vice President, Chief Legal Officer, Counsel and Secretary (2010 to 2013), Virtus Variable Insurance Trust; Interim Chief Legal Officer (since 2021), Senior Vice President (2013 to 2014),
Vice President (2011 to 2013), Assistant Secretary (since 2011), Virtus Global Multi-Sector Income Fund; Assistant Secretary (2015 to 2021), Duff & Phelps Select MLP and Midstream Energy Fund Inc.; Interim Chief Legal Officer (since 2021),
Senior Vice President (since 2017) and Assistant Secretary (since 2013), Virtus Alternative Solutions Trust; Secretary (since 2015), ETFis Series Trust I; and Secretary (since 2015), Virtus ETF Trust II. |
Engberg,
Nancy J.
YOB: 1956 |
Senior
Vice President and Chief Compliance Officer (since 2021). |
Senior
Vice President (since 2017), Vice President (2008 to 2017) and Chief Compliance Officer (2008 to 2011 and since 2016), and various officer positions (since 2003), Virtus Investment Partners, Inc. and/or certain of its subsidiaries; Senior Vice
President and Chief Compliance Officer (since 2021), The Merger Fund®, The Merger Fund® VL and Virtus Event Opportunities Trust; Senior Vice President and Chief Compliance Officer (since 2021), Virtus Investment Trust, Virtus Strategy
Trust and Virtus AllianzGI Closed-End Funds; Senior Vice President (since 2017), Vice President (2011 to 2017) and Chief Compliance Officer (since 2011), Virtus Mutual Fund Family; Senior Vice President (since 2017), Vice President (2010 to 2017)
and Chief Compliance Officer (since 2011), Virtus Variable Insurance Trust; Senior Vice President (since 2017), Vice President (2011 to 2017) and Chief Compliance Officer (since 2011), Virtus Global Multi-Sector Income Fund; Senior Vice President
(since 2017), Vice President (2012 to 2017) and Chief Compliance Officer (since 2012), Virtus Total Return Fund Inc.; Senior Vice President (2017 to 2019), Vice President (2012 to 2017) and Chief Compliance Officer (2012 to 2019), the former Virtus
Total Return Fund Inc.; Senior Vice President (since 2017), Vice President (2013 to 2016) and Chief Compliance Officer (since 2013), Virtus Alternative Solutions Trust; Senior Vice President (2017 to 2021), Vice President (2014 to 2017) and Chief
Compliance Officer (2014 to 2021), Duff & Phelps Select MLP and Midstream Energy Fund Inc.; Chief Compliance Officer (since 2015), ETFis Series Trust I; and Chief Compliance Officer (since 2015), Virtus ETF Trust II. |
Fromm,
Jennifer
YOB: 1973 |
Vice
President, Chief Legal Officer, Counsel and Secretary (since 2021). |
Vice
President (since 2016) and Senior Counsel (since 2007), Virtus Investment Partners, Inc. and/or certain of its subsidiaries; Vice President, Chief Legal Officer, Counsel and Secretary (since 2021), The Merger Fund®, The Merger Fund® VL and Virtus Event Opportunities Trust; Vice President, Chief Legal Officer,
Counsel and Secretary (since 2021), Virtus Investment Trust and Virtus Strategy Trust; Vice President and Assistant Secretary (since 2021), Virtus AllianzGI Closed-End Funds; Vice President and Secretary (since 2020), DNP Select Income Fund Inc.,
Duff & Phelps Utility and Infrastructure Fund Inc., and DTF Tax-Free Income Inc.; Vice President, Chief Legal Officer and Secretary (2020 to 2021), Duff & Phelps Select MLP and Midstream Energy Fund Inc.; and Vice President, Chief Legal
Officer, Counsel and Secretary (since 2020), Virtus Total Return Fund Inc. and Virtus Global Multi-Sector Income Fund; Vice President (since 2017) and Assistant Secretary (since 2008), Virtus Mutual Funds Family; Vice President, Chief Legal Officer,
and Secretary (since 2013), Virtus Variable Insurance Trust; and Vice President, Chief Legal Officer, and Secretary (since 2013), Virtus Alternative Solutions Trust. |
FUND MANAGEMENT TABLES
(Unaudited) (Continued)
Name,
Address and
Year of Birth |
|
Principal
Occupation(s) During Past 5 Years |
Short,
Julia R.
YOB: 1972 |
Senior
Vice President (since 2021). |
Senior
Vice President, Product Development (since 2017), Virtus Investment Partners, Inc. and/or certain of its subsidiaries; Senior Vice President (since 2021), The Merger
Fund®, The Merger Fund® VL and Virtus Event Opportunities Trust; Senior Vice President (since
2021), Virtus Investment Trust, Virtus Strategy Trust and Virtus Closed-End Funds; Senior Vice President (2018 to 2021), Duff & Phelps Select MLP and Midstream Energy Fund Inc.; and Senior Vice President (since 2018), Virtus Global Multi-Sector
Income Fund and Virtus Total Return Fund Inc.; Senior Vice President (2018 to 2019), the former Virtus Total Return Fund Inc.; Senior Vice President (since 2017), Virtus Mutual Fund Family; President and Chief Executive Officer, RidgeWorth Funds
(2007 to 2017); and Managing Director, Product Manager, RidgeWorth Investments (2004 to 2017). |
Smirl,
Richard W.
YOB: 1967 |
Executive
Vice President (since 2021). |
Executive
Vice President, Product Management (since 2021), and Executive Vice President and Chief Operating Officer (since 2021), Virtus Investment Partners, Inc. and/or certain of its subsidiaries; Executive Vice President (since 2021), The Merger Fund®, The Merger Fund® VL and Virtus Event Opportunities Trust; Executive Vice President (since 2021),
Virtus Mutual Fund Family, Virtus Investment Trust, Virtus Strategy Trust, Virtus Global Multi-Sector Income Fund, and Virtus Total Return Fund Inc.; Executive Vice President (May to June 2021), Duff & Phelps Select MLP and Midstream Energy Fund
Inc.; Chief Operating Officer (2018 to 2021), Russell Investments; Executive Director (Jan. to July 2018), State of Wisconsin Investment Board; and Partner and Chief Operating Officer (2004 to 2018), William Blair Investment Management.
|
Virtus AllianzGI
Emerging Markets Consumer Fund,
a series of Virtus Strategy
Trust
(unaudited)
Supplement dated November 2, 2021 to the Summary
Prospectus,
Statutory Prospectus and Statement of Additional Information,
each dated February 1, 2021, as supplemented
IMPORTANT NOTICE TO INVESTORS
On November 2, 2021, the Board of Trustees of
Virtus Strategy Trust voted to approve a Plan of Liquidation of the Virtus AllianzGI Emerging Markets Consumer Fund (the “Fund”), pursuant to which the Fund will be liquidated (the
“Liquidation”) on or about December 7, 2021 (“Liquidation Date”).
Effective November 12, 2021, the Fund will be
closed to new investors and additional investor deposits. The Fund’s investments may be sold in advance of November 12, 2021.
At any time prior to the Liquidation Date,
shareholders may redeem their shares or exchange their shares of the Fund for shares of the same class of any other Virtus Mutual Fund. There will be no fee or sales charges associated with exchange or redemption requests.
Prior to the Liquidation Date, the Fund will begin
engaging in business and activities for the purposes of winding down the Fund’s business affairs and transitioning some or all of the Fund’s portfolios to cash and cash equivalents in preparation for the orderly liquidation and
subsequent distribution of its assets on the Liquidation Date. During this transition period, the Fund will no longer pursue its investment objective or be managed consistent with its investment strategies as stated in the Prospectuses. This is
likely to impact the Fund’s performance. The impending Liquidation of the Fund may result in large redemptions, which could adversely affect the Fund’s expense ratios. Those shareholders who remain invested in the Fund during part or all
of this transition period may bear increased brokerage and other transaction expenses relating to the sale of portfolio investments prior to the Liquidation Date.
On the Liquidation Date, any outstanding shares of
the Fund will be automatically redeemed as of the close of business, except shares held in BNY Mellon IS Trust Company custodial accounts, which will be exchanged for shares of the Virtus Seix U.S. Government Securities Ultra-Short Bond Fund.
Shareholders with BNY Mellon IS Trust Company custodial accounts should consult the prospectus for the Virtus Seix U.S. Government Securities Ultra-Short Bond Fund for information about that fund. The proceeds of any redemption will be equal to the
net asset value of such shares after the Fund has paid or provided for all charges, taxes, expenses and liabilities. The distribution to shareholders of these liquidation proceeds will occur as soon as practicable, and will be made to all Fund
shareholders of record at the time of the Liquidation. Additionally, the Fund must declare and distribute to shareholders any realized capital gains and all net investment income no later than the final liquidation distribution. The Fund intends to
distribute substantially all of its net investment income prior to the Liquidation.
Although shareholders are expected to receive
proceeds of the Liquidation in cash, proceeds distributed to shareholders may be paid in cash, cash equivalents, or portfolio investments equal to the shareholder’s proportionate interest in the net assets of the Fund (the latter payment
method, “in kind”). Shareholders who receive proceeds in kind should expect (i) that the in kind distribution will be subject to market and other risks, such as liquidity risk, before sale, and (ii) to incur transaction costs, including
brokerage costs, when converting the investments to cash.
Because the exchange or redemption of your shares
could be a taxable event, we suggest you consult with your tax advisor prior to the Fund’s liquidation.
Investors should retain this supplement with the
Prospectuses and
Statement of Additional Information for future reference.
VST 8060/AGI EM Consumer Fund Closing
(11/2021)
Virtus AllianzGI Convertible Fund, Virtus
AllianzGI Global Allocation Fund,
Virtus AllianzGI Global
Dynamic Allocation Fund, Virtus AllianzGI HighYield Bond Fund,
Virtus AllianzGI International Small-Cap Fund, Virtus AllianzGI
Short Duration High Income Fund,
Virtus AllianzGI Water Fund and Virtus NFJ Emerging Markets Value Fund, (each a “Fund”, and
together, the “Funds”), each a series of Virtus Strategy Trust
(unaudited)
Supplement dated September 8, 2021 to the Summary
Prospectuses and the Virtus Strategy Trust
Statutory Prospectus, each dated February 1, 2021, as supplemented
IMPORTANT NOTICE TO INVESTORS
The 1 Year Return Before Taxes
(“Returns”) for Class C shares were understated in the Average Annual Total Return table in each Fund’s summary prospectus and in the summary section of the Funds’ statutory prospectus. The Returns are therefore hereby
corrected for each of the Funds as follows:
| Fund
|
Class
C
1 Year Return Before Taxes |
| Virtus
AllianzGI Convertible Fund |
54.19%
|
| Virtus
AllianzGI Global Allocation Fund |
13.04%
|
| Virtus
AllianzGI Global Dynamic Allocation Fund |
12.53%
|
| Virtus
AllianzGI High Yield Bond Fund |
2.68%
|
| Virtus
AllianzGI International Small-Cap Fund |
14.79%
|
| Virtus
AllianzGI Short Duration High Income Fund |
5.44%
|
| Virtus
AllianzGI Water Fund |
15.78%
|
| Virtus
NFJ Emerging Markets Value Fund |
21.38%
|
In the “Sales
Charges” section of the Funds’ statutory prospectus under the subheading “Sales Charge you may pay to purchase Class A Shares” the table for Virtus AllianzGI High Yield Bond Fund is hereby replaced with the following:
| |
Sales
Charge as a percentage of
Net Amount |
| Amount
of Transaction at Offering Price |
Offering
Price |
Invested
|
|
$0–$49,999
|
3.75%
|
3.90%
|
|
$50,000–$99,999
|
3.50%
|
3.90%
|
|
$100,000–$249,999
|
3.25%
|
3.36%
|
|
$250,000–$499,999
|
2.25%
|
2.30%
|
|
$500,000–$999,999
|
1.75%
|
1.78%
|
|
$1,000,000-$3,000,000
|
0.00%
|
0.00%
|
|
$3,000,000+
|
0.00%
|
0.00%
|
All other disclosure
concerning the Funds, including fees, expenses, investment objective, strategies and risks remains unchanged.
Investors should retain this supplement with the
Prospectuses for future reference.
VST 8060
ClassC-ATR/HYB SalesCharge Correction (9/2021)
Virtus AllianzGI Global Allocation Fund and
Virtus AllianzGI Global Dynamic Allocation Fund,
each a series of Virtus Strategy Trust
(unaudited)
Supplement dated July 27, 2021 to the Summary
Prospectus and the Virtus Strategy
Trust Statutory Prospectus, each dated February 1, 2021, as supplemented
IMPORTANT NOTICE TO
INVESTORS
Effective August 2, 2021,
Michael Heldmann, CFA, will no longer be a portfolio manager of Virtus AllianzGI Global Allocation Fund and Virtus AllianzGI Global Dynamic Allocation Fund (each a “Fund”, and together, the “Funds”), and Rohit Ramesh will be
added as a portfolio manager of the Funds.
Virtus AllianzGI Global Allocation Fund
The disclosure under “Portfolio
Management” in the Fund’s summary prospectus and in the summary section of the Fund’s statutory prospectus will be replaced in its entirety with the following:
• Heather Bergman, Ph.D., lead portfolio manager and director, has managed the fund since 2017.
• Claudio Marsala, portfolio manager and director and Head of Multi Asset US, has managed the fund since February 2021.
• Paul Pietranico, CFA, portfolio manager and director, has managed the fund since 2009.
• Carl W. Pappo, Jr., CFA, portfolio manager, managing director and CIO US Fixed Income, has managed the fund since 2019.
• Rohit Ramesh, portfolio manager and director, has managed the fund since August 2021.
Virtus AllianzGI Global Dynamic Allocation
Fund
The disclosure under “Portfolio
Management” in the Fund’s summary prospectus and in the summary section of the Fund’s statutory prospectus will be replaced in its entirety with the following:
• Paul Pietranico, CFA, lead portfolio manager and director, has managed the fund since 2016.
• Mikhail Krayzler, Ph.D., portfolio manager, has managed the fund since 2020.
• Claudio Marsala, portfolio manager and director and Head of Multi Asset US, has managed the fund since 2015.
• Carl W. Pappo, Jr., CFA, portfolio manager, managing director and CIO US Fixed Income, has managed the US Fixed Income - Credit sleeve of the fund since
2019.
• Rohit Ramesh, portfolio manager and director, has managed the fund since August 2021.
• Thorsten Winkelmann, portfolio manager, managing director and CIO Global Growth, has managed the Global Growth sleeve of the fund since 2020.
Virtus AllianzGI Global Allocation Fund and
Virtus AllianzGI Global Dynamic Allocation Fund,
each a series of Virtus Strategy Trust
(unaudited)
Both Funds
In the Management of the Funds section under
“Portfolio Management” on page 142 of the Funds’ statutory prospectus, the rows for the Funds in the table under the subheading “AllianzGI” will be replaced with the following:
| Virtus
AllianzGI Global Allocation Fund |
Heather
Bergman, Ph.D. (since 2017)
Claudio Marsala (since February 2021)
Carl W. Pappo, Jr., CFA (since 2019)
Paul Pietranico, CFA (since 2009)
Rohit Ramesh (since August 2021) |
| Virtus
AllianzGI Global Dynamic Allocation Fund |
Mikhail
Krayzler, Ph.D. (since 2020)
Claudio Marsala (since 2015)
Carl W. Pappo, Jr., CFA (since 2019)
Paul Pietranico, CFA (since 2016)
Rohit Ramesh (since August 2021)
Thorsten Winkelmann (since 2020) |
The portfolio manager biographies under the
referenced table will be amended by removing the reference to Michael Heldmann, CFA, and adding the following for Rohit Ramesh:
Rohit Ramesh. Mr. Ramesh is a senior portfolio manager and a director with Allianz Global Investors, which he joined in 2007. He manages Best Styles mandates in the North American region and mandates focused on US
and Global equities. Mr. Ramesh was previously a member of the firm’s Asia Pacific team, focusing on emerging-market companies, and also managed the Best Styles Emerging markets mandates. Before joining the firm, he worked at DaimlerChrysler
Asia Pacific in Singapore as an emerging markets analyst. He has 14 years of investment industry experience. Mr. Ramesh has a bachelor’s degree in finance and accounting from the University of Bombay, India; a master’s degree in
economics and management from the National University of Singapore; and an MBA in Finance from University of St. Gallen, Switzerland.
All other disclosure concerning the Funds,
including fees, expenses, investment objective, strategies and risks will remain unchanged.
Investors should retain this supplement with the
Prospectuses for future reference.
VST 8060
AllianzGI GA-GDA PM Changes (7/2021)
Virtus AllianzGI International Small-Cap
Fund,
a series of Virtus Strategy Trust
(unaudited)
Supplement dated July 27, 2021 to the Summary
Prospectus and the Virtus Strategy Trust
Statutory Prospectus, each dated February 1, 2021, as supplemented
IMPORTANT NOTICE TO INVESTORS
Effective October 1, 2021, Jasmine To will be added
as a portfolio manager of Virtus AllianzGI International Small-Cap Fund (the “Fund”).
The following disclosure will be added under
“Portfolio Management” in the summary prospectus for the Fund, and in the summary section of the Fund’s statutory prospectus:
• Jasmine To, portfolio manager, has managed the fund since October 2021.
In the Management of the Funds section under
“Portfolio Management” on page 142 of the Fund’s statutory prospectus, the row for the Fund in the table under the subheading “AllianzGI” will be replaced with the following:
| Virtus
AllianzGI International Small-Cap Fund |
Heinrich
Ey, CFA, DVFA/CEFA (since 2016)
Bjoern Mehrmann (since 2012)
Koji Nakatsuka, CFA, CMA (since 2012)
Andrew Neville (since 2012)
Miguel Pohl, CFA (since 2018)
Jasmine To, (since October 2021)
Stuart Winchester, CFA (since
2020) |
The portfolio
manager biographies under the referenced table will be amended by adding the following for Jasmine To:
Jasmine To. Ms. To is a portfolio manager with Allianz Global Investors, which she joined in 2017. She started at AllianzGI as a research analyst specializing in smaller companies across Asia ex Japan. Prior to
joining the firm, she worked at Point72 Asset Management as a research analyst focused on consumer and automotive sectors in China. Ms. To also previously worked in the Corporate Finance team at Li & Fund, and as an investment banking analyst at
Deutsche Bank, involved in equity and debt capital markets and M&A transactions. Ms. To has 10 years of investment industry experience. She holds a Bachelor of Science degree in Economics from London School of Economics.
All other disclosure concerning the Fund, including
fees, expenses, investment objective, strategies and risks will remain unchanged.
Investors should retain this supplement with the
Prospectuses for future reference.
VST 8060
AllianzGI Int’l Small-Cap PM Changes (7/2021)
Virtus AllianzGI High Yield Bond Fund, Virtus
AllianzGI Convertible Fund
and Virtus AllianzGI Short Duration High Income Fund,
each a series of Virtus Strategy Trust
(unaudited)
Supplement dated July 16, 2021 to the Summary
Prospectuses, the Virtus Strategy Trust
Statutory Prospectus and the Statement of Additional Information (“SAI”),
each dated February 1, 2021, as supplemented
IMPORTANT NOTICE TO INVESTORS
Allianz Global Investors U.S. LLC
(“AllianzGI”) announced that effective March 1, 2022, Douglas G. Forsyth will be stepping down as portfolio manager for the Virtus AllianzGI High Yield Bond Fund, Virtus AllianzGI Convertible Fund and Virtus AllianzGI Short Duration High
Income Fund, (the “Funds”). There will be no changes to the investment processes for the Funds, which are team oriented. The Prospectuses and SAI will be updated as appropriate up to and including at the time of the transition.
Investors should retain this supplement with the
Prospectuses and SAI for future reference.
VST 8060/AGI PM Announcement (7/2021)
THIS PAGE
INTENTIONALLY BLANK.
THIS PAGE
INTENTIONALLY BLANK.
THIS PAGE
INTENTIONALLY BLANK.
VIRTUS STRATEGY TRUST
101 Munson Street
Greenfield, MA 01301-9668
Trustees
Philip R. McLoughlin, Chairman
George R. Aylward
Donald C. Burke
Sarah E. Cogan
Deborah A. DeCotis
F. Ford Drummond
Sidney E. Harris
John R. Mallin
Connie D. McDaniel
Geraldine M. McNamara
R. Keith Walton
Brian T. Zino
Advisory Board Member
William R. Moyer
Officers
George R. Aylward, President
Peter Batchelar, Senior Vice President
W. Patrick Bradley, Executive
Vice President, Chief Financial Officer and Treasurer
Kevin J. Carr, Vice President,
Interim Chief Legal Officer and Assistant Secretary
Nancy J. Engberg, Senior Vice
President and Chief Compliance Officer
Julia R. Short, Senior Vice
President
Richard W. Smirl, Executive Vice President
Investment Adviser
Virtus Investment Advisers, Inc.
One Financial Plaza
Hartford, CT 06103-2608
Principal Underwriter
VP Distributors, LLC
One Financial Plaza
Hartford, CT 06103-2608
Administrator and Transfer Agent
Virtus Fund Services, LLC
One Financial Plaza
Hartford, CT 06103-2608
Custodian
The Bank of New York Mellon
240 Greenwich Street
New York, NY 10286-1048
Independent Registered Public
Accounting Firm
PricewaterhouseCoopers LLP
2001 Market Street
Philadelphia, PA 19103-7042
How to Contact Us
| Mutual
Fund Services |
1-800-243-1574
|
| Adviser
Consulting Group |
1-800-243-4361
|
Important Notice to Shareholders
The Securities and Exchange Commission has modified mailing regulations for semiannual and annual shareholder fund reports to allow mutual fund companies to send a single copy of these reports to shareholders who share
the same mailing address. If you would like additional copies, please call Mutual Fund Services at 1-800-243-1574.
P.O. Box 9874
Providence, RI 02940-8074
For more
information about Virtus Mutual Funds,
please contact us at 1-800-243-1574, or visit Virtus.com.
Item 2. Code of Ethics.
| |
(a) |
The registrant, as of the end of the period covered by this report, has adopted a code of ethics that applies
to the registrant’s principal executive officer, principal financial officer, principal accounting officer or controller, or persons performing similar functions, regardless of whether these individuals are employed by the registrant or a third
party. |
| |
(b) |
Effective October 20, 2021, the code of ethics that applies to the registrant’s principal executive
officer, principal financial officer, principal accounting officer or controller, or persons performing similar functions was amended. A copy of the currently applicable code is included as an exhibit. |
| |
(d) |
The registrant has not granted any waivers, during the period covered by this report, including an implicit
waiver, from a provision of the code of ethics that applies to the registrant’s principal executive officer, principal financial officer, principal accounting officer or controller, or persons performing similar functions, regardless of whether
these individuals are employed by the registrant or a third party, that relates to one or more of the items set forth in paragraph (b) of the instructions for completion of this Item. |
Item 3. Audit Committee Financial Expert.
| |
(a)(1) |
The Registrant’s Board of Trustees has determined that the Registrant has an “audit committee
financial expert” serving on its Audit Committee. |
| |
(a)(2) |
As of the beginning of the period covered by the report, the Registrant’s Board of Trustees had determined
that James A. Jacobson and Davey S. Scoon, both of whom served on the Trust’s Audit Oversight Committee, qualified as “audit committee financial experts” and were “independent” for purposes of this Item. On February 1,
2021, the members of the Board changed, the Audit Oversight Committee changed to the Audit Committee and its membership changed, and as a result the Registrant’s Board of Trustees reviewed the new membership to determine whether the members
possess the technical attributes identified in Instruction 2(b) of Item 3 to Form N-CSR to qualify as an “audit committee financial expert” and determined that each of Donald C. Burke, Connie D.
McDaniel and Brian T. Zino possesses such attributes. Each of Messrs. Burke and Zino, and Ms. McDaniel, was an “independent” trustee pursuant to paragraph (a)(2) of Item 3 to Form N-CSR as of
the end of the period covered by the report. |
Item 4. Principal Accountant Fees and Services.
| |
• |
|
Registrant may incorporate the following information by reference, if this information has been disclosed in the
registrant’s definitive proxy statement or definitive information statement. The proxy statement or information statement must be filed no later than 120 days after the end of the fiscal year covered by the Annual Report.
|
Audit Fees
| |
(a) |
The aggregate fees billed for each of the last two fiscal years for professional services rendered by the
principal accountant for the audit of the registrant’s annual financial statements or services that are normally provided by the accountant in connection with statutory and regulatory filings or engagements for fiscal years ended
September 30, 2020 and September 30, 2021 are $717,922 and $297,700, respectively. |
Audit-Related Fees
| |
(b) |
The aggregate fees billed in each of the last two fiscal years for assurance and related services by the
principal accountant that are reasonably related to the performance of the audit of the registrant’s financial statements and are not reported under paragraph (a) of this Item for fiscal years ended September 30, 2020 and
September 30, 2021 are $0 and $93,577, respectively. Such audit-related fees include out of pocket expenses. |
Tax Fees
| |
(c) |
The aggregate fees billed in each of the last two fiscal years for professional services rendered by the
principal accountant for tax compliance, tax advice, and tax planning for fiscal years ended September 30, 2020 and September 30, 2021 are $405,000 and $68,370, respectively. |
“Tax Fees” are those primarily associated with review of the Trust’s tax provision and qualification as a regulated investment
company (RIC) in connection with audits of the Trust’s financial statement, review of year-end distributions by the Fund to avoid excise tax for the Trust, periodic discussion with management on tax
issues affecting the Trust, and reviewing and signing the Fund’s federal income tax returns.
All Other Fees
| |
(d) |
The aggregate fees billed in each of the last two fiscal years for products and services provided by the
principal accountant, other than the services reported in paragraphs (a) through (c) of this Item are for fiscal years ended September 30, 2020 and September 30, 2021 are $0 and $0, respectively. |
| |
(e)(1) |
Disclose the audit committee’s pre-approval policies and
procedures described in paragraph (c)(7) of Rule 2-01 of Regulation S-X. |
The Board of Trustees of Virtus Strategy Trust (the “Fund”) has adopted policies and procedures with regard to the pre-approval of services provided by its independent auditors. Audit, audit-related and tax compliance services provided to the Fund on an annual basis require specific
pre-approval by the Audit Committee. The Audit Committee must also approve other non-audit
services provided to the Fund and those non-audit services provided to the Fund’s Affiliated Service Providers that relate directly to the operations
and financial reporting of the Fund. Certain of these non-audit services that the Audit Committee believes are a) consistent with the SEC’s auditor independence rules and b) routine and recurring services
that will not impair the independence of the independent auditors may be approved by the Audit Committee without consideration on a specific case-by-case basis
(“general pre-approval”).
The Audit Committee has determined that
Ms. Connie D. McDaniel, Chair of the Audit Committee, may provide pre-approval for such services that meet the above requirements in the event such approval is sought between regularly scheduled
meetings. In any event, the Audit Committee is informed of, and ratifies, each service approved subject to general pre-approval at the next regularly scheduled in-person
Audit Committee meeting.
| |
(e)(2) |
The percentage of services described in each of paragraphs (b) through (d) of this Item that were approved
by the audit committee pursuant to paragraph (c)(7)(i)(C) of Rule 2-01 of Regulation S-X are as follows: |
(b) 0%
(c) 0%
(d) N/A
| |
(f) |
The percentage of hours expended on the principal accountant’s engagement to audit the registrant’s
financial statements for the most recent fiscal year that were attributed to work performed by persons other than the principal accountant’s full-time, permanent employees was less than fifty percent. |
| |
(g) |
The aggregate non-audit fees billed by the registrant’s accountant
for services rendered to the registrant, and rendered to the registrant’s investment adviser (not including any sub-adviser whose role is primarily portfolio management and is subcontracted with or
overseen by another investment adviser), and any entity controlling, controlled by, or under common control with the adviser that provides ongoing services to the registrant for fiscal years ended September 30, 2020 and September 30, 2021
are $1,623,815 and $161,947, respectively. |
| |
(h) |
The registrant’s audit committee of the board of directors has considered whether the provision of non-audit services that were rendered to the registrant’s investment adviser (not including any sub-adviser whose role is primarily portfolio management and is
subcontracted with or overseen by another investment adviser), and any entity controlling, controlled by, or under common control with the investment adviser that provides ongoing services to the registrant that were not pre-approved pursuant to paragraph (c)(7)(ii) of Rule 2-01 of Regulation S-X is compatible with maintaining the principal
accountant’s independence. |
Item 5. Audit Committee of Listed Registrants.
Not applicable.
Item 6. Investments.
| |
(a) |
Schedule of Investments in securities of unaffiliated issuers as of the close of the reporting period is
included as part of the report to shareholders filed under Item 1(a) of this form. |
Item 7. Disclosure of Proxy Voting Policies and Procedures for Closed-End Management Investment Companies.
Not applicable.
Item 8. Portfolio Managers of Closed-End Management Investment Companies.
Not applicable.
Item 9. Purchases of Equity Securities by Closed-End Management Investment Company and Affiliated Purchasers.
Not applicable.
Item 10. Submission of Matters
to a Vote of Security Holders.
Effective February 1, 2021, the Board has adopted a new policy for consideration of Trustee nominees recommended
by shareholders. With regards to such policy, an individual shareholder or shareholder group submitting a nomination must hold either individually or in the aggregate for at least one full year as of the date of nomination 5% of the shares of a
series of the Trust, among other qualifications and restrictions. Shareholders or shareholder groups submitting nominees must comply with all requirements set forth in the Trust’s policy for consideration of Trustee nominees recommended by
shareholders and any such submission must be in writing, directed to the attention of the Board’s Governance and Nominating Committee in care of the Trust’s Secretary, and should include biographical information, including business
experience for the past ten years and a description of the qualifications of the proposed nominee, along with a statement from the proposed nominee that he or she is willing to serve and meets the requirements to be an Independent Trustee, if
applicable. Shareholder nominees for Trustee will be given the same consideration as any candidate provided the nominee meets certain minimum requirements.
Item 11. Controls and Procedures.
| |
(a) |
The registrant’s principal executive and principal financial officers, or persons performing similar
functions, have concluded that the registrant’s disclosure controls and procedures (as defined in Rule 30a-3(c) under the Investment Company Act of 1940, as amended (the “1940 Act”) (17 CFR 270.30a-3(c))) are effective, as of a date within 90 days of the filing date of the report that includes the disclosure required by this paragraph, based on their evaluation of these controls and procedures required
by Rule 30a-3(b) under the 1940 Act (17 CFR 270.30a-3(b)) and Rules 13a-15(b) or
15d-15(b) under the Securities Exchange Act of 1934, as amended (17 CFR 240.13a-15(b) or 240.15d-15(b)). |
| |
(b) |
There were no changes in the registrant’s internal control over financial reporting (as defined in Rule 30a-3(d) under the 1940 Act (17 CFR 270.30a-3(d))) that occurred during the period covered by this report that has materially affected, or is reasonably likely to materially
affect, the registrant’s internal control over financial reporting. |
Item 12. Disclosure of Securities Lending Activities
for Closed-End Management Investment Companies.
Not applicable.
Item
13. Exhibits.
(a)(1) Code of ethics, or any amendment thereto, that is the subject of disclosure required
by Item 2 is attached hereto.
(a)(2) Certifications pursuant to Rule 30a-2(a)
under the 1940 Act and Section 302 of the Sarbanes-Oxley Act of 2002 are attached hereto.
(a)(2)(1) Not applicable.
(a)(2)(2) Not applicable.
SIGNATURES
Pursuant to the requirements of the Securities Exchange Act of 1934 and the Investment Company Act of 1940, the registrant has duly caused this report to be
signed on its behalf by the undersigned, thereunto duly authorized.
|
|
|
| (Registrant) Virtus Strategy Trust |
|
|
| By (Signature and Title)* |
|
/s/ George R. Aylward |
|
|
George R. Aylward, President |
|
|
(principal executive officer) |
Date 12/7/21
Pursuant to the requirements of the Securities Exchange Act of 1934 and the Investment Company Act of 1940, this report has been signed below by the following
persons on behalf of the registrant and in the capacities and on the dates indicated.
|
|
|
| By (Signature and Title)* |
|
/s/ George R. Aylward |
|
|
George R. Aylward, President |
|
|
(principal executive officer) |
Date 12/7/21
|
|
|
| By (Signature and Title)* |
|
/s/ W. Patrick Bradley |
|
|
W. Patrick Bradley, Executive Vice President, Chief Financial Officer, and Treasurer |
|
|
(principal financial officer) |
Date 12/7/21
| * |
Print the name and title of each signing officer under his or her signature. |