February 2015
Issuer Free Writing Prospectus
Registration Statement No. 333-199160
Dated February 23, 2015
Filed pursuant to Rule 433
Investor Presentation February 2015 v. 2008 - 06 - 24 Sino - Global Shipping America, Ltd. (NasdaqCM: SINO)
Safe Harbor Statement Statements in this presentation may be "forward - looking statements" within the meaning of federal securities laws . You can identify these forward - looking statements by terminology such as “will”, “expects”, “anticipates”, “estimates”, “plans”, “future”, “intends”, “believes” and similar statements . The matters discussed herein that are forward - looking statements are based on management’s current expectations that involve risks and uncertainties that may result in such expectations not being realized . Forward - looking statements involve risks and uncertainties that may cause actual results, performance or financial condition to be materially different from the expectations of future results, performance or financial condition expressed or implied in any forward - looking statements . Such factors include, but are not limited to, the Company's ability to expand its service platform and grow its revenues, political and economic factors in the People's Republic of China, the Company's ability to find attractive acquisition candidates, the Company’s ability to acquire and successfully operate the vessel, dependence on a limited number of key customers and other factors detailed in the Company’s filings with the Securities and Exchange Commission . Actual outcomes and results may differ materially from what is expressed or forecasted in such forward - looking statements due to numerous potential risks and uncertainties . Forward - looking statements made during this presentation speak only as of the date on which they are made, and we do not undertake any obligation to update any forward - looking statement to reflect events or circumstances after the date of this presentation . Because forward - looking statements are subject to risks and uncertainties, we caution you not to place undue reliance on any forward - looking statements . All written or oral forward - looking statements by the Company or persons acting on its behalf are qualified by these cautionary statements . We undertake no obligation to publicly update or revise any forward - looking statements or other information or data contained in this presentation, whether to reflect any change in our expectations with respect to such statements or any change in events, conditions or circumstances on which any such statements are based or otherwise . 2 Sino - Global Shipping America, Ltd . (“Sino” or the “Company”) has filed a registration statement (including a prospectus) with the SEC for the offering to which this communication relates . Before you invest, you should read the prospectus in that registration statement and other documents the Company has filed with the SEC for more complete information about the Company and this offering . You may access these documents for free by visiting EDGAR on the SEC web site at www . sec . gov . Alternatively, the Company, any underwriter or dealer participating in the offering will arrange to send you the prospectus if you request it by calling Aegis Capital Corp . , Attention : Prospectus Department at 212 - 813 - 1010 or by email to prospectus@aegiscap . com .
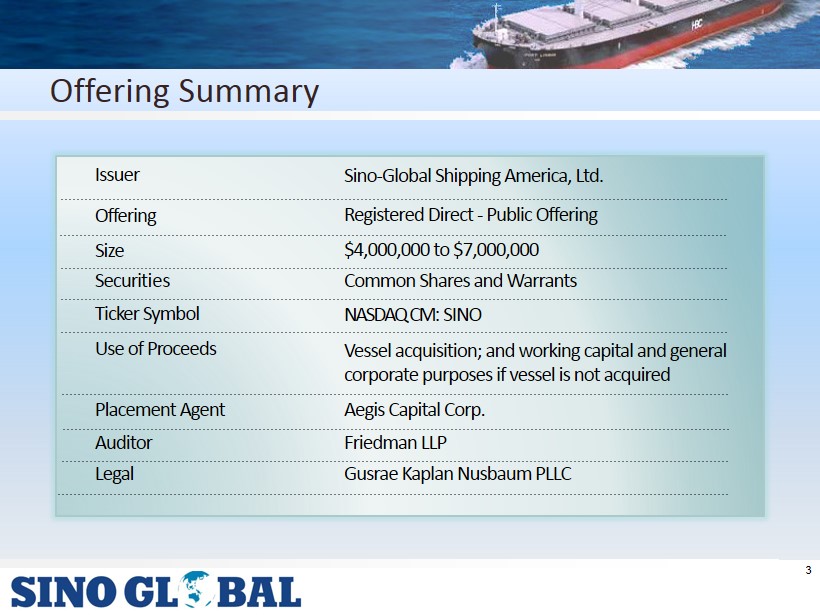
Offering Summary I ssuer Sino - Global Shipping America, Ltd. Of f ering Registered Direct - Public Offering Securi t ies Common Shares and Warrants Tic k e r Symbol NASDAQ CM : SINO Us e o f P r o c eeds Vessel acquisition; and working c apital and general c orporate p urposes if vessel is not acquired Placement Agent Aegis Capital Corp. Size $4,000,000 to $ 7 ,000,000 Auditor Friedman LLP Legal Gusrae Kaplan Nusbaum PLLC 3
4 Company Overview
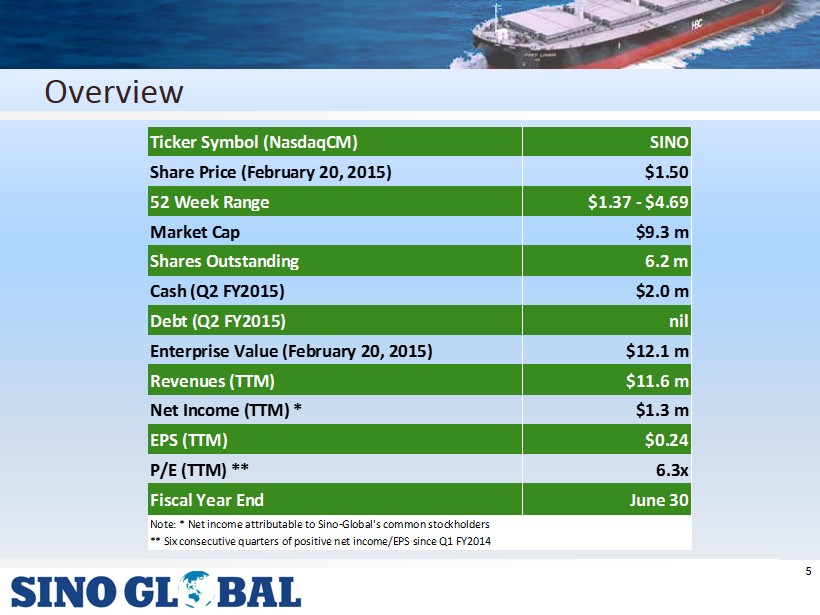
Overview 5 Ticker Symbol (NasdaqCM) SINO Share Price (February 20, 2015) $1.50 52 Week Range $1.37 - $4.69 Market Cap $9.3 m Shares Outstanding 6.2 m Cash (Q2 FY2015) $2.0 m Debt (Q2 FY2015) nil Enterprise Value (February 20, 2015) $12.1 m Revenues (TTM) $11.6 m Net Income (TTM) * $1.3 m EPS (TTM) $0.24 P/E (TTM) ** 6.3x Fiscal Year End June 30 Note: * Net income attributable to Sino-Global's common stockholders ** Six consecutive quarters of positive net income/EPS since Q1 FY2014
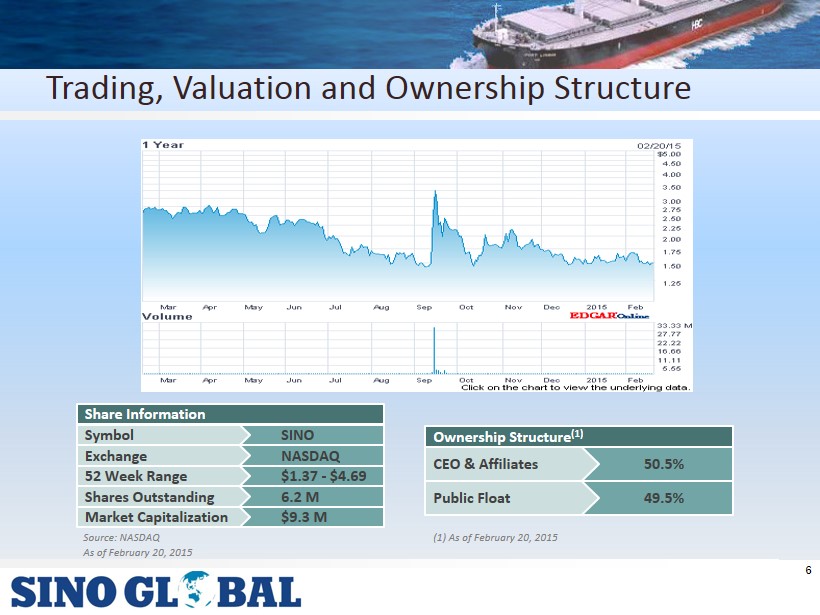
Trading , Valuation and Ownership Structure Source : NASDAQ As of February 20 , 2015 ( 1 ) As of February 20 , 2015 6.2 M Shares Outstanding SINO Symbol NASDAQ Exchange $1.37 - $ 4.69 52 Week Range $ 9 .3 M Market Capitalization Share Information 50.5 % CEO & Affiliates 49.5 % Public Float Ownership Structure (1) 6
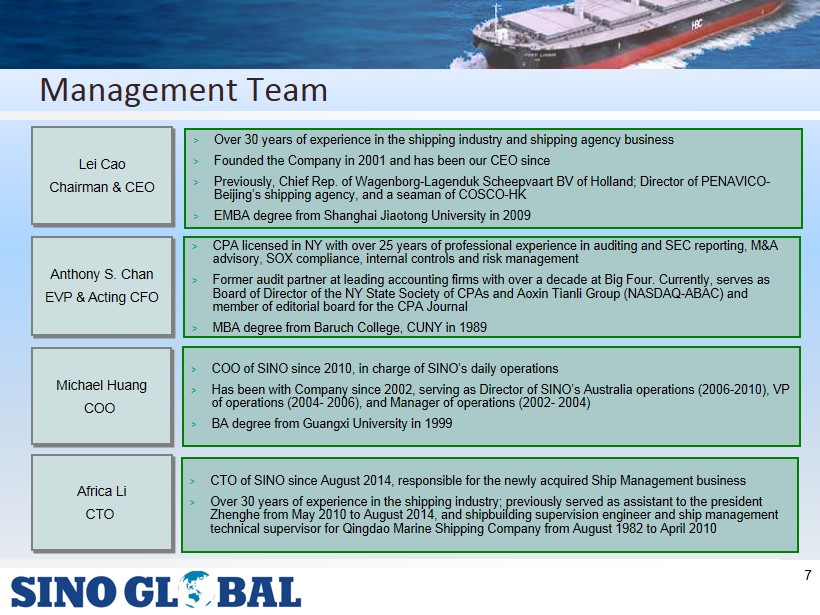
Management Team 7 > Over 30 years of experience in the shipping industry and shipping agency business > Founded the Company in 2001 and has been our CEO since > Previously, Chief Rep. of Wagenborg - Lagenduk Scheepvaart BV of Holland; Director of PENAVICO - Beijing’s shipping agency, and a seaman of COSCO - HK > EMBA degree from Shanghai Jiaotong University in 2009 Lei Cao Chairman & CEO Anthony S. Chan EVP & Acting CFO > COO of SINO since 2010, in charge of SINO’s daily operations > Has been with Company since 2002, serving as Director of SINO’s Australia operations (2006 - 2010), VP of operations (2004 - 2006), and Manager of operations (2002 - 2004 ) > BA degree from Guangxi University in 1999 Africa Li CTO > CPA licensed in NY with over 25 years of professional experience in auditing and SEC reporting, M& A advisory, SOX compliance, internal controls and risk management > Former audit partner at leading accounting firms with over a decade at Big Four. Currently, serves as Board of Director of the NY State Society of CPAs and Aoxin Tianli Group (NASDAQ - ABAC) and member of editorial board for the CPA Journal > MBA degree from Baruch College, CUNY in 1989 Michael Huang COO > CTO of SINO since August 2014, responsible for the newly acquired Ship Management business > Over 30 years of experience in the shipping industry; previously served as assistant to the president Zhenghe from May 2010 to August 2014, and shipbuilding supervision engineer and ship management technical supervisor for Qingdao Marine Shipping Company from August 1982 to April 2010
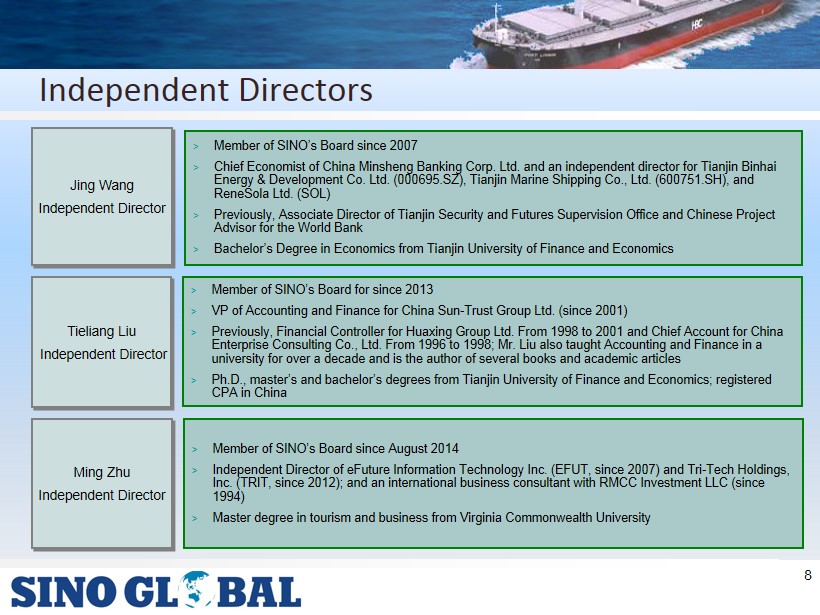
Independent Directors 8 > Member of SINO’s Board since 2007 > Chief Economist of China Minsheng Banking Corp. Ltd. and an independent director for Tianjin Binhai Energy & Development Co. Ltd. (000695.SZ), Tianjin Marine Shipping Co., Ltd. (600751.SH), and ReneSola Ltd. (SOL) > Previously, Associate Director of Tianjin Security and Futures Supervision Office and Chinese Project Advisor for the World Bank > Bachelor’s Degree in Economics from Tianjin University of Finance and Economics Jing Wang Independent Director Ming Zhu Independent Director > Member of SINO’s Board for since 2013 > VP of Accounting and Finance for China Sun - Trust Group Ltd. (since 2001) > Previously, Financial Controller for Huaxing Group Ltd. From 1998 to 2001 and Chief Account for China Enterprise Consulting Co., Ltd. From 1996 to 1998; Mr. Liu also taught Accounting and Finance in a university for over a decade and is the author of several books and academic articles > Ph.D., master’s and bachelor’s degrees from Tianjin University of Finance and Economics; registered CPA in China > Member of SINO’s Board since August 2014 > Independent Director of eFuture Information Technology Inc. (EFUT, since 2007) and Tri - Tech Holdings, Inc. (TRIT, since 2012); and an international business consultant with RMCC Investment LLC (since 1994) > Master degree in tourism and business from Virginia Commonwealth University Tieliang Liu Independent Director
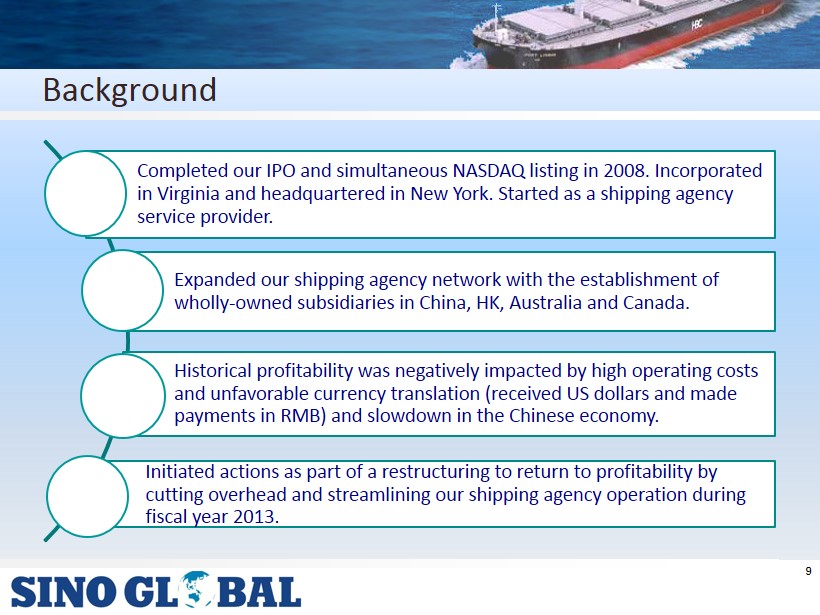
Background Completed our IPO and simultaneous NASDAQ listing in 2008. Incorporated in Virginia and headquartered in New York. Started as a shipping agency service provider. Expanded our shipping agency network with the establishment of wholly - owned subsidiaries in China, HK, Australia and Canada. Historical profitability was negatively impacted by high operating costs and unfavorable currency translation (received US dollars and made payments in RMB) and slowdown in the Chinese economy. Initiated actions as part of a restructuring to return to profitability by cutting overhead and streamlining our shipping agency operation during fiscal year 2013. 9
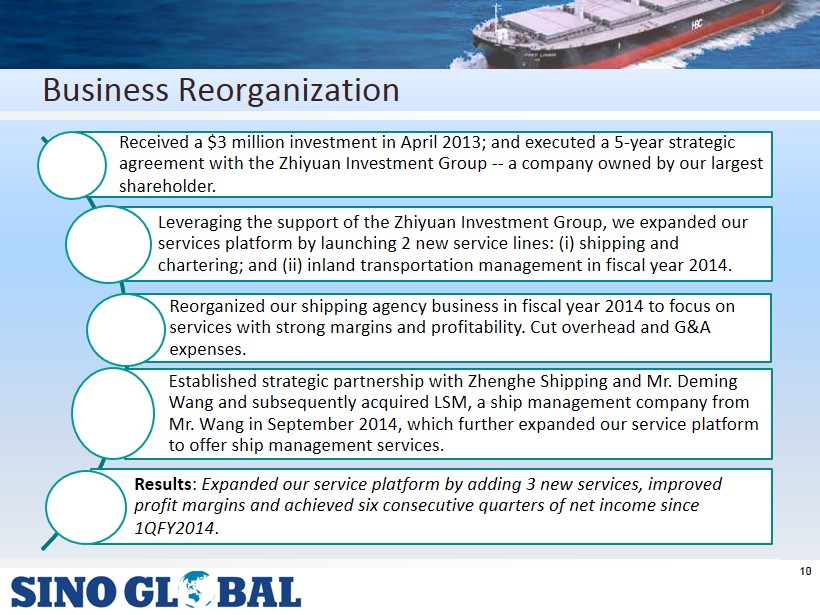
Business Reorganization Received a $3 million investment in April 2013; and executed a 5 - year strategic agreement with the Zhiyuan Investment Group -- a company owned by our largest shareholder. Leveraging the support of the Zhiyuan Investment Group, we expanded our services platform by launching 2 new service lines: (i) shipping and chartering; and (ii) inland transportation management in fiscal year 2014. Reorganized our shipping agency business in fiscal year 2014 to focus on services with strong margins and profitability. Cut overhead and G&A expenses. Results : Expanded our service platform by adding 3 new services, improved profit margins and achieved six consecutive quarters of net income since 1QFY2014 . Established strategic partnership with Zhenghe Shipping and Mr. Deming Wang and subsequently acquired LSM, a ship management company from Mr. Wang in September 2014, which further expanded our service platform to offer ship management services. 10
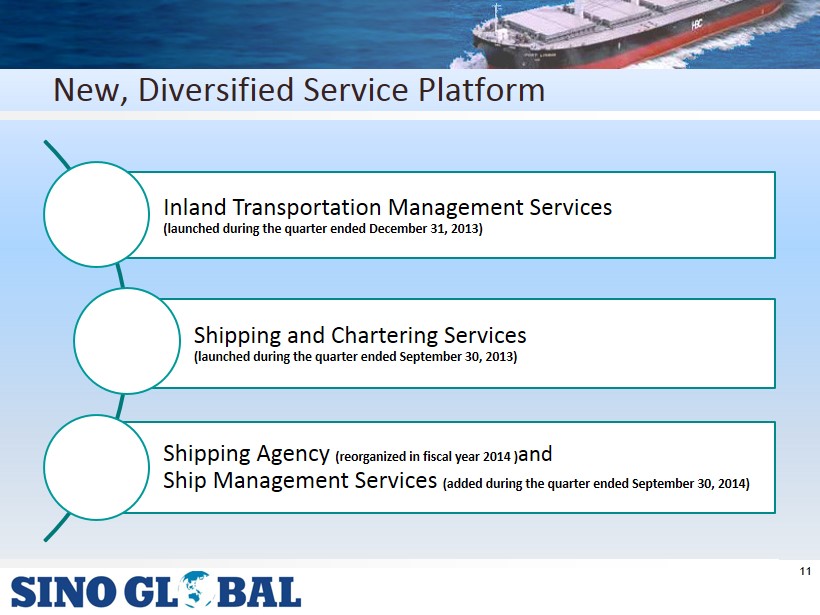
New, Diversified Service Platform Inland Transportation Management Services (launched during the quarter ended December 31, 2013) Shipping and Chartering Services (launched during the quarter ended September 30, 2013) Shipping Agency (reorganized in fiscal year 2014 ) and Ship Management Services (added during the quarter ended September 30, 2014) 11
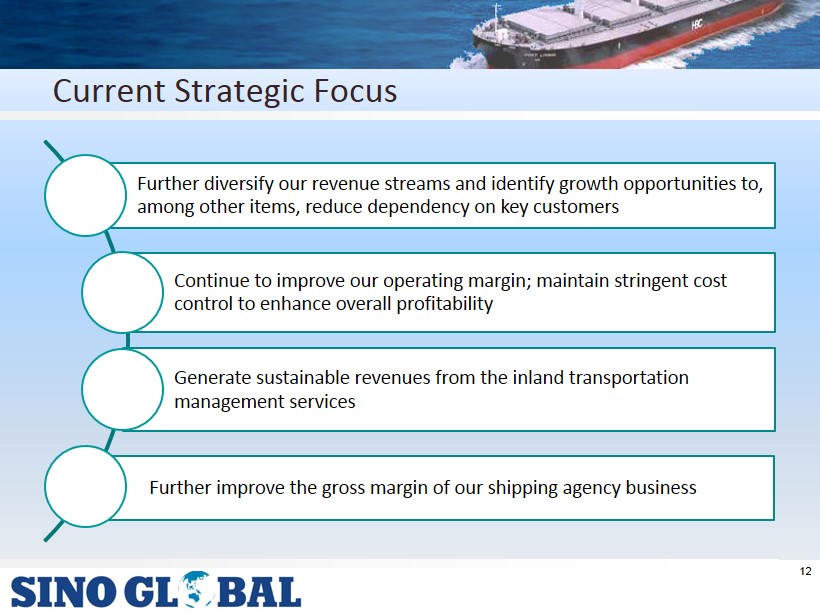
Current Strategic Focus Further diversify our revenue streams and identify growth opportunities to, among other items, reduce dependency on key customers Continue to improve our operating margin; maintain stringent cost control to enhance overall profitability Generate sustainable revenues from the inland transportation management services Further improve the gross margin of our shipping agency business 12
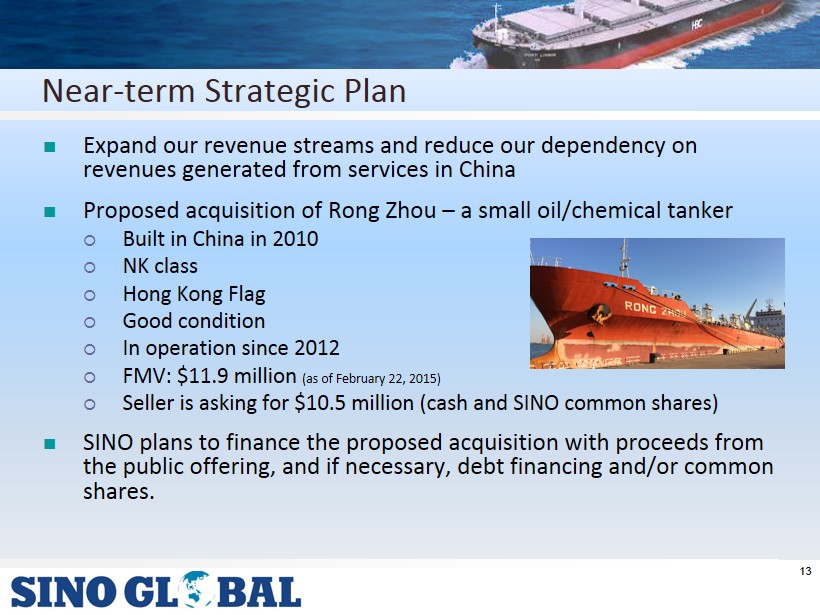
Near - term Strategic Plan Expand our revenue streams and reduce our dependency on revenues generated from services in China Proposed acquisition of Rong Zhou – a small oil/chemical tanker Built in China in 2010 NK class Hong Kong Flag Good condition In operation since 2012 FMV: $11.9 million (as of February 22, 2015) Seller is asking for $10.5 million (cash and SINO common shares) SINO plans to finance the proposed acquisition with proceeds from the public offering, and if necessary, debt financing and/or common shares. 13
Accretive Acquisition Based on our due diligence, Rong Zhou (RZ) generated unaudited revenues of over $5 million and pretax income in excess of $2 million in calendar 2014 RZ is operating in a market segment in which specialty vessels are in demand; rates are relatively stable and likely to increase in 2016 SINO will manage the vessel internally; no significant overhead expected RZ is expected to generate EBITDA of $0.5 million in fiscal year 2015 $2.3 million in fiscal year 2016 Conclusion : SINO believes the acquisition of RZ will increase its revenues and net profitability, as well as enhancing its ability to generate sustainable earnings, strengthen its balance sheet and reduce its dependency on related parties. 14
15 Other Growth Opportunities
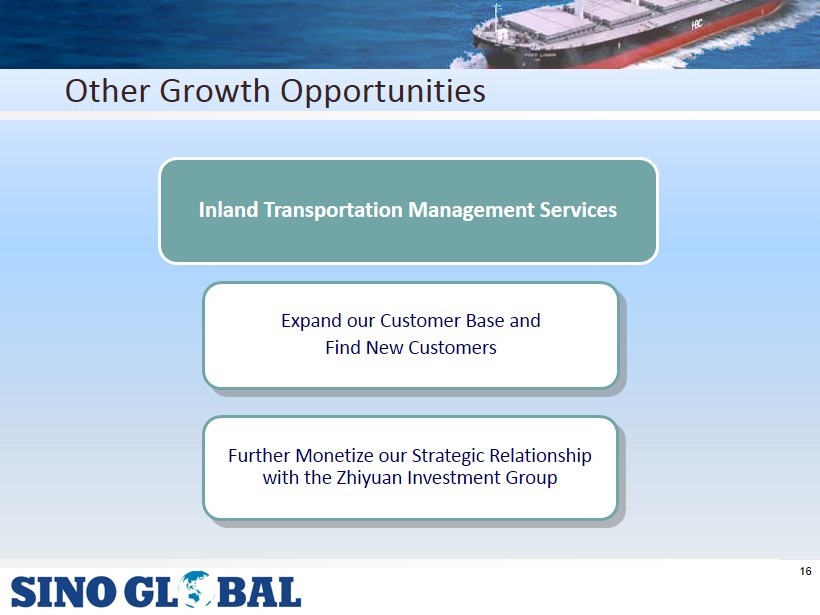
Inland Transportation Management Services Other Growth Opportunities 16 Further Monetize our Strategic Relationship with the Zhiyuan Investment Group Expand our Customer Base and Find New Customers
Shipping Agency Services Other Growth Opportunities 17 Develop Agency Network Secure well - established local agents via contractual profit - sharing agreements and designate them as exclusive agents in the ports they service Develop New Opportunities Abroad Develop new business activities at the loading ports in Australia, Canada, South Africa, Brazil and other countries to which China has major trading activities Explore Cross - referral Opportunities Leverage our integrated agency network to drive referral business opportunities and additional revenues
18 Financial Highlights
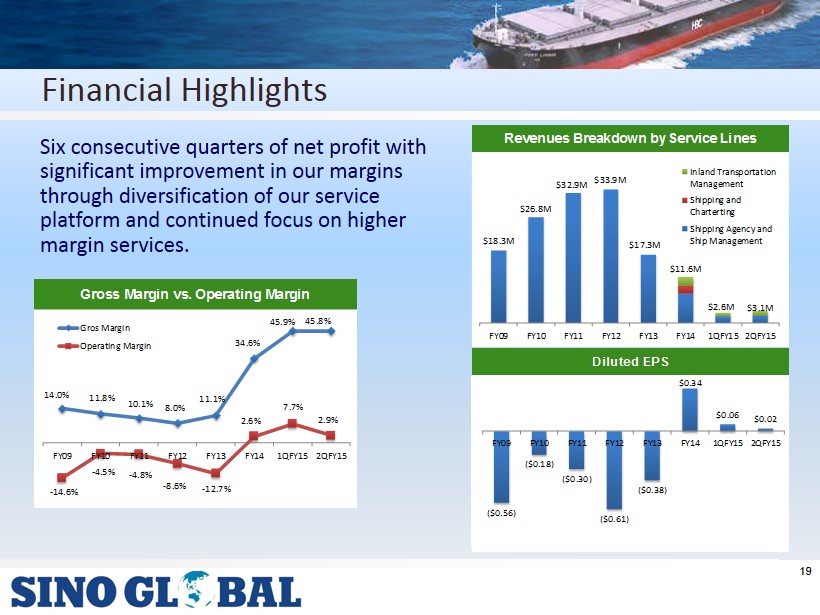
Financial Highlights 19 Six consecutive quarters of net profit with significant improvement in our margins through diversification of our service platform and continued focus on higher margin services. Gross Margin vs. Operating Margin 14.0% 11.8% 10.1% 8.0% 11.1% 34.6% 45.9% 45.8% - 14.6% - 4.5% - 4.8% - 8.6% - 12.7% 2.6% 7.7% 2.9% FY09 FY10 FY11 FY12 FY13 FY14 1QFY15 2QFY15 Gros Margin Operating Margin Diluted EPS ($0.56) ($0.18) ($0.30) ($0.61) ($0.38) $0.34 $0.06 $0.02 FY09 FY10 FY11 FY12 FY13 FY14 1QFY15 2QFY15 Revenues Breakdown by Service Lines $18.3M $26.8M $32.9M $33.9M $17.3M $11.6M $2.6M $3.1M FY09 FY10 FY11 FY12 FY13 FY14 1QFY15 2QFY15 Inland Transportation Management Shipping and Charterting Shipping Agency and Ship Management
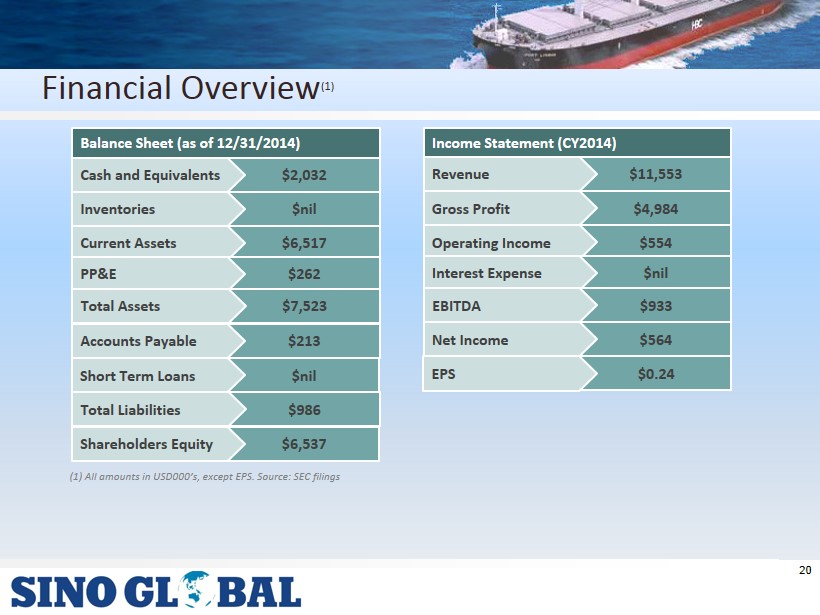
Financial Overview (1) ( 1 ) All amounts in USD 000 ’s, except EPS . Source : SEC filings $2,032 Cash and Equivalents $nil Inventories $6,517 Current Assets Balance Sheet (as of 12/31/2014) $ 262 PP&E $7,523 Total Assets $ 213 Accounts Payable $nil Short Term Loans $11,553 Revenue $4,984 Gross Profit $ 554 Operating Income Income Statement ( CY 2014) $nil Interest Expense $933 EBITDA $ 564 Net Income $0.24 EPS $ 986 Total Liabilities $6,537 Shareholders Equity 20
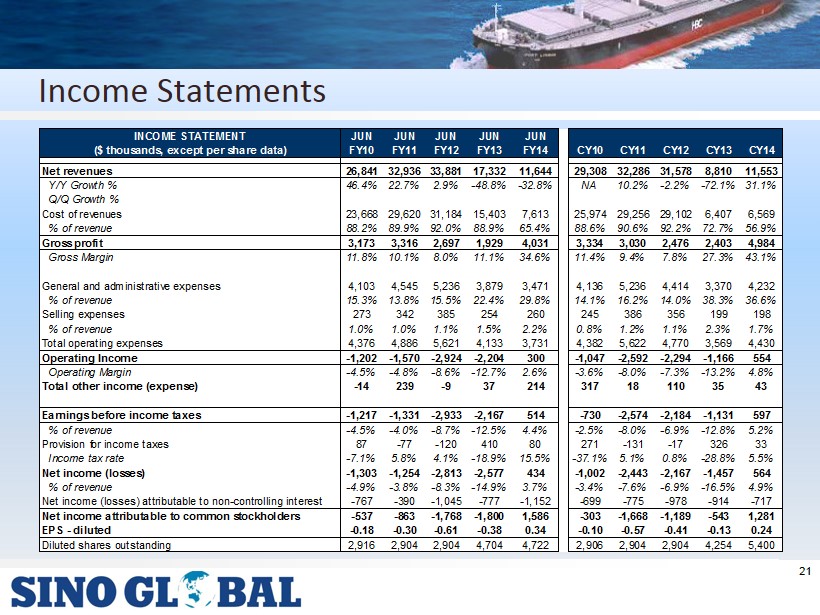
Income Statements 21 INCOME STATEMENT JUN JUN JUN JUN JUN ($ thousands, except per share data) FY10 FY11 FY12 FY13 FY14 CY10 CY11 CY12 CY13 CY14 Net revenues 26,841 32,936 33,881 17,332 11,644 29,308 32,286 31,578 8,810 11,553 Y/Y Growth % 46.4% 22.7% 2.9% -48.8% -32.8% NA 10.2% -2.2% -72.1% 31.1% Q/Q Growth % Cost of revenues 23,668 29,620 31,184 15,403 7,613 25,974 29,256 29,102 6,407 6,569 % of revenue 88.2% 89.9% 92.0% 88.9% 65.4% 88.6% 90.6% 92.2% 72.7% 56.9% Gross profit 3,173 3,316 2,697 1,929 4,031 3,334 3,030 2,476 2,403 4,984 Gross Margin 11.8% 10.1% 8.0% 11.1% 34.6% 11.4% 9.4% 7.8% 27.3% 43.1% General and administrative expenses 4,103 4,545 5,236 3,879 3,471 4,136 5,236 4,414 3,370 4,232 % of revenue 15.3% 13.8% 15.5% 22.4% 29.8% 14.1% 16.2% 14.0% 38.3% 36.6% Selling expenses 273 342 385 254 260 245 386 356 199 198 % of revenue 1.0% 1.0% 1.1% 1.5% 2.2% 0.8% 1.2% 1.1% 2.3% 1.7% Total operating expenses 4,376 4,886 5,621 4,133 3,731 4,382 5,622 4,770 3,569 4,430 Operating Income -1,202 -1,570 -2,924 -2,204 300 -1,047 -2,592 -2,294 -1,166 554 Operating Margin -4.5% -4.8% -8.6% -12.7% 2.6% -3.6% -8.0% -7.3% -13.2% 4.8% Total other income (expense) -14 239 -9 37 214 317 18 110 35 43 Earnings before income taxes -1,217 -1,331 -2,933 -2,167 514 -730 -2,574 -2,184 -1,131 597 % of revenue -4.5% -4.0% -8.7% -12.5% 4.4% -2.5% -8.0% -6.9% -12.8% 5.2% Provision for income taxes 87 -77 -120 410 80 271 -131 -17 326 33 Income tax rate -7.1% 5.8% 4.1% -18.9% 15.5% -37.1% 5.1% 0.8% -28.8% 5.5% Net income (losses) -1,303 -1,254 -2,813 -2,577 434 -1,002 -2,443 -2,167 -1,457 564 % of revenue -4.9% -3.8% -8.3% -14.9% 3.7% -3.4% -7.6% -6.9% -16.5% 4.9% Net income (losses) attributable to non-controlling interest -767 -390 -1,045 -777 -1,152 -699 -775 -978 -914 -717 Net income attributable to common stockholders -537 -863 -1,768 -1,800 1,586 -303 -1,668 -1,189 -543 1,281 EPS - diluted -0.18 -0.30 -0.61 -0.38 0.34 -0.10 -0.57 -0.41 -0.13 0.24 Diluted shares outstanding 2,916 2,904 2,904 4,704 4,722 2,906 2,904 2,904 4,254 5,400
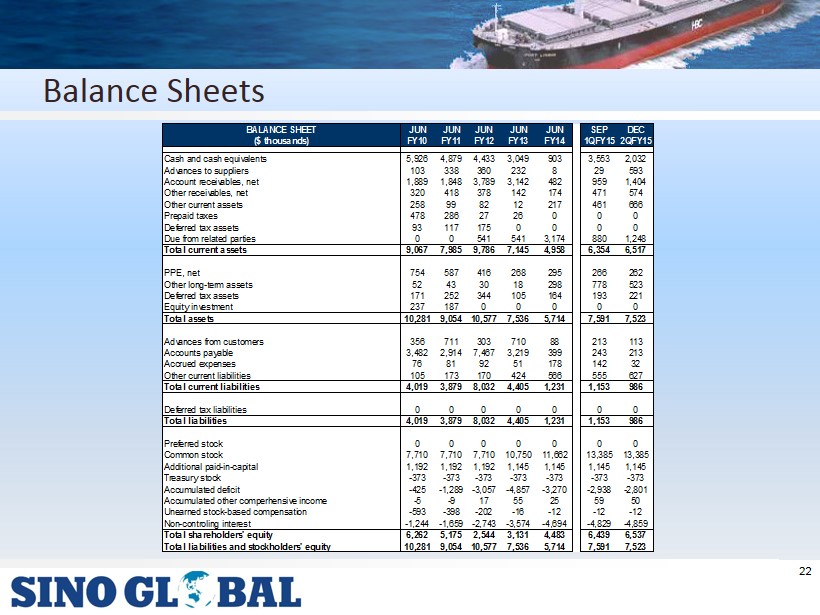
Balance Sheets 22 BALANCE SHEET JUN JUN JUN JUN JUN SEP DEC ($ thousands) FY10 FY11 FY12 FY13 FY14 1QFY15 2QFY15 Cash and cash equivalents 5,926 4,879 4,433 3,049 903 3,553 2,032 Advances to suppliers 103 338 360 232 8 29 593 Account receivables, net 1,889 1,848 3,789 3,142 482 959 1,404 Other receivables, net 320 418 378 142 174 471 574 Other current assets 258 99 82 12 217 461 666 Prepaid taxes 478 286 27 26 0 0 0 Deferred tax assets 93 117 175 0 0 0 0 Due from related parties 0 0 541 541 3,174 880 1,248 Total current assets 9,067 7,985 9,786 7,145 4,958 6,354 6,517 PPE, net 754 587 416 268 295 266 262 Other long-term assets 52 43 30 18 298 778 523 Deferred tax assets 171 252 344 105 164 193 221 Equity investment 237 187 0 0 0 0 0 Total assets 10,281 9,054 10,577 7,536 5,714 7,591 7,523 Advances from customers 356 711 303 710 88 213 113 Accounts payable 3,482 2,914 7,467 3,219 399 243 213 Accrued expenses 76 81 92 51 178 142 32 Other current liabilities 105 173 170 424 566 555 627 Total current liabilities 4,019 3,879 8,032 4,405 1,231 1,153 986 Deferred tax liabilities 0 0 0 0 0 0 0 Total liabilities 4,019 3,879 8,032 4,405 1,231 1,153 986 Preferred stock 0 0 0 0 0 0 0 Common stock 7,710 7,710 7,710 10,750 11,662 13,385 13,385 Additional paid-in-capital 1,192 1,192 1,192 1,145 1,145 1,145 1,145 Treasury stock -373 -373 -373 -373 -373 -373 -373 Accumulated deficit -425 -1,289 -3,057 -4,857 -3,270 -2,938 -2,801 Accumulated other comperhensive income -5 -9 17 55 25 59 50 Unearned stock-based compensation -593 -398 -202 -16 -12 -12 -12 Non-controling interest -1,244 -1,659 -2,743 -3,574 -4,694 -4,829 -4,859 Total shareholders' equity 6,262 5,175 2,544 3,131 4,483 6,439 6,537 Total liabilities and stockholders' equity 10,281 9,054 10,577 7,536 5,714 7,591 7,523
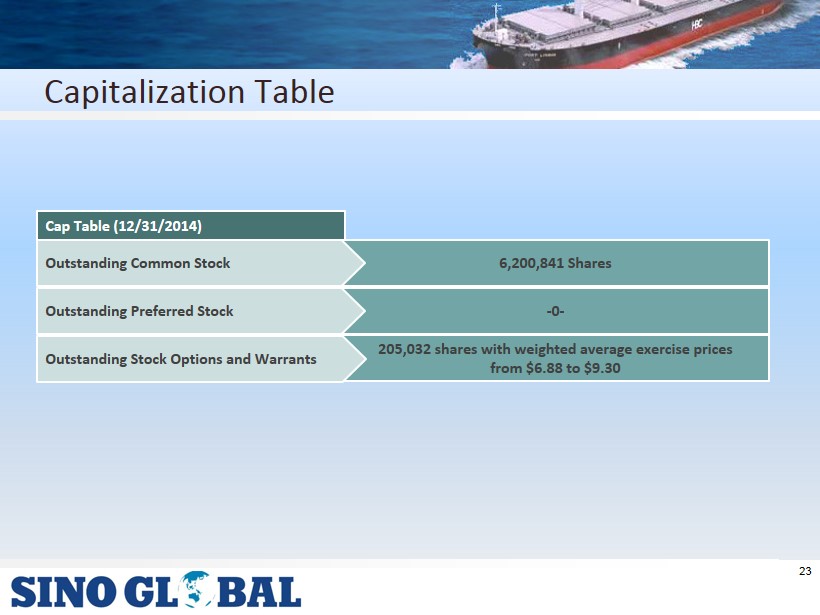
Capitalization Table 23 6,200,841 Shares Outstanding Common Stock 205,032 shares with weighted average exercise prices from $6.88 to $9.30 Outstanding Stock Options and Warrants Cap Table (12/31/2014) - 0 - Outstanding Preferred Stock
Key Takeaways 24 Experienced Management Team Six consecutive quarters of net profit Strong gross and operating margins Significant growth opportunities with vessel acquisition